theDOIsuffix \Volume \Issue \Copyrightissue \Month \Year
date? \Reviseddatedate? \Accepteddatedate? \Dateposteddate?
Equation of state for dense hydrogen and plasma phase transition
Abstract.
We calculate the equation of state of dense hydrogen within the chemical picture. Fluid variational theory is generalized for a multi-component system of molecules, atoms, electrons, and protons. Chemical equilibrium is supposed for the reactions dissociation and ionization. We identify the region of thermodynamic instability which is related to the plasma phase transition. The reflectivity is calculated along the Hugoniot curve and compared with experimental results. The equation-of-state data is used to calculate the pressure and temperature profiles for the interior of Jupiter.
keywords:
equation of state, dense hydrogen, phase transitionspacs Mathematics Subject Classification:
51.30+i, 52.25.Jm, 52.25.Kn, 52.35.Tc1. Introduction
The equation of state (EOS) of hydrogen and helium at high pressures is of great relevance for models of the interior of giant planets and other astrophysical objects as well as for inertial confinement fusion experiments. For detailed calculations accurate knowledge of the EOS over a wide range of densities and temperatures is needed. Especially, in the range of warm dense matter with high densities characteristic for condensed matter and at temperatures of a few eV the EOS is crucial for modelling giant planets. This region is challenging for many-particle theory because strong correlations dominate the physical behavior. Progress in shock-wave experimental technique has allowed to study this region only recently.
To probe the EOS, experimental investigations were performed statically with diamond anvil cells or dynamically by using shock waves, see [1] for a recent review. The experimental data indicate that a nonmetal-to-metal transition occurs at about 1 Mbar which is identified by a strong increase of the conductivity [2] and reflectivity [3]. Some theoretical models yield a thermodynamic instability in this transition region, the plasma phase transition (PPT) [4, 5, 6, 7, 8], which would strongly affect models for planetary interiors and the evolution of giant planets [9, 10, 11]. After a long period of controversial discussions, new results of shock wave experiments on deuterium support the existence of such a PPT [12]. This fundamental problem of high-pressure physics will also be studied with the FAIR facility at GSI Darmstadt within the LAPLAS project, see [13, 14].
In this paper we present new results for the EOS of dense hydrogen within the chemical picture. We treat the reactions pressure dissociation and ionization self-consistently via respective mass action laws. We identify the region of thermodynamic instability and calculate the phase diagram as well as the reflectivity in order to verify the corresponding nonmetal-to-metal transition. The EOS data is used to model the interior of Jupiter within a three-layer model. The agreement with astrophysical constraints such as the core mass and the fraction of heavier elements can serve as an additional test of the theoretical EOS.
2. Equation of state for dense hydrogen
Warm dense hydrogen is considered as a partially ionized plasma in the chemical picture. A mixture of a neutral component (atoms and molecules) and a plasma component (electrons and protons) is in chemical equilibrium with respect to dissociation and ionization. The EOS is derived from an expression for the free energy of the neutral () and charged particles (), see [15, 16]:
| (1) |
The first two terms consist of ideal and interaction contributions and can be written as and . contains interaction terms between charged and neutral components caused by polarization [17].
Applying fluid variational theory (FVT), the EOS is determined by calculating the free energy via the Gibbs-Bogolyubov inequality [18]. This method has been generalized to two-component systems with a reaction [19, 20, 21] so that also molecular systems at high pressure can be treated where pressure dissociation occurs, e.g. H 2H for hydrogen. In chemical equilibrium, is fulfilled, and the number of atoms and molecules can be determinded self-consistently via the chemical potentials . The effective interactions between the neutral species are modeled by exp-6 potentials, and the free energy of a multi-component reference system of hard spheres has to be known; for details, see [19, 20, 22].
The charged component is treated by using efficient Padé approximations for the free energy developed by Chabrier and Potekhin [23]. The coupling with the neutral component occurs via the ionization equilibrium, He+p. In chemical equilibrium, the relation determines the degree of ionization.
Since atoms and molecules are particles of finite size there is an additional interaction between the charged component and the neutral fluid. According to the concept of reduced volume, point-like particles cannot penetrate into the volume occupied by atoms and molecules. This leads to a correction in the description of the ideal gas of the charged component [24, 25] so that the ideal free energy of protons and electrons is dependent on the reduced volume ,
| (2) |
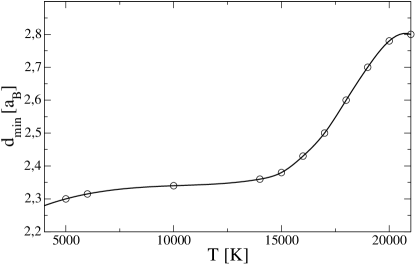
where is the ratio of the volume which cannot be penetrated by point-like particles to the total volume. It is derived from hard sphere diameters obtained within the FVT self-consistently. The free energy density is given by Fermi integrals which take into account quantum effects. In order to avoid an intersection of pressure isotherms, which is important for modelling planetary interiors, a minimum diameter has been introduced. It was determined starting at low temperatures where it remains almost constant up to 15.000 K, then it increases up to 20.000 K and remains constant again for higher temperatures, see Fig. 1. These values are in the range of the results for the diameter of the hydrogen atom derived from the confined atom model [26].
Consequently, the reduced volume concept changes the chemical potential of each component drastically at higher densities and results in pressure ionization. This is due to the fact that additional terms appear in the chemical potential, which is the particle number derivative of the free energy, and thermodynamic functions of degenerate plasmas are very sensitive to changes in density.
This current model FVT+ includes all interaction contributions to the chemical potentials, thus being a generalization of earlier work [22] where only ideal plasma contributions have been treated (FVT).
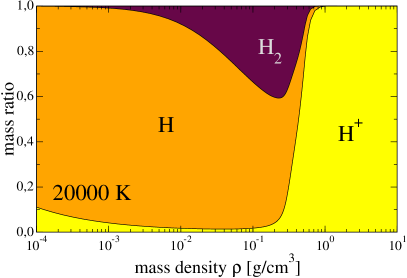
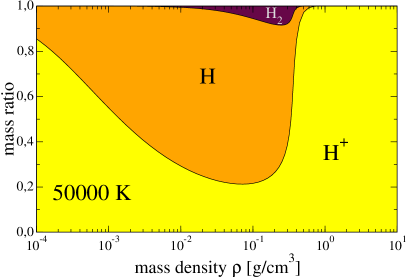
In Fig. 2 the composition of hydrogen derived from the present approach is shown for two temperatures. Hydrogen is an atomic gas at low temperatures (left) and low densities. With increasing densities molecules are formed due to the mass action law. Pressure dissociation and ionization can be observed in the high-density region. The nonideality corrections to the free energy force a transition from a molecular fluid to a fully ionized plasma. At higher temperatures (right) the formation of molecules is suppressed and pressure ionization becomes the dominating process. At low densities and high temperatures a fully ionized plasma is produced due to thermal ionization.
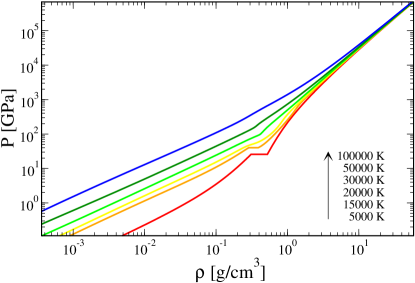
We show pressure isotherms over a wide range of temperatures and densities in Fig. 3. At low densities the system behaves like a neutral fluid. Between densities of 10-3 g/cm3 and 10-1 g/cm3 nonideality corrections to the free energy of atoms and molecules lead to a nonlinear behavior of the isotherms. For still higher densities a phase transition occurs which is treated by a Maxwell construction. The thermodynamic instability vanishes with increasing temperatures, and the critical point is located at 16.800 K, 0.35 g/cm3, and 45 GPa.
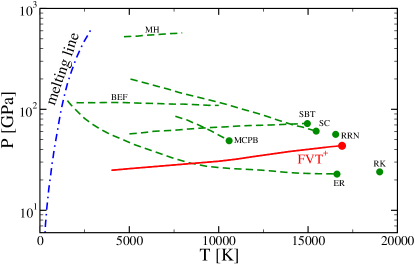
The critical point and the related coexistence line are shown in Fig. 4 and compared with results of other EOS. The critical point itself lies within the range of other predictions, whereas the coexistence line is lower than most of the other results. For a comparison of data concerning the PPT, see Table 1.
New shock-wave experiments [12] imply that a PPT occurs in deuterium at densities of 1.5 g/cm3 and a coexistence pressure of about 1 megabar. Each of these values is twice as high as evaluated in the recent model.
| Method | Authors | Reference | |||
| (103 K) | (GPa) | (g/cm3) | |||
| 12.6 | 95 | 0.95 | PIP | Ebeling/Sändig (1973) | [34] |
| 19 | 24 | 0.14 | PIP | Robnik/Kundt (1983) | [27] |
| 16.5 | 22.8 | 0.13 | PIP | Ebeling/Richert (1985) | [29] |
| 16.5 | 95 | 0.43 | PIP | Haronska et al. (1987) | [35] |
| 15 | 64.6 | 0.36 | PIP | Saumon/Chabrier (1991) | [4] |
| 15.3 | 61.4 | 0.35 | PIP | Saumon/Chabrier (1992) | [5] |
| 14.9 | 72.3 | 0.29 | PIP | Schlanges et al. (1995) | [30] |
| 16.5 | 57 | 0.42 | PIP | Reinholz et al. (1995) | [31] |
| 11 | 55 | 0.25 | PIMC | Magro et al. (1996) | [33] |
| 20.9 | 0.3 | 0.002 | Kitamura/Ichimaru (1998) | [36] | |
| 16.8 | 45 | 0.35 | PIP | present FVT+ |
3. Conductivity and reflectivity
The PPT is an instability driven by the nonmetal-to-metal transition (pressure ionization). We calculate the electrical conductivity as well as the reflectivity by applying the COMPTRA04 program package [39, 40] in order to locate this transition in the density-temperature plane.
Optical properties are calculated within the Drude model. The reflectivity is given in the long-wavelength limit via the dielectric function which is determined by a dynamic collision frequency or, alternatively, by the dynamic conductivity [41]:
| (3) | |||||
| (4) | |||||
| (5) |
is the plasma frequency of the electrons.
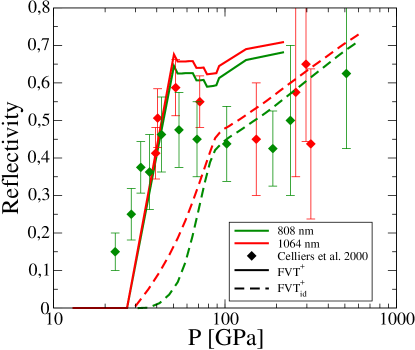
The reflectivity was determined along the Hugoniot curve and is compared with experimental results [3] and those of the earlier model FVT [42] in Fig. 5. The results of the current model show a much better agreement with the experiment. The characteristic and abrupt rise with increasing pressure was reproduced more accurately. This drastic increase appears due to pressure ionization in the vicinity of the criotical point of the PPT. As a result, the reflectivity advances from very low values to metallic-like ones almost instantly.
4. Planetary interiors
Modelling the interiors of giant planets and comparison with their observational parameters offers an alternative tool besides laboratory experiments of probing the EOS of the components the planets are predominantly made of. Giant planets such as Jupiter and Saturn consist mainly of hydrogen and, in decreasing order, of helium, water and rocks, covering a wide range of pressures and temperatures. Independently from the H-EOS used for modelling, the simplest interior structure that is compatible with the observational constraints requires at least three homogenous layers with a transition from a cold molecular fluid in the outer envelope to a pressure ionized plasma in the deep interior and a dense solid core of ices and rocks. A solid core may be explained as a result of the formation process and the seperation into two fluid envelopes with different particle abundances by an existence of a PPT as provided by the FVT+ EOS. The constraining observational parameters are the total mass of the planet , its equatorial radius , the temperature at the outer boundary, the average helium content , the period of rotation and the gravitational moments . From measurements of the luminosity it has been argued [43] that the temperature profile should be adiabatic. For a given EOS, the interior profiles of pressure and density are calculated by integration of the equation of hydrostatic equilibrium
| (6) |
along an isentrope defined by the outer boundary. The first term on the right hand side of eq. (6) is the gravitational potential and the second term the centrifugal potential assuming axialsymmetric rotation. We apply the theory of figures [44] up to third order to solve this equation and to calculate the gravitational moments. They are defined as the coefficients of the expansion of the gravitational potential into Legendre polynomials, taken at the outer boundary. Being integrals of the density distribution weighted by some power of the radius, they are very sensitive with respect to the amount and distribution of helium and heavier elements within the planet.
In accordance with previous calculations [45, 46], mixtures of hydrogen with helium and heavier elements have been derived from the EOS of the pure materials via the additive volume rule. It states that the entropy of mixing can be neglected.
Assuming a three-layer structure, we present results for Jupiter for the profiles of temperature, density, and pressure along the radius in Fig. 6 using two different H-EOS, the standard Sesame table 5251 for hydrogen [47] and the FVT+ model presented above.
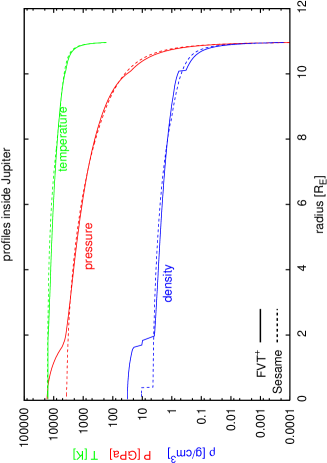
The profiles of temperature appear very similar, meaning a small uncertainty about the real profiles. Contrary, the density and pressure profiles exhibit more differences and require some explanation. In the fluid part of Jupiter, the presence of a PPT leads to a jump in density between the envelopes. Since the gravitational moments as integrals over the density have to be the same for both H-EOS, the density profile of a H-EOS with PPT has to be smaller in the outer envelope and larger in the inner envelope. The different size and composition of the core for these specific H-EOS are a consequence of their different compressibility in the regime of pressure ionization at about 1 Mbar, where the gravitational moments are most sensitive to the density distribution.
In case of a stiff H-EOS like Sesame, a larger amount of heavy elements is needed in the two fluid envelopes to compensate for the smaller hydrogen density at a given pressure. As a result, this material is added to the well-known density-pressure relation of degenerate electrons in the deep interior, leaving less material for the core. Thus, in case of the Sesame-EOS, the amount of heavy elements becomes with 10% very large and an unlikely solution with a very small core of light material (e.g. water) can be found.
In case of the FVT+ EOS which is more compressible than the Sesame EOS at about 1 Mbar, the helium content is below the value of 27.5% for the protosolar cloud in order to reproduce the lowest gravitational moment . Furthermore, the next gravitational moment cannot be reproduced correctly because the transition to the metallic envelope occurs already at about 90% of the radius and, thus, at too low densities. For opposite reasons, both the Sesame and FVT+ EOS applied in a three-layer model of Jupiter are not compatible with all of the observational constraints. While Sesame is probably too stiff, the FVT+ model is likely too soft in the WDM region at about 1 Mbar.
5. Conclusions
In this paper, we have extended the earlier chemical model FVT to calculate the EOS of dense hydrogen. The current model FVT+ includes nonideality corrections to the free energy of each commponent of the partially ionized plasma. We have shown results for the composition and the thermodynamic properties of dense hydrogen. The PPT was located in the phase diagram, its critical point coincides with earlier results. Furthermore, we have determined optical properties such as reflectivity and conductivity, within linear response theory using the program package COMPTRA04. The calculated reflectivity along the experimental Hugoniot curve shows a good agreement with the experiments. However, application of the FVT+ EOS to the interior structure of Jupiter indicates that the behavior at about 1 Mbar is probably too soft. The same conclusion can be drawn from a comparison with shock-wave experiments that indicate the existence of a PPT [12]. FVT+ predicts the PPT at too low pressures as well as at too low densities. Further efforts to solve this problem, especially concerning the reduced volume concept, are necessary.
We thank P. M. Celliers, W. Ebeling, V. E. Fortov, V. K. Gryaznov, W.-D. Kraeft, and G. Röpke for stimulating discussions. This work was supported by the DFG within the SFB 652 Strongly Correlated Matter in Radiation Fields and the GRK 567 Strongly Correlated Many Particle Systems.
References
- [1] W. J. Nellis, Rep. Prog. Phys. 69, 1479 (2006).
- [2] S. T. Weir, A. C. Mitchell, W. J. Nellis, Phys. Rev. Lett. 76, 1860 (1996).
- [3] P. M. Celliers et al., Phys. Rev. Lett. 84, 5564 (2000).
- [4] D. Saumon and G. Chabrier, Phys. Rev. A 44, 5122 (1991).
- [5] D. Saumon and G. Chabrier, Phys. Rev. A 46, 2084 (1992).
- [6] W. Ebeling and G. Norman, J. Stat. Phys. 110 861 (2003).
- [7] W. Ebeling, H. Hache, H. Juranek, R. Redmer, and G. Röpke, Contrib. Plasma Phys. 45 160 (2005).
- [8] V. S. Filinov et al., J. Phys. A: Math. Gen. 39, 4421 (2006).
- [9] D. Saumon, W. B. Hubbard, G. Chabrier, and H. M. Van Horn, Astrophys. J. 391 827 (1992).
- [10] G. Chabrier, D. Saumon, W. B. Hubbard, and J. I. Lunine, Astrophys. J. 391 817 (1992).
- [11] D. J. Stevenson, J. Phys.: Condens. Matt. 10 11227 (1998).
- [12] V. E. Fortov et al., unpublished.
- [13] N. A. Tahir, H. Juranek, A. Shutov, R. Redmer, A. R. Piriz, M. Temporal, D. Varentsov, S. Udrea, D. H. H. Hoffmann, C. Deutsch, I. Lomonosov, V. E. Fortov, Phys. Rev. B 67, 184101 (2003).
- [14] N. A. Tahir et al., Contrib. Plasma Phys. (this issue).
- [15] H. Juranek, N. Nettelmann, S. Kuhlbrodt, V. Schwarz, B. Holst, and R. Redmer, Contrib. Plasma Phys. 45, 432 (2005).
- [16] R. Redmer, B. Holst, H. Juranek, N. Nettelmann, and V. Schwarz, J. Phys. A: Math. Gen. 39, 4479 (2006).
- [17] R. Redmer and G. Röpke, Physica A 130, 523 (1985).
- [18] M. Ross, F. H. Ree, and D. A. Young, J. Chem. Phys. 79, 1487 (1983).
- [19] H. Juranek and R. Redmer, J. Chem. Phys. 112, 3780 (2000).
- [20] H. Juranek, R. Redmer, and Y. Rosenfeld, J. Chem. Phys. 117, 1768 (2002).
- [21] Qi-Feng Chen et al., J. Chem. Phys. 124, 074510 (2006).
- [22] V. Schwarz, H. Juranek, R. Redmer, Phys. Chem. Chem. Phys. 7, 1990 (2005).
- [23] G. Chabrier and A. Y. Potekhin, Phys. Rev. E 58, 4941 (1998).
- [24] A. G. McLellan and B. J. Alder, J. Chem. Phys. 24, 115 (1956).
- [25] T. Kahlbaum and A. Förster, Fluid Phase Equilibria 76, 71 (1992).
- [26] H. C. Graboske, Jr., D. J. Harwood, and F. J. Rogers, Phys. Rev. 186, 210 (1969).
- [27] M. Robnik and W. Kundt, Astron. Astrophys 120, 227 (1983).
- [28] M. S. Marley and W. B. Hubbard, Icarus 88, 536 (1988).
- [29] W. Ebeling and W. Richert, phys. stat. sol. (b) 128, 467 (1985); Phys. Lett. A 108, 80 (1985); Contrib. Plasma Phys. 25, 1 (1985).
- [30] M. Schlanges, M. Bonitz, and A. Tschttschjan, Contrib. Plasma Phys. 35, 109 (1995).
- [31] H. Reinholz, R. Redmer, and S. Nagel, Phys. Rev. E 52, 5368 (1995).
- [32] D. Beule, W. Ebeling, A. Förster, H. Juranek, S. Nagel, R. Redmer, and G. Röpke, Phys. Rev. B 59, 14 177 (1999).
- [33] W. R. Magro, D. M. Ceperley, C. Pierleoni, and B. Bernu, Phys. Rev. Lett. 76, 1240 (1996).
- [34] W. Ebeling and R. Sändig, Annalen der Physik 28, 289 (1973).
- [35] P. Haronska, D. Kremp, and M. Schlanges, Wiss. Zeit. Univ. Rostock 36, 98 (1987).
- [36] H. Kitamura and S. Ichimaru, J. Phys. Soc. Jap. 67, 950 (1998).
- [37] Ya. B. Zeldovich and L. D. Landau, Zh. Eksp. Teor. Fiz. 14, 32 (1944).
- [38] G. E. Norman and A. N. Starostin, High Temp. 6, 394 (1968); ibid. 8, 381 (1970).
- [39] S. Kuhlbrodt, B. Holst, R. Redmer, Contrib. Plasma Phys. 45, 73 (2005).
- [40] The COMPTRA04 source code and data files can be found at http://www.mpg.uni-rostock.de/sp/pages/comptra.
- [41] H. Reinholz et al., Phys. Rev. E 68, 036403 (2003).
- [42] R. Redmer, H. Juranek, N. Nettelmann, and B. Holst, AIP Conf. Proc. 845, 127 (2006).
- [43] W. B. Hubbard, Astrophys. J. 152, 745 (1968).
- [44] V. N. Zharkov and V. P. Trubytsin, Physics of planetary Interiors, in: Astronomy and Astrophysics Series (Pachart, Tucson/AZ, 1978)
- [45] G. Chabrier, D. Saumon, W. B. Hubbard, and J. I. Lunine, Astrophys. J. 391, 817 (1992).
- [46] D. Saumon and T. Guillot, Astrophys. J. 609, 1170 (2004).
- [47] Sesame table 5251 (1982), derived from Sesame table 5263, G. Kerley, Report LA-4776 (1972).