The transverse proximity effect in spectral hardness on the line of sight towards HE 23474342 ††thanks: Based on observations collected at the European Southern Observatory, Chile (Proposals 070.A-0425 and 074.A-0273). Data collected under Proposals 068.A-0194, 070.A-0376 and 116.A-0106 was obtained from the ESO Science Archive.
We report the discovery of 14 quasars in the vicinity of HE 23474342, one of the two quasars whose intergalactic He ii forest has been resolved with FUSE. By analysing the H i and the He ii opacity variations separately, no transverse proximity effect is detected near three foreground quasars of HE 23474342: QSO J235034328 (, ), QSO J235004319 (, ) and QSO J234954338 (, ). This is primarily due to line contamination and overdensities probably created by large-scale structure. By comparing the H i absorption and the corresponding He ii absorption, we estimated the fluctuating spectral shape of the extragalactic UV radiation field along this line of sight. We find that the UV spectral shape near HE 23474342 and in the projected vicinity of the three foreground quasars is statistically harder than expected from UV background models dominated by quasars. In addition, we find three highly ionised metal line systems near the quasars. However, they do not yield further constraints on the shape of the ionising field. We conclude that the foreground quasars show a transverse proximity effect that is detectable as a local hardening of the UV radiation field, although the evidence is strongest for QSO J234954338. Thus, the relative spectral hardness traces the proximity effect also in overdense regions prohibiting the traditional detection in the H i forest. Furthermore, we emphasise that softening of quasar radiation by radiative transfer in the intergalactic medium is important to understand the observed spectral shape variations. From the transverse proximity effect of QSO J234954338 we obtain a lower limit on the quasar lifetime of Myr.
Key Words.:
quasars: general – quasars: absorption lines – intergalactic medium – diffuse radiation1 Introduction
After reionisation the intergalactic medium (IGM) is kept highly photoionised by the metagalactic UV radiation field generated by the overall population of quasars and star-forming galaxies (e.g. Haardt & Madau 1996; Fardal et al. 1998; Bianchi et al. 2001; Sokasian et al. 2003). The intensity and spectral shape of the UV background determines the ionisation state of the observable elements in the IGM. In particular, the remaining fraction of intergalactic neutral hydrogen and singly ionised helium is responsible for the Ly forest of H i and He ii.
On lines of sight passing near quasars the IGM will be statistically more ionised due to the local enhancement of the UV flux that should result in a statistically higher IGM transmission (’void’) in the QSO’s vicinity (Fardal & Shull 1993; Croft 2004; McDonald et al. 2005). This so-called proximity effect has been found with high statistical significance on lines of sight towards luminous quasars (e.g. Bajtlik et al. 1988; Giallongo et al. 1996; Scott et al. 2000). On the other hand, a transverse proximity effect created by foreground ionising sources nearby the line of sight has not been clearly detected in the H i forest, except the recent detection at by Gallerani et al. (2007). While two large H i voids have been claimed to be due to the transverse proximity effect by Dobrzycki & Bechtold (1991a, however see ) and Srianand (1997), other studies find at best marginal evidence (Fernández-Soto et al. 1995; Liske & Williger 2001), and most attempts resulted in non-detections (Crotts 1989; Møller & Kjærgaard 1992; Crotts & Fang 1998; Schirber et al. 2004; Croft 2004). This has led to explanations involving the systematic effects of anisotropic radiation, quasar variability (Schirber et al. 2004), intrinsic overdensities (Loeb & Eisenstein 1995; Rollinde et al. 2005; Hennawi & Prochaska 2007; Guimarães et al. 2007) and finite quasar lifetimes (Croft 2004).
Intergalactic He ii Ly absorption ( Å) can be studied only towards the few quasars at whose far UV flux is not extinguished by intervening Lyman limit systems (Picard & Jakobsen 1993; Jakobsen 1998). Of the six quasars successfully observed so far, the lines of sight towards HE~2347$-$4342 () and HS~1700$+$6416 () probe the post-reionisation era of He ii with an emerging He ii forest that has been resolved with FUSE (Kriss et al. 2001; Shull et al. 2004; Zheng et al. 2004; Fechner et al. 2006; Fechner & Reimers 2007a).
In a highly ionised IGM a comparison of the H i with the corresponding He ii absorption yields an estimate of the spectral shape of the UV radiation field due to the different ionisation thresholds of both species. The amount of He ii compared to H i gives a measure of the spectral softness, generally expressed via the column density ratio . Typically, indicates a hard radiation field generated by the surrounding quasar population, whereas requires a significant contribution of star-forming galaxies or heavily softened quasar radiation (e.g. Haardt & Madau 1996; Fardal et al. 1998; Haardt & Madau 2001).
The recent FUSE observations of the He ii Ly forest revealed large fluctuations () on small scales of with a median –100. Apart from scatter due to the low-quality He ii data at (Fechner et al. 2006; Liu et al. 2006) and possible systematic errors due to the generally assumed line broadening mechanism (Fechner & Reimers 2007a), several physical reasons for these variations have been proposed. A combination of local density variations (Miralda-Escudé et al. 2000), radiative transfer effects (Maselli & Ferrara 2005; Tittley & Meiksin 2006) and local differences in the properties of quasars may be responsible for the fluctuations. In particular, at any given point in the IGM at only a few quasars with a range of spectral indices (Telfer et al. 2002; Scott et al. 2004) contribute to the UV background at eV (Bolton et al. 2006).
Already low-resolution He ii spectra obtained with HST indicate a fluctuating radiation field, which has been interpreted as the onset of He ii reionisation in Strömgren spheres around hard He ii photoionising sources along or near the line of sight (Reimers et al. 1997; Heap et al. 2000; Smette et al. 2002). Jakobsen et al. (2003) found a quasar coinciding with the prominent He ii void at towards Q~0302$-$003, thereby presenting the first clear case of a transverse proximity effect. In Worseck & Wisotzki (2006), hereafter Paper I, we revealed the transverse proximity effect as a systematic increase in spectral hardness around all four known foreground quasars along this line of sight. This suggests that a hard radiation field is a sensitive probe of the transverse proximity effect even if there is no associated void in the H i forest, either because of the weakness of the effect, or because of large-scale structure.
Along the line of sight towards HE 23474342 several He ii voids have been claimed to be due to nearby unknown AGN (Smette et al. 2002). Likewise, some forest regions with a detected hard radiation field may correspond to proximity effect zones of putative foreground quasars (Fechner & Reimers 2007a). Here we report on results from a slitless spectroscopic quasar survey in the vicinity of HE 23474342 and on spectral shape fluctuations of the UV radiation field probably caused by foreground quasars towards the sightline of HE 23474342. The paper is structured as follows. Sect. 2 presents the observations and the supplementary data employed for the paper. Although we do not detect any transverse proximity effect in the H i forest (Sect. 3), the fluctuating UV spectral shape along the line of sight indicates a hard radiation field in the projected vicinity of the foreground quasars (Sect. 4). In Sect. 5 we study three nearby metal line systems which could further constrain the ionising field. We interpret the statistically significant excesses of hard radiation as being due to the transverse proximity effect (Sect. 6). We present our conclusions in Sect. 7. Throughout the paper we adopt a flat cosmological model with , and .
2 Observations and data reduction
2.1 Search for QSO candidates near HE 23474342
In October 2002 we observed a field centered on HE 23474342 () with the ESO Wide Field Imager (WFI, Baade et al. 1999) at the ESO/MPI 2.2 m Telescope (La Silla) in its slitless spectroscopic mode (Wisotzki et al. 2001) as part of a survey for faint quasars in the vicinity of established high-redshift quasars. A short summary of the survey is given in Paper I; a detailed description will follow in a separate paper.
A semi-automated search for emission line objects among the slitless spectra of the detected objects in the field resulted in 10 prime quasar candidates.
2.2 Spectroscopic follow-up
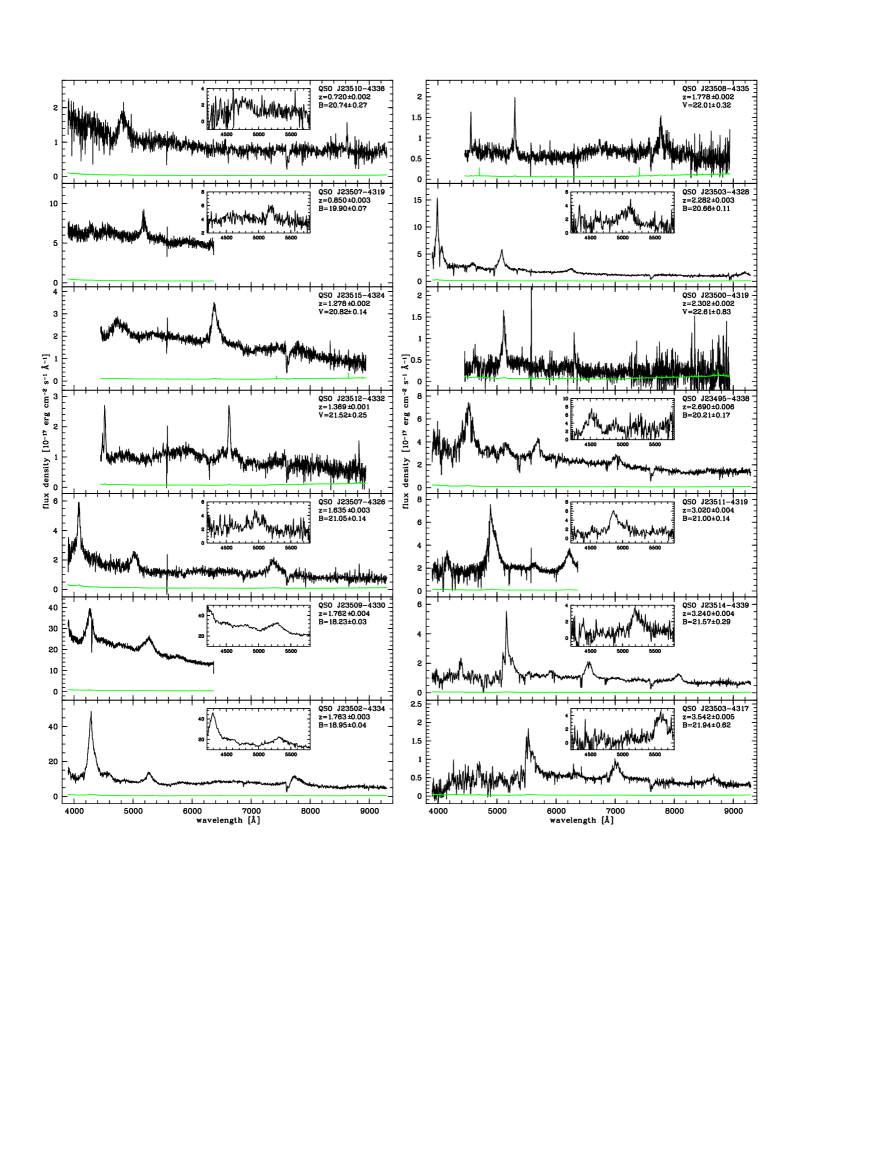
Follow-up spectroscopy of these 10 quasar candidates was obtained with the Focal Reducer/Low Dispersion Spectrograph 2 (FORS2, Appenzeller et al. 1998) on ESO VLT UT1/Antu in Visitor Mode on November 17 and 19, 2004 under variable seeing but clear conditions. The spectra were taken either with the 300V grism or the 600B grism and a 1″ slit kept at the parallactic angle, resulting in a spectral resolution of Å FWHM and Å FWHM, respectively. No order separation filter was employed, leading to possible order overlap at Å in the spectra taken with the 300V grism. Exposure times were adjusted to yield in the quasar continuum. The spectra were calibrated in wavelength against the FORS2 He/Ne/Ar/HgCd arc lamps and spectrophotometrically calibrated against the HST standard stars Feige 110 and GD 108. Data reduction was performed with standard IRAF tasks using the optimal extraction algorithm by Horne (1986). Figure 1 shows the spectra of the quasars together with 4 quasars from another survey (Sect. 2.3). Table 1 summarises our spectroscopic follow-up observations.
2.3 Additional quasars
We checked the ESO Science Archive for additional quasars in the vicinity of HE 23474342 and found several unpublished quasars from a deeper slitless spectroscopic survey using the ESO VLT, the results of which (on the field of Q 0302003) are described in Jakobsen et al. (2003). We obtained their follow-up spectra of quasars surrounding HE 23474342 from the archive and publish them here in agreement with P. Jakobsen. In the course of their survey FORS1 spectra of 10 candidates were taken with the 300V grism crossed with the GG435 order separation filter and a 1″ slit, calibrated against the standards LTT 7987 and GD 50. Seven of their candidates are actually quasars, of which 3 were also found independently by our survey. The remaining 4 quasars are beyond our redshift-dependent magnitude limit. The FORS1 spectra of the 4 additional quasars are displayed in Fig. 1 and listed separately in Table 1. According to the quasar catalogue by Véron-Cetty & Véron (2006) there are no other previously known quasars within a radius around HE 23474342.
| Object | (J2000) | (J2000) | Magnitude | Night | Grism | Exposure | Airmass | Seeing | Abbr. | |
| QSO~J23510$-$4336 | 19 Nov 2004 | 300V | 1200 s | 13 | ||||||
| QSO~J23507$-$4319 | 17 Nov 2004 | 600B | 360 s | 07 | ||||||
| QSO~J23507$-$4326 | 17 Nov 2004 | 300V | 200 s | 10 | ||||||
| QSO~J23509$-$4330 | 17 Nov 2004 | 600B | 300 s | 07 | ||||||
| QSO~J23502$-$4334 | 17 Nov 2004 | 300V | 60 s | 07 | ||||||
| QSO~J23503$-$4328 | 17 Nov 2004 | 300V | 400 s | 07 | A | |||||
| QSO~J23495$-$4338 | 19 Nov 2004 | 300V | 360 s | 12 | C | |||||
| QSO~J23511$-$4319 | 17 Nov 2004 | 600B | 1000 s | 11 | ||||||
| QSO~J23514$-$4339 | 17 Nov 2004 | 300V | 1400 s | 12 | ||||||
| QSO~J23503$-$4317 | 19 Nov 2004 | 300V | 1800 s | 12 | ||||||
| 600B | 1800 s | 12 | ||||||||
| QSO~J23515$-$4324 | 06 Oct 2002 | 300V | 900 s | 07 | ||||||
| QSO~J23512$-$4332 | 06 Oct 2002 | 300V | 900 s | 07 | ||||||
| QSO~J23508$-$4335 | 06 Oct 2002 | 300V | 900 s | 09 | ||||||
| QSO~J23500$-$4319 | 06 Oct 2002 | 300V | 900 s | 08 | B |
2.4 Redshifts and magnitudes
| Object | Emission line | [Å] | |
|---|---|---|---|
| QSO J235034328 | Ly | ||
| N v | |||
| Si iv+O iv] | |||
| C iv | |||
| C iii] | |||
| Mg ii | |||
| QSO J235004319 | Si iv+O iv] | ||
| C iv | |||
| C iii] | |||
| QSO J234954338 | Ly | ||
| O i+Si ii | |||
| C ii | |||
| Si iv+O iv] | |||
| C iv | |||
| C iii] | |||
Redshifts of the 14 quasars were determined by taking every detectable emission line into account. Line peaks were measured by eye and errors were estimated taking into account the of the lines, line asymmetries and the presence of absorption systems. The quasar redshifts were derived by weighting the measurements of detected lines. Since high-ionisation lines suffer from systematic blueshifts with respect to the systemic redshift (Gaskell 1982; Tytler & Fan 1992; McIntosh et al. 1999), a higher weight was given to low-ionisation lines. Obviously blueshifted lines were discarded. Redshift errors were estimated from the redshift differences of the remaining lines and their estimated errors.
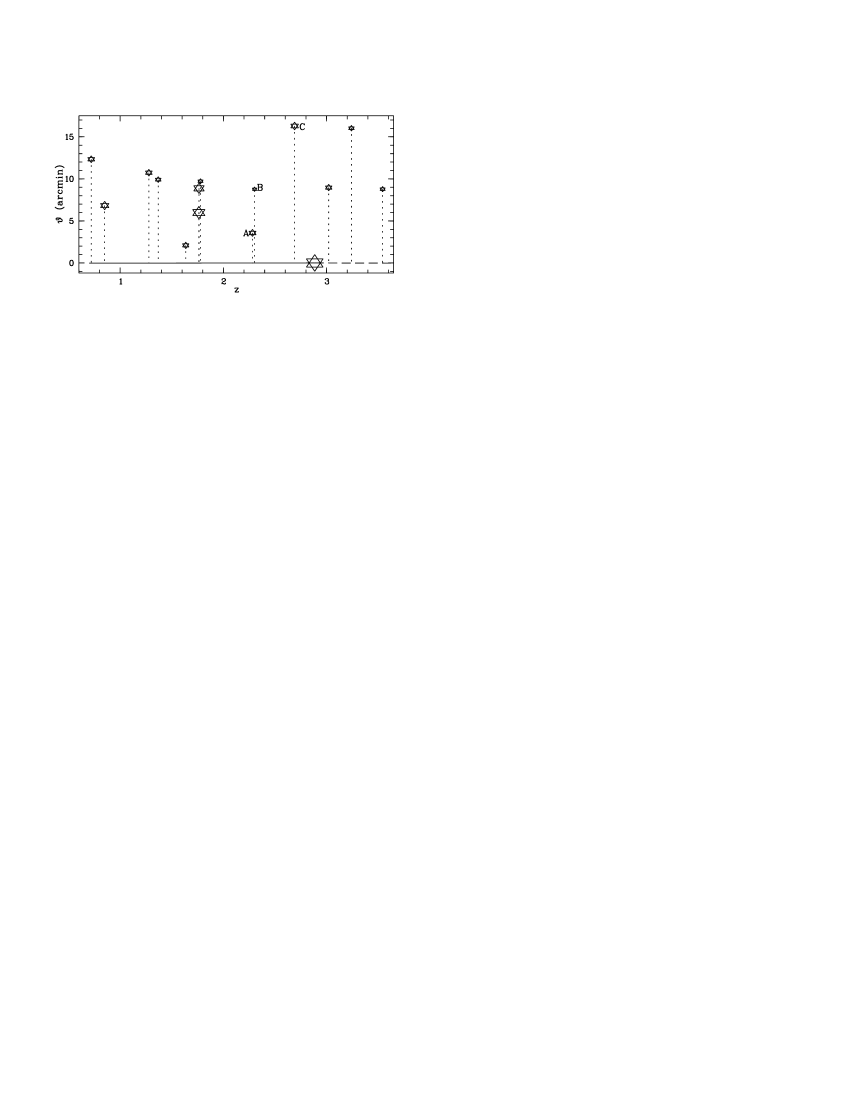
The 14 discovered quasars lie in the broad redshift range . Fig. 2 shows their angular separations with respect to HE 23474342. We find three background quasars to HE 23474342 and we identify a pair of bright quasars at separated by . Three foreground quasars (labelled A–C in Table 1 and Fig. 2) are located in the redshift range to study the transverse proximity effect. Table 2 provides the redshift measurements for the detected emission lines in their spectra. The redshift of QSO J235034328 was based on Ly and C iv. The measurement of the Mg ii is uncertain because of the decline of the resolving power of the 300V grism towards the red, but yields a slightly higher redshift than the adopted one. For QSO J235004319 we measured a consistent redshift from the C iv and the C iii] line. The redshift measurement of QSO J234954338 was difficult due to several metal absorption line systems of which only two Mg ii systems at and could be identified. In particular, Fe ii absorption from the system hampered a redshift measurement of the Ly line. The C iv and the C iii] lines show unidentified absorption features. Thus, the redshift of QSO J234954338 is heavily weighted towards the very noisy low-ionisation lines O i+Si ii and C ii. However, redshift uncertainties of the foreground quasars do not significantly affect our results.
Apparent magnitudes were derived from target aquisition images photometrically calibrated against the standard star fields PG 2213006 or Mark A (Landolt 1992). Unfortunately the aquisition exposures of the faintest quasars were too short to determine their magnitudes accurately. Magnitudes derived from integration of the spectra are consistent with the photometric ones after correcting for slit losses.
We note that QSO J235074326 is variable. This quasar has been detected in both slitless surveys and had in October 2001, in October 2002 and in November 2004. We were able to discover this quasar in its bright phase while missing the slightly fainter quasar QSO J235154324 detected only in the survey by P. Jakobsen.
2.5 Optical spectra of HE 23474342
From the ESO Science Archive we retrieved the optical spectra of HE 23474342 taken with UVES at VLT UT2/Kueyen in the Large Programme “The Cosmic Evolution of the Intergalactic Medium” (Bergeron et al. 2004). Data reduction was performed using the UVES pipeline provided by ESO (Ballester et al. 2000). The vacuum-barycentric corrected co-added spectra yield a in the Ly forest at . The spectrum was normalised in the covered wavelength range using a cubic spline interpolation algorithm.
2.6 Far-UV spectra of HE 23474342
HE 23474342 is one of the two high-redshift quasars observed successfully in the He ii Ly forest below Å rest frame wavelength with the Far Ultraviolet Spectroscopic Explorer (FUSE) at a resolution of , although at a (Kriss et al. 2001; Zheng et al. 2004). G. Kriss and W. Zheng kindly provided the reduced FUSE spectrum of HE 23474342 described in Zheng et al. (2004). We adopted their flux normalisation with a power law reddened by the Cardelli et al. (1989) extinction curve assuming (Schlegel et al. 1998).
3 The Ly forest near the foreground quasars
Aiming to detect the transverse proximity effect as an underdensity (’void’) in the Ly forest towards HE 23474342 we examined the forest regions in the projected vicinity of the three foreground quasars labelled A–C in Table 1. The H i forest of HE 23474342 has been analysed in several studies, e.g. by Zheng et al. (2004) and Fechner & Reimers (2007a), hereafter called Z04 and FR07, respectively. Since the line list from FR07 is limited to , T.-S. Kim (priv. comm.) kindly provided an independent line list including the lower redshift Ly forest (). Both line lists agree very well in their overlapping redshift range .
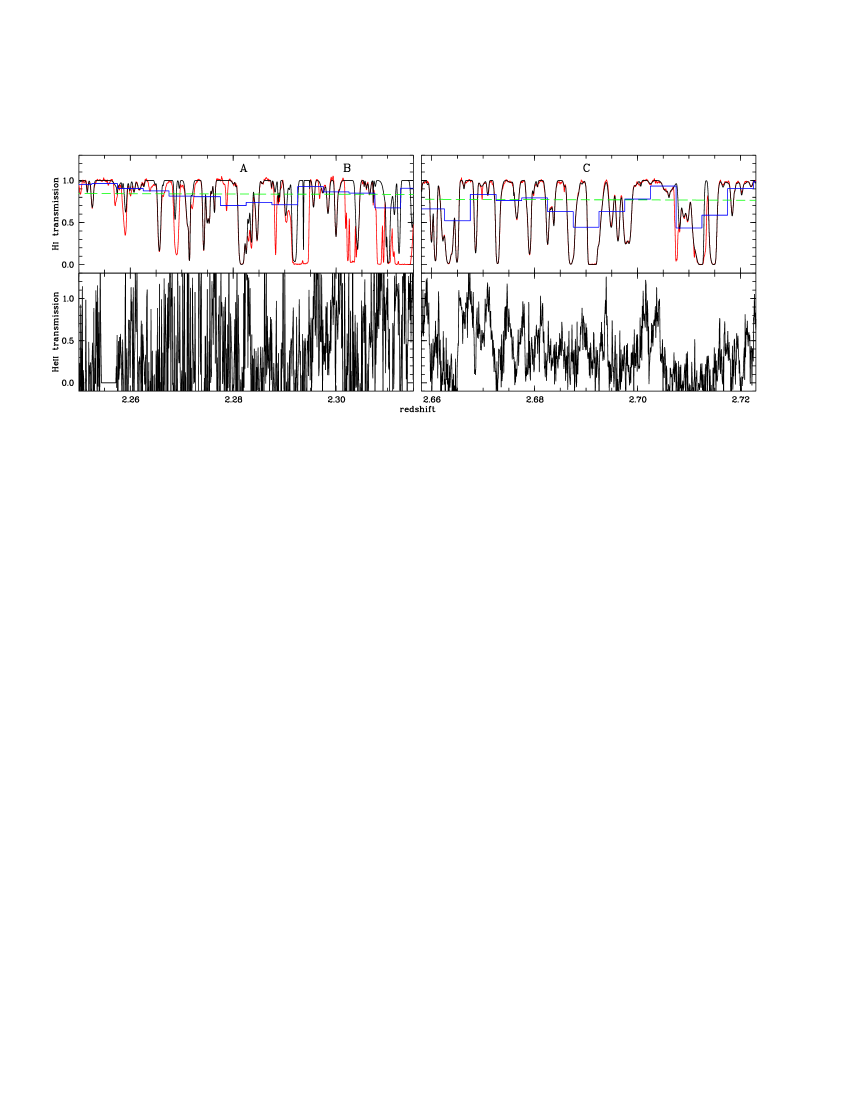
Figure 3 displays the H i and the He ii forest regions near the foreground quasars A–C. The H i Ly forest is contaminated by metals. In particular at there is severe contamination due to the O vi absorption of the associated system of HE 23474342 (Fechner et al. 2004). Because the strong O vi absorption overlaps with the projected positions of QSO A and QSO B it is very difficult to obtain a well-determined H i line sample in this region. Furthermore, there is Ly absorption of H i and He ii at . We also overplot in Fig. 3 the mean H i Ly transmission in bins obtained from T.-S. Kim’s line list and the generally expected mean transmission over several lines of sight with (Kim et al. 2002).
We do not detect a significant void near the three foreground quasars, neither in the H i forest nor in the He ii forest. In the vicinity of QSO A and QSO B, even a careful decontamination of the optical spectrum does not reveal a significant H i underdensity. Instead, the transmission is fluctuating around the mean. Due to the poor quality of the FUSE data in this region () and the He ii Ly absorption from higher redshifts, a simple search for He ii voids near QSO A and QSO B is impossible. In the vicinity of QSO C the H i Ly absorption is slightly higher than on average. There is a small void at that can be identified in the forests of both species. The probability of chance occurrence of such small underdensities is high, so linking this void to QSO C seems unjustified. However, note that the He ii absorption in the vicinity of QSO C () is lower than at in spite of the same H i absorption. This points to fluctuations in the spectral shape of the ionising radiation near the quasar (Sect. 4.3).
Given the luminosities and distances of our foreground quasars to the sightline of HE 23474342, could we expect to detect the transverse proximity effect as voids in the H i forest? As in Paper I, we modelled the impact of the foreground quasars on the line of sight towards HE 23474342 with the parameter
| (1) |
which is the ratio between the summed photoionisation rates of quasars at redshifts with rest frame Lyman limit fluxes , penetrating the absorber at redshift and the overall UV background with Lyman limit intensity . is the luminosity distance of QSO , and is its luminosity distance as seen at the absorber; the redshift of the quasar as seen at the absorber is (Liske 2000). A value predicts a highly significant proximity effect.
We assumed a constant UV background at 1 ryd of erg cm-2 s-1 Hz-1 sr-1 (Scott et al. 2000) with a power-law shape and . The quasar Lyman limit fluxes were estimated from the spectra by fitting a power law to the quasar continuum redward of the Ly emission line, excluding the emission lines. The spectra were scaled to yield the measured photometric magnitudes. Table 3 lists the resulting spectral indices, the H i Lyman limit fluxes, and the transverse distances.
The combined effects of QSOs A and B result in a peak , while QSO C yields . So we expect only a weak signature of the transverse proximity effect that can be easily diluted by small-scale transmission fluctuations around . Thus, the apparent lack of a transverse proximity effect in the H i forest is no surprise.
We can also roughly estimate the amplitude of the proximity effect in the He ii forest. Extrapolating the power laws (QSOs and background) above 4 ryd at (Haardt & Madau 1996, hereafter HM96) we get near QSO A and near QSO C. A softer background would result in higher values of , whereas absorption of ionising photons in the He ii forest would decrease . However, due to the arising He ii Ly forest and the low in the FUSE data near QSOs A and B, even high values do not necessarily result in a visible He ii void. In the direct vicinity of QSO C the He ii data is not saturated, but shows no clear void structure either. We will show in the following sections that the spectral shape of the radiation field is a more sensitive indicator of the transverse proximity effect than the detection of voids in the forests.
| QSO | Abbr. | [Jy] | [Mpc] | ||
|---|---|---|---|---|---|
| QSO J235034328 | A | ||||
| QSO J235004319 | B | ||||
| QSO J234954338 | C |
4 The fluctuating shape of the UV radiation field towards HE 23474342
4.1 Diagnostics
If both hydrogen and helium are highly ionised in the IGM with roughly primordial abundances, the column density ratio indicates the softness of the UV radiation field impinging on the absorbers. Theoretically, can be derived numerically via photoionisation models of the IGM with an adopted population of ionising sources. At the redshifts of interest, is predicted for a UV background generated by quasars (HM96; Fardal et al. 1998), whereas higher values indicate a contribution of star-forming galaxies (e.g. Haardt & Madau 2001, hereafter HM01).
The He ii forest has been resolved with FUSE towards HE 23474342 and HS 17006416, allowing a direct estimation of by fitting the absorption lines (Kriss et al. 2001; Zheng et al. 2004; Fechner et al. 2006, FR07). Due to the low and the strong line blending in the He ii forest the He ii lines have to be fitted with absorber redshifts and Doppler parameters fixed from the fitting of the H i data of much higher quality. Generally, pure non-thermal line broadening () is assumed (however, see FR07 and Sect. 6 below). The He ii forest towards HE 23474342 was fitted independently by Z04 and FR07. In the following, we rely on the line fitting results from FR07, which at any rate are consistent with those obtained by Z04 in the redshift ranges near the quasars.
All current studies indicate that is strongly fluctuating on very small scales in the range . The median column density ratio towards HE 23474342 is (Z04), whereas Fechner et al. (2006) find a higher value of towards HS 17006416. Both studies find evidence for an evolution of towards smaller values at lower redshifts. However, only part of the scatter in is due to redshift evolution and statistical errors, so the spectral shape of the UV radiation field has to fluctuate (FR07). Although the analyses of both available lines of sight give consistent results, cosmic variance may bias the derived median and its evolution. This is of particular interest for our study, since we want to reveal local excesses of low near the quasars with respect to the median (Sect. 4.3). Clearly, more lines of sight with He ii absorption would be required to yield tighter constraints on the redshift evolution of .
The detailed results of visual line fitting may be subjective and may depend on the used fitting software. In particular, ambiguities in the decomposition of blended H i lines can affect the derived values (Fechner & Reimers 2007b). Therefore we also analyse the UV spectral shape variations using the ratio of the effective optical depths
| (2) |
As introduced in Paper I, this parameter is a resolution-independent estimator of the spectral shape of the UV radiation field with small (high) values indicating hard (soft) radiation on a certain redshift scale . Shull et al. (2004) followed a similar approach by taking for a restricted range on scales of and . However, this scaling relation between and is only valid at the centre of an absorption line (Miralda-Escudé 1993). The column density ratio is defined per absorption line and not as a continuous quantity, whereas can be defined on any scale. While and are correlated (see below), there is no simple conversion between and and the correlation will depend on the adopted redshift scale of .
4.2 Fluctuations in and along the line of sight
We obtained by binning both normalised Ly forest spectra of H i and He ii into aligned redshift bins of in the range and computed with the mean transmission and . The choice of the redshift binning scale was motivated by the typical scale of fluctuations (Kriss et al. 2001, FR07). We adopted the binning procedure by Telfer et al. (2002) in order to deal with original flux bins that only partly overlap with the new bins. The errors were computed accordingly. Due to the high absorption and the low of the He ii data we occasionally encountered unphysical values . These were replaced by their errors, yielding lower limits on . We mostly neglected the usually small metal contamination in the computation of in the Ly forest because the errors in are dominated by the low and the more uncertain continuum level of the He ii spectrum. The FUSE data in the redshift bins at , , , , and are contaminated by galactic absorption, so no measurement on the full scale of can be performed there.
At the H i Ly forest is severely contaminated by O vi from the associated system of HE 23474342 (Fechner et al. 2004). Furthermore, the Ly forest of both species emerges at . Because this excess absorption would bias the direct estimation of in the spectra, we tried to decontaminate the forests at . was computed from the H i Ly forest reconstructed from the line list by T.-S. Kim (Sect. 3). The corresponding was obtained after dividing the FUSE data by the simulated Ly absorption of the lines at higher redshift. Since the decontamination depends on the validity of the He ii line parameters as well as on the completeness of the H i line list in the complex region contaminated by O vi, the derived values at have to be regarded as rough estimates.
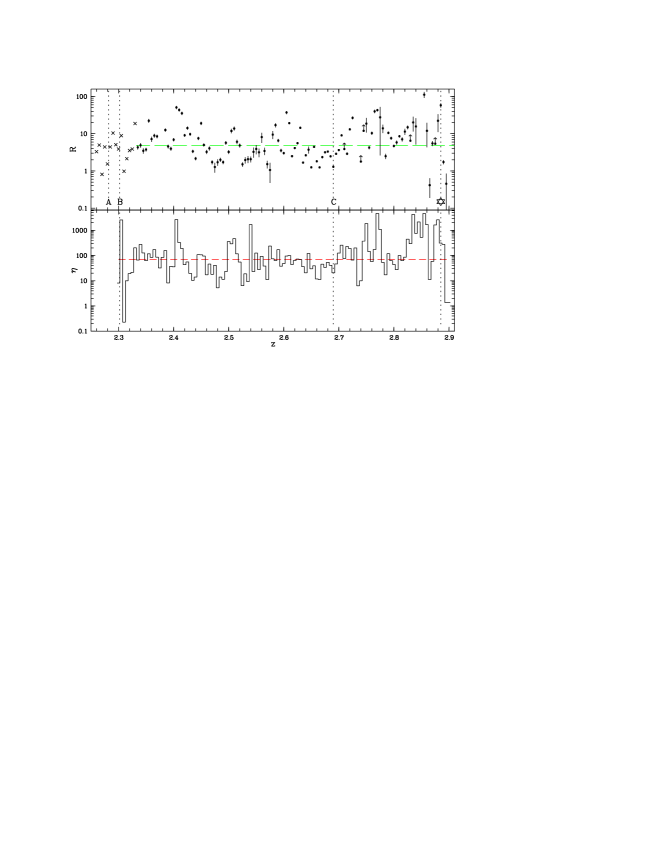
The resulting is shown in the upper panel of Fig. 4. The optical depth ratio strongly fluctuates around its median value obtained for uncontaminated redshift bins, indicating spectral fluctuations in the UV radiation field. We also show in Fig. 4 the median on the same redshift bins based on the line fitting results in FR07. Also the median strongly fluctuates with a slight trend of an increase with redshift (Z04). Clearly, the data is inconsistent with a spatially uniform UV background, but the median of the line sample is consistent with quasar-dominated models of the UV background. A comparison of and reveals that both quantities are correlated. The Spearman rank order correlation coefficient is with a probability of no correlation .
There is a scatter in the relation between and , which is due to noise in the He ii data and due to the fact that is a spectral softness indicator that is smoothed in redshift. Therefore, in addition to the UV spectral shape, will depend on the density fluctuations of the Ly forest on the adopted scale. In order to estimate the scatter in due to these density fluctuations, we simulated H i and He ii Ly forest spectra. We generated 100 H i forests with the same overall redshift evolution of (Kim et al. 2002) based on the empirical line distribution functions in redshift , column density and Doppler parameter (e.g. Kim et al. 2001). We modelled each forest as a composition of lines with Voigt profiles using the approximation by Tepper-García (2006). The spectral resolution () and quality () closely matches the optical data of HE 23474342. The corresponding He ii forests were generated at FUSE resolution with a for four constant values of and 100. We assumed pure non-thermal broadening of the lines. Then we computed at on our adopted scale , yielding 20000 measurements for each considered . For convenience we took out the general redshift dependence of via dividing by the expected effective optical depth , so
| (3) |
is a measure of H i overdensity () or underdensity ().
In Fig. 5 we show the relation obtained from the Monte Carlo simulations and compare it to the distribution observed towards HE 23474342. The simulated can be fitted reasonably with a 3rd order polynomial in logarithmic space, yielding a general decrease of with for every . The root-mean-square scatter increases from dex for to dex for . At the distribution flattens due to saturation of high-column density absorbers on the flat part of the curve of growth. The flattening causes substantial overlap between the simulated distributions at , making increasingly insensitive to the underlying . However, at hard radiation and soft radiation can be reasonably well distinguished. We also overplot the measured towards HE 23474342 in Fig. 5. The observed distribution is inconsistent with a constant , but the majority of values falls into the modelled range. While many high values indicate , values with correspond to at . Thus, the very low values always indicate a hard radiation field up to moderate overdensities. As we will see in the next section, the saturation effect probably does not play a role in relating a hard radiation field to the nearby quasars.
4.3 The UV radiation field near the quasars
We now investigate in greater detail the spectral shape of the UV radiation field near the four quasars with available data on and : the background quasar HE 23474342 and the foreground QSOs A–C. Due to the small number of comparison values derived from only two lines of sight, we will adopt as a characteristic value for the overall UV background at (HE 23474342, QSO C) and a value of at (QSOs A and B). The former value is close to the median obtained by Fechner et al. (2006) at towards HS 17006416, whereas the latter value accounts for the probable evolution of with redshift. Furthermore, we will compare the values in the vicinity of the quasars to models of the UV background.
4.3.1 HE 23474342
A close inspection of Fig. 4 reveals a strongly fluctuating radiation field near HE 23474342 with some very small, but also high values. Also the column density ratio shows large fluctuations () with six absorbers out of the 20 absorbers at . These strong variations of the spectral shape are likely due to radiative transfer effects in the associated absorption system causing an apparent lack of the proximity effect of HE 23474342 (Reimers et al. 1997). The high He ii column densities of the associated system may soften the quasar radiation with increasing distance and Fig. 4 supports this interpretation. Due to the probable strong softening of the hard quasar radiation on small scales, the relative spectral hardness near HE 23474342 is only revealed by individual low values instead of robust median values. However, also the highly ionised metal species of the associated system (Fechner et al. 2004) favour the presence of hard QSO radiation. Thus we conclude that despite the lack of a radiation-induced void near HE 23474342, its impact onto the IGM can be detected via the relative spectral hardness of the UV radiation field. The three values near HE 23474342 have , so they are probably not affected by saturation.
4.3.2 QSOs A and B
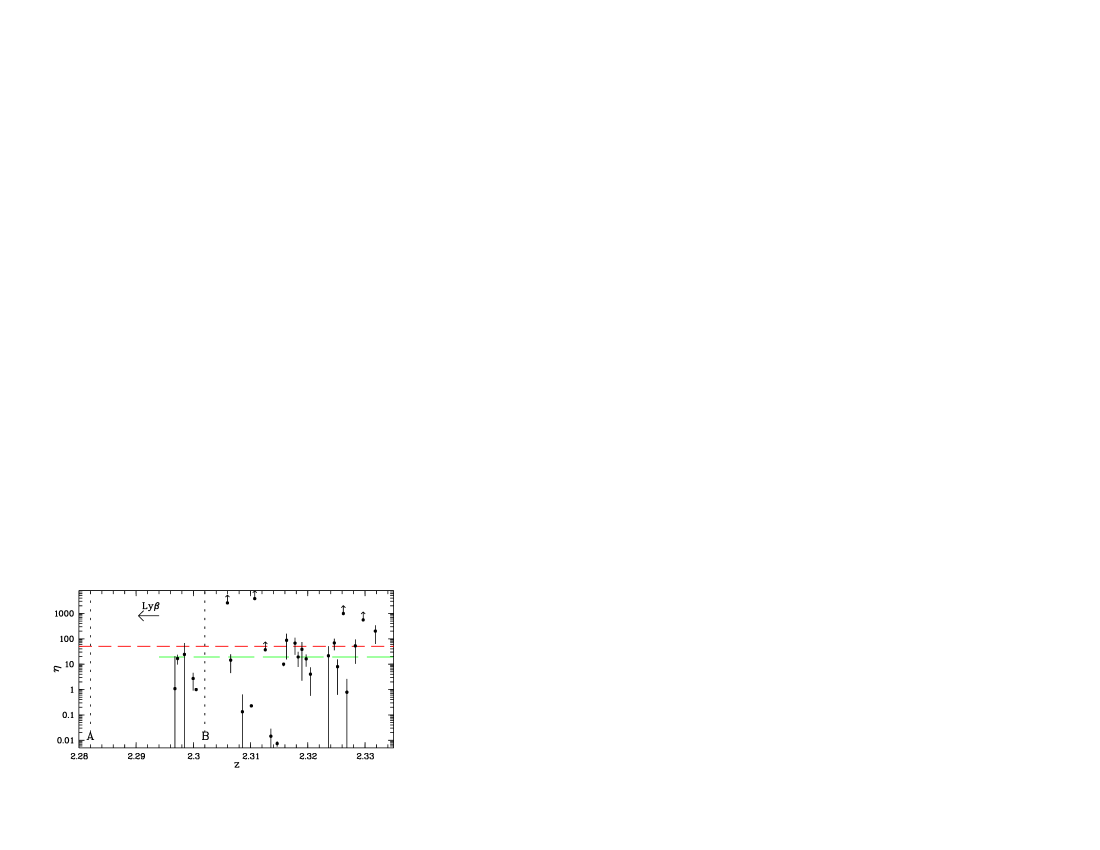
If our decontamination of the Ly forests near the two QSOs A and B is correct, should reflect UV spectral shape variations also in that region. Indeed, the redshift bin at next to QSO A () is a local minimum with . At we find . At the redshift of QSO B () the radiation field is quite soft, but we note a low at . We obtain for the four values near QSO A and QSO B, so saturation is not relevant, and the low values correspond to low values.
The measured values in this redshift region are presented in Fig. 6. The error bars are only indicative, since blended line components are not independent and the He ii column densities are derived with constraints from the H i forest. Lower limits on result from features detected in He ii but not in H i. Due to ambiguities in the line profile decomposition at the H i detection limit and the present low quality of the He ii data it is hard to judge the reality of most of these added components (Fechner & Reimers 2007b). Nevertheless, since for adjacent lines may be not independent due to line blending, we must include the lower limits in the analysis. At the fitting of He ii lines becomes unreliable due to the arising Ly forest. Therefore, no direct estimates of can be obtained in the immediate vicinity of QSO A. Furthermore, the H i line sample may be incomplete or the line parameters may be not well constrained due to blending with the O vi of the associated system of HE 23474342.
Considering these caveats, the median obtained for the values at shown in Fig. 6 is only an estimate. Nevertheless, this is much lower than the typical values found at towards HS 17006416 (Fechner et al. 2006). Moreover, it is also lower than at slightly higher redshifts towards HE 23474342. For instance, the median increases to in the redshift range . This is inconsistent with the smooth redshift evolution of on large scales inferred by Z04 and Fechner et al. (2006) for both available sightlines. Thus, we infer an excess of hard radiation in the vicinity of QSO A and QSO B. The most extreme values are located in the projected vicinity of QSO B, with 6 lines reaching . If estimated correctly, these low values require local hard sources and cannot be generated by the diffuse UV background. Both foreground quasars could be responsible for the hard radiation field because of similar light travel times to the probably affected absorbers ().
4.3.3 QSO C
Since metal contamination of the H i forest is small in the projected vicinity of QSO C (Fig. 3), the UV spectral shape is better constrained here than near QSO A and QSO B. From Fig. 4 we note a local minimum () that exactly coincides with the redshift of QSO C (). At higher redshifts rises, possibly indicating a softer ionising field. However, at the optical depth ratio is continuously below the median with in five redshift bins. Due to the H i overdensities near QSO C, all values have , but only the bin at has , so the remaining ones may still indicate low column density ratios .
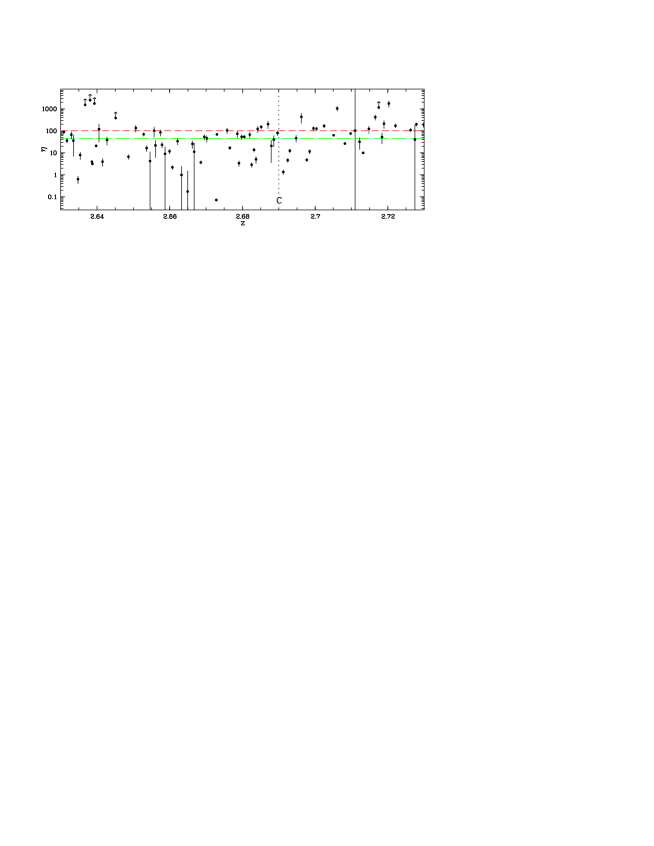
Figure 7 displays the values from FR07 in the redshift range in the projected vicinity of QSO C. For comparison, we also indicate that is consistent with the median towards HS 17006416 in this redshift range (Fechner et al. 2006). While the data generally shows strong fluctuations around the median over the whole covered redshift range (Z04; Fechner et al. 2006), there is an apparent excess of small values near QSO C indicating a predominantly hard radiation field. From the data, a median is obtained at including the lower limits on . The median near QSO C is lower than the median towards HS 17006416 by a factor of two and also slightly lower than the obtained for spatially uniform UV backgrounds generated by quasars. The relative agreement of the median near QSO C and hard versions of quasar UV background models may result from the softening of the quasar radiation by the IGM at the large proper distances Mpc considered here (Table 3). This will be further explored in Sect. 6.2. The larger contrast between the median near QSO C and the median towards HS 17006416 yields stronger evidence for a local hardening of the UV radiation near QSO C. However, this comparison value derived from the single additional line of sight tracing this redshift range may be biased itself.
Near QSO C the column density ratio still fluctuates and is not homogeneously low as naively expected. We also note an apparent offset of the low region near QSO C towards lower redshift due to fewer absorbers with low at . While some of the fluctuations can be explained by uncertainties to recover reliably from the present data, the very low values (% of the data in Fig. 7) are likely intrinsically low. These values are in conflict with a homogeneous diffuse UV background, and are likely affected by a local hard source. In Sect. 6.4 we will estimate the error budget of by Monte Carlo simulations.
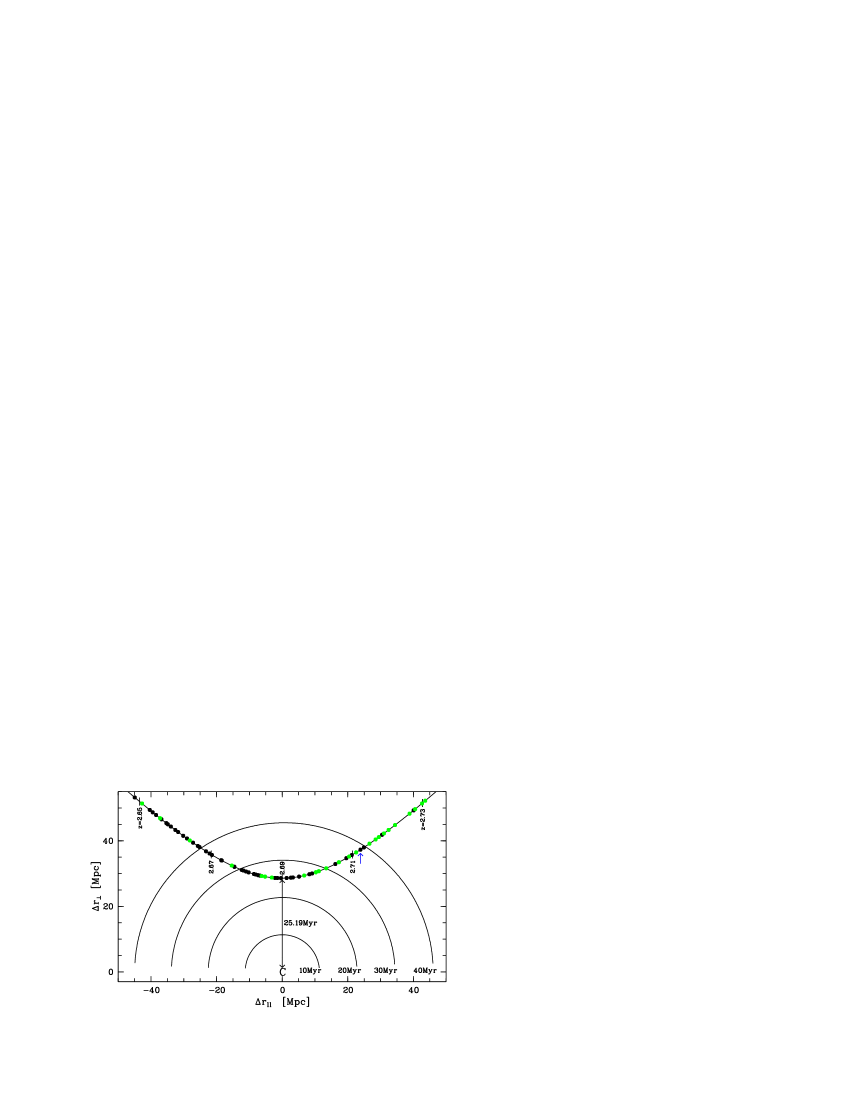
If QSO C creates a fluctuation in the spectral shape of the UV background, the distance between the quasar and the line of sight implies a light travel time of Myr. The low (high) redshift end of the region shown in Fig. 7 corresponds to a light travel time of Myr ( Myr). Since these light travel times are comparable, we argue that it is important to consider not only the immediate projected vicinity of QSO C to be affected by the proximity effect (see also Fig. 10 below).
In summary, both spectral shape indicators and indicate a predominantly hard UV radiation field near all four known quasars in this field. Many values in the projected vicinity of the quasars indicate a harder radiation than expected even for model UV backgrounds of quasars alone. This points to a transverse proximity effect detectable via the relative spectral hardness. However, there are other locations along the line of sight with an inferred hard radiation field, but without an associated quasar, most notably the regions at and (Fig. 4). Before discussing these in detail (Sect. 6.3), we search for additional evidence for hard radiation near the foreground quasars by analysing nearby metal line systems.
5 Constraints from metal line systems
Observed metal line systems provide an additional tool to constrain the spectral shape of the ionising radiation. Since photoionisation modelling depends on several free parameters, appropriate systems should preferably show many different ionic species. Fechner et al. (2004) analysed the associated metal line system of HE 23474342 and found evidence for a hard quasar spectral energy distribution at the absorbers with highest velocities that are probably closest to the quasar. Their large He ii column densities probably shield the other absorbers which are better modelled with a softer radiation field. The results by Fechner et al. (2004) are consistent with the more direct hardness estimators and near HE 23474342 (Sect. 4.3.1).
In the spectrum of HE 23474342 an intervening metal line system is detected at which is close to the redshift of QSO C () at a proper distance of Mpc. At there is another system showing multiple components of C iv and N v as well as only weak H i absorption (). The presence of N v and weak H i features with associated metal absorption are characteristic of intrinsic absorption systems exposed to hard radiation. Due to the small proper distance to QSO A ( Mpc) this system is probably illuminated by the radiation of the close-by quasar. A third suitable metal line system at is closer to QSO B ( Mpc) than to QSO A ( Mpc). But since QSO A is much brighter than QSO B (Table 3), the metal line system at might be affected by both quasars. Due to their small relative velocities with respect to the quasars of the systems are likely associated to the quasars (e.g. Weymann et al. 1981).
In order to construct CLOUDY models (Ferland et al. 1998, version 05.07) we assumed a single-phase medium, i.e. all observed ions arise from the same gas phase, as well as a solar abundance pattern (Asplund et al. 2005) at a constant metallicity throughout the system. Furthermore, we assumed pure photoionisation and neglected a possible contribution of collisional ionisation. The absorbers were modelled as distinct, plane-parallel slabs of constant density testing different ionising spectra.
5.1 The system at near QSO A
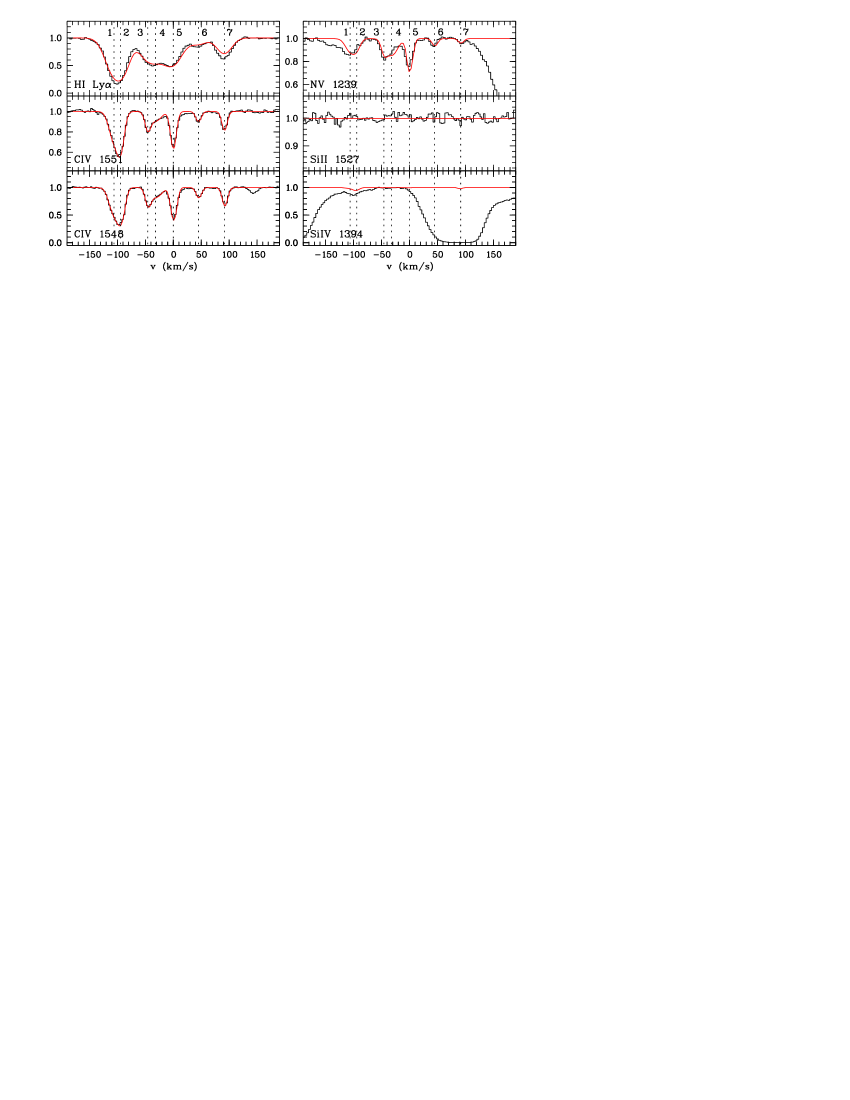
The system at shows seven components of C iv and N v along with unsaturated features of H i (Fig. 8). The absorber densities are constrained by the C iv/N v ratio. For the HM01 background scaled to yield at the H i Lyman limit (Scott et al. 2000), we derive densities in the range to at a metallicity of solar. The estimated absorber sizes are or even smaller, where the sizes are computed according to with the absorbing path length . With an additional contribution by QSO A, modelled as a power law with and H i Lyman limit intensity at the location of the absorber, we obtain an even higher metallicity of times solar. Densities in the range to are found leading to very small absorbers of .
Both models lead to unusually high metallicities and very small absorber sizes. However, Schaye et al. (2007) recently reported on a large population of compact high-metallicity absorbers. Using the HM01 background they found typical sizes of and densities of for absorbers with nearly solar or even super-solar metallicities. In fact, this system is part of the sample by Schaye et al. (2007).
Since the system exhibits only a few different species, it is impossible to discriminate between the soft and the hard radiation model. In principle, both models lead to a consistent description of the observed metal lines. The soft HM01 UV background yields for the modelled absorbers, whereas the model including the hard radiation of QSO A leads to . Recall that the He ii forest cannot be used to measure directly due to blending with Ly features and very low .
5.2 The systems near QSO B and QSO C
The systems at and are located near QSO B and QSO C, respectively. Only few ions are observed and some of them may even be blended. Therefore, no significant conclusions based on CLOUDY models can be drawn. Using the column density estimates we find that the system at close to QSO C exhibiting C iv and O vi can be described consistently with a HM01+QSO background. Models assuming a quasar flux of seen by the absorber yield , consistent with the direct measurements from the He ii forest. However, the metal transitions alone do not provide strong constraints.
The system at shows C iv in six components along with Si iv and Si iii. The Lyman series of this system suffers from severe blending preventing a reliable estimation of the H i column density. Therefore metallicities and absorber sizes cannot be estimated. Adopting our column density estimates we infer that this system can be reasonably modelled with or without a specific quasar contribution.
6 Discussion
6.1 The transverse proximity effect in spectral hardness
Fourteen quasars have been found in the vicinity of HE 23474342 of which three are located in the usable part of the H i Ly forest towards HE 23474342. No H i underdensity is detected near these foreground quasars even when correcting for contamination by the O vi absorption from the associated system of HE 23474342. An estimate of the predicted effect confirms that even if existing, the classical proximity effect is probably too weak to be detected on this line of sight due to the high UV background at 1 ryd and small-scale variance in the H i transmission (Sect. 3).
However, the analysis of the spectral shape of the UV radiation field near the foreground quasars yields a markedly different result. The spectral shape is fluctuating, but it is predominantly hard near HE 23474342 and the known foreground quasars. Close to QSO C, both estimators and are consistent with a significantly harder radiation field than on average. There is a sharp minimum located precisely at the redshift of the quasar, but embedded in a broader region of low values statistically consistent with a hard radiation field of (Fig. 4). The column density ratio is also lower than on average and indicates a harder radiation field than obtained for quasar-dominated models of the UV background (Fig. 7). Because of line blending, only one of the three metal line systems detected near the foreground quasars can be used to estimate the shape of the ionising field. The metal line system at can be described reasonably by the HM01 background with or without a local ionising component by QSO A. The He ii forest does not provide independent constraints for this absorber. Line blending prevents an unambiguous detection of O vi at , leaving the shape of the ionising field poorly constrained without taking into account the He ii forest. Thus, the systems show highly ionised metal species, but our attempts to identify a local quasar radiation component towards them remain inconclusive.
The most probable sources for the hard radiation field at and towards HE 23474342 are the nearby foreground quasars. In particular, the absorbers with have to be located in the vicinity of an AGN, since the filtering of quasar radiation over large distances results in . Also star-forming galaxies close to the line of sight cannot yield the low values, since they are unable to produce significant numbers of photons at eV (Leitherer et al. 1999; Smith et al. 2002; Schaerer 2003). We conclude that there is evidence for a transverse proximity effect of QSO C detectable via the relative spectral hardness. There are also indications that QSO A and QSO B show the same effect, although contamination adds uncertainty to the spectral shape variations in their projected vicinity.
Given these incidences of a hard radiation field near the quasars, how do these results relate to those of Paper I, in which we investigated the line of sight towards Q 0302003? Both lines of sight show He ii absorption and on both lines of sight we find evidence for a predominantly hard radiation field near the quasars in the background and the foreground. However, the decrease of near quasars towards Q 0302003 appears to be much smoother than towards HE 23474342.
There are several reasons for the lack of small-scale spectral shape variations on the line of sight to Q 0302003. First, the low-resolution STIS spectrum of Q 0302003 does not resolve the He ii lines and limits the visible scale of fluctuations to (Paper I). Much smaller scales can be probed in the resolved He ii forest of HE 23474342, but the fitting of blended noisy He ii features may result in artifical variations. We will discuss the uncertainties of below (Sect. 6.4). Second, Q 0302003 () probes higher redshifts, where the He ii fraction in the IGM is significantly higher and the inferred radiation field is very soft ( in the Gunn-Peterson trough). Therefore, the impact of a hard source on the spectral shape is likely to be more pronounced than at lower redshifts after the end of He ii reionisation, where of the UV background gradually decreases.
6.2 The decrease of near QSO C
We now investigate quantitatively whether the foreground quasars are capable of creating a hardness fluctuation on the sightline towards HE 23474342. Unfortunately, since only one quasar is located in an uncontaminated region of the Ly forests, we can present sufficient evidence only for QSO C. For the other two quasars the data is too sparse and contamination adds uncertainty to the derived , but in principle QSO A should also show a strong effect, because its Lyman limit flux penetrating the line of sight is times higher than the one of QSO C.
Heap et al. (2000) and Smette et al. (2002) presented simple models of the decrease of in front of a quasar taking into account the absorption of ionising photons by the IGM. In a highly photoionised IGM with helium mass fraction and temperature K we have
| (4) |
where and are the photoionisation rate and the radiative recombination coefficient for species (Fardal et al. 1998). The photoionisation rate is with a contribution of the background and the quasar. The contribution of the quasar to the photoionisation rate of species at the th absorber in front of it () is
| (5) | |||||
with the photoionisation cross section at the Lyman limit , the observed Lyman limit flux and with the Lyman limit frequency . Extrapolating the power law continuum flux to the He ii Lyman limit yields . With the spectral index from Table 3 we obtain for QSO C.
We simulated for a set of 1000 Monte Carlo Ly forest spectra generated with the procedure discussed in Sect. 4.2. We assumed s-1 corresponding to the UV background from Sect. 3 and , which agrees with the median towards HS 17006416 in the redshift range under consideration (Fechner et al. 2006). The intervening absorbers successively block the quasar flux. Especially, every absorber with will truncate the quasar flux at ryd due to a He ii Lyman limit system, leading to an abrupt softening of the radiation field.
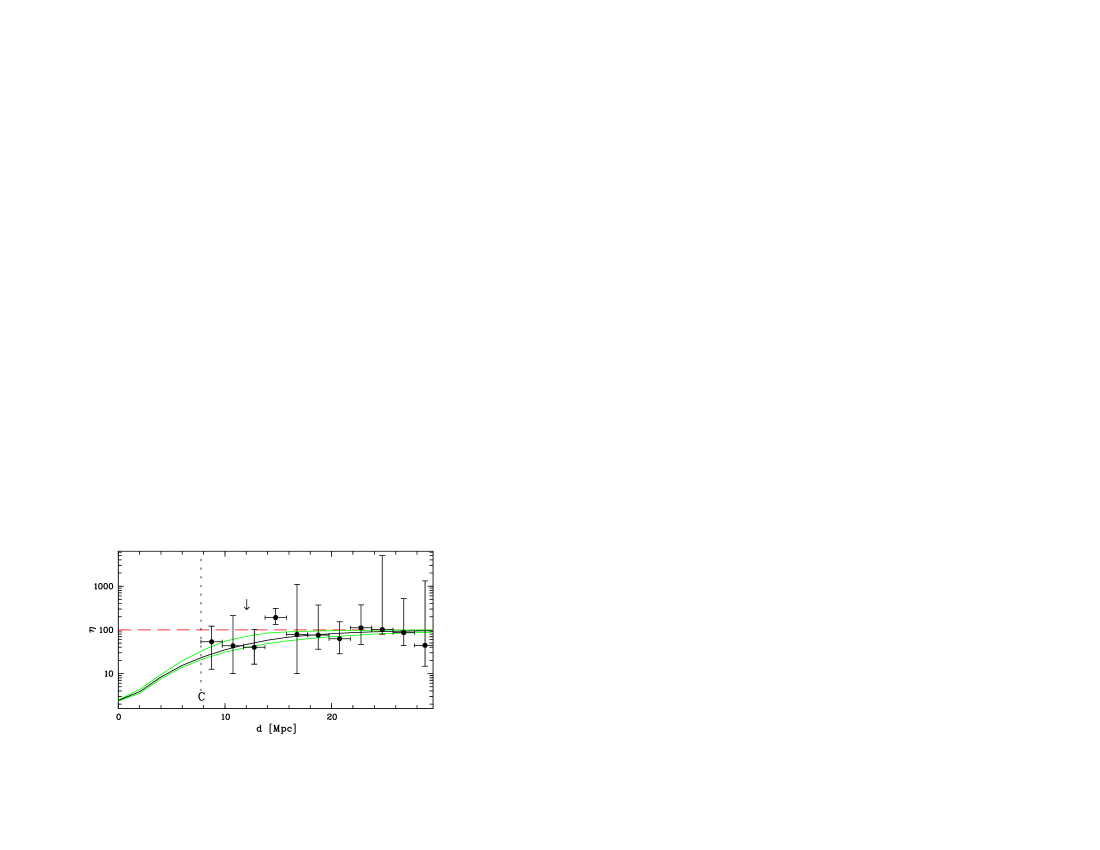
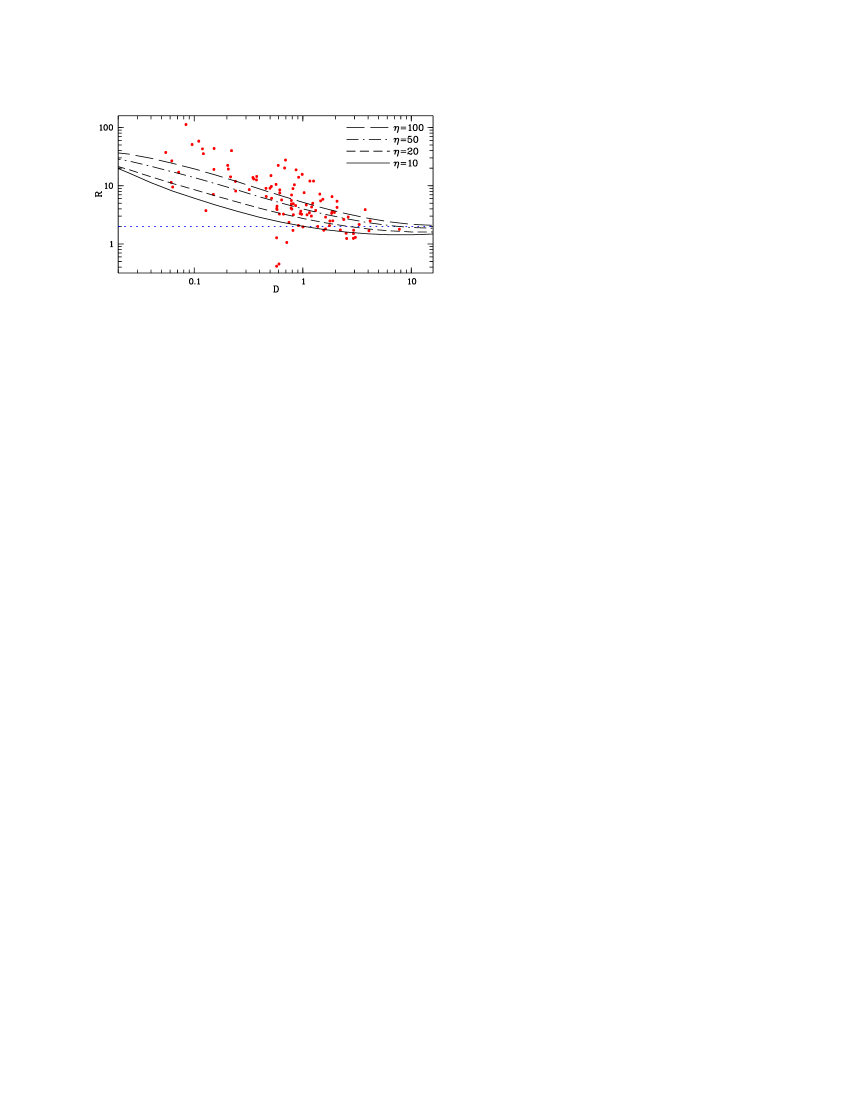
Figure 9 presents the simulated decrease of the median approaching QSO C assuming a constant quasar luminosity, isotropic radiation and an infinite quasar lifetime together with the upper and lower percentiles of the distribution obtained in bins of proper distance Mpc. The spread in the simulated is due to line-of-sight differences in the absorber properties. Since we consider the transverse proximity effect, we are limited to a proper distance Mpc (Table 3). The model agrees reasonably with the median of the data obtained in concentric rings around the quasar. As expected, individual values strongly deviate from this simple model due to the assumptions of the quasar properties (constant luminosity and spectral index, isotropic radiation) and due to the unknown real distribution of absorbers in transverse direction. Recently, Hennawi & Prochaska (2007) found evidence for excess small-scale clustering of high-column density systems in transverse direction to quasar sightlines. In Sect. 4.3.3 we found indications that the distribution around QSO C is not symmetric, which could be due to such anisotropic shielding. However, this does not imply an intrinsic anisotropy due to the unknown matter distribution around the quasar and the large uncertainties in individual values. Moreover, the line-of-sight variance at a constant is too small to explain the large observed spread of the values. Clearly, a self-consistent explanation of the small-scale fluctuations would require hydrodynamical simulations of cosmological radiative transfer in order to investigate possible shielding effects and the statistical distribution of values near quasars. While there is recent progress in case of the UV background (Sokasian et al. 2003; Croft 2004; Maselli & Ferrara 2005; Bolton et al. 2006), a proper treatment of three-dimensional radiative transfer in the IGM around a quasar is still in its infancy. However, our simplified approach suggests that QSO C is capable of changing the spectral shape of the UV radiation field by the right order of magnitude to explain the low values in its vicinity. Also a variation in the sizes and the centres of the bins chosen for Fig. 9 does not drastically change the indicated excess of low at Mpc. Figure 9 also shows very clearly that the sphere of influence for the transverse proximity effect is not limited to the immediate vicinity of the quasar.
Figure 10 shows a two-dimensional cut in comoving space near QSO C in the plane spanned by both lines of sight. The minimum separation of both lines of sight corresponds to a light travel time of Myr, but the lifetime of QSO C could be Myr due to the low values at larger distances. The fluctuations of the UV spectral shape could be explained by shadowing of the hard QSO radiation by unknown intervening structures between both lines of sight.
6.3 Other regions with an inferred hard UV radiation field
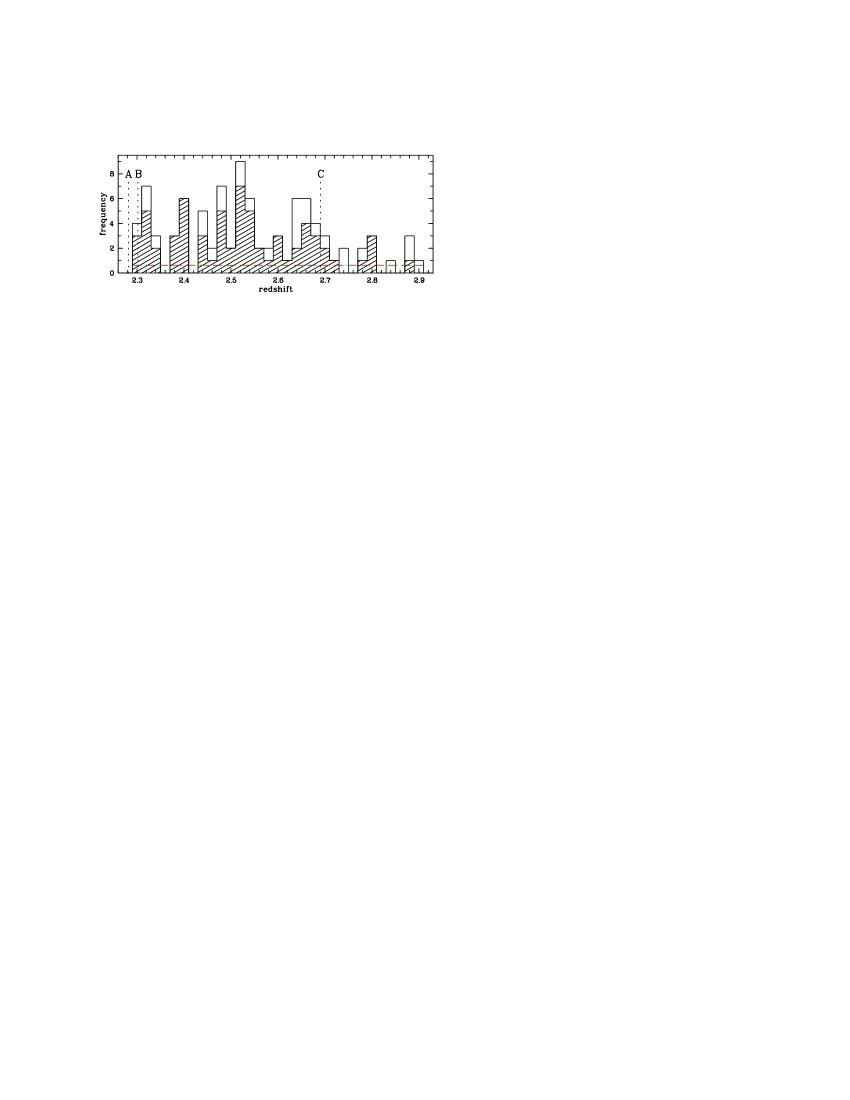
In Fig. 4 we note two additional regions at and where is prominently small and where there is no nearby quasar. Also the fitted shows very low values apparently unrelated to a known foreground quasar. Figure 11 displays the redshift distribution of the subsample. The low values are clustered with two peaks near the foreground quasars, but also at , and . At the first glance the existence of such regions seems to undermine the relation between the foreground quasars and a low in their vicinity. However, there are several plausible explanations for the remaining low values:
-
1.
Unknown quasars: We can conclude from Paper I that the quasars responsible for hardness fluctuations may be very faint (like Q~0302-D113 in Paper I) or may reside at large distances (Q~0301$-$005 in Paper I). QSO C is located near the edge of our survey area centred on HE 23474342, so other quasars capable of influencing the UV spectral shape might be located outside the field of view. Moreover, in order to sample the full quasar luminosity domain () at our survey is still too shallow by magnitude. Therefore, a larger and/or deeper survey around HE 23474342 is desirable.
-
2.
Quasar lifetime: Assuming that quasars are long-lived and radiate isotropically, every statistically significant low fluctuation should be due to a nearby quasar. On the other hand, short-lived quasars will not be correlated with a hard radiation field due to the light travel time from the quasar to the background line of sight. Quasar lifetimes are poorly constrained by observations to Myr (Martini 2004). This could be short enough to create relic light echoes from extinct quasars. The comoving space density of quasars with at is Mpc-3 (Wolf et al. 2003) resulting in an average proper separation of Mpc between two lines of sight. This translates into a light travel time of Myr which is of the same order as the quasar lifetime. So it is quite possible that some quasars have already turned off, but their hard radiation is still present.
-
3.
Obscured quasars: Anisotropic emission of type I quasars may lead to redshift offsets between regions with an inferred hard radiation field and quasars close to the line of sight. In the extreme case the putative quasar radiates in transverse direction, but is obscured on our line of sight (type II quasar). The space density of type II AGN at is very uncertain due to the challenging optical follow-up that limits the survey completeness (e.g. Barger et al. 2003; Szokoly et al. 2004; Krumpe et al. 2007). Thus, the fraction of obscured AGN at high redshift is highly debated (Akylas et al. 2006; Treister & Urry 2006), but may well equal that of type I AGN in the luminosity range of interest (Ueda et al. 2003).
We believe that a combination of the above effects is responsible for the loose correlation between low values and active quasars. In particular, at we infer a hard radiation field in a H i void (FR07), which may have been created by a luminous quasar that is unlikely to be missed by our survey ().
In Fig. 11 we also indicate the error level due to inaccurate line fitting and noise in the He ii data (dashed line) obtained from simulated data (see below). The low number of values scattered from a simulated to implies that the overdensities of such small values are statistically significant. Constraining the sample to lines with due to a possible bias caused by thermal broadening does not remove the significant clusters of lines with small .
6.4 Uncertainties in the spectral hardness
Our findings are likely to be affected by random errors and possibly also by systematic errors mostly related to the He ii data. The poor quality of the FUSE spectrum of HE 23474342 () contributes to the fluctuations in even if the value was constant (Fechner et al. 2006, see also below). The optical depth ratio should be less affected by noise, since it is an average over a broader redshift range . The low and the generally high absorption at provide uncertainty for the continuum determination in the He ii spectrum. The extrapolated reddened power law is certainly an approximation.
Although the fitting results from FR07 are broadly consistent with those of Z04 and agree well in the regions near the foreground quasars, there are substantial differences in some redshift ranges. This is probably due to the combined effects of low He ii data quality, different data analysis software and ambiguities in the deblending of lines. At present, cannot be reliably determined at individual absorbers unless metal transitions provide further constraints.
In order to assess the random scatter in due to the low He ii data and ambiguities in the line deblending of both species, we again used Monte Carlo simulations. Ten H i Ly forest spectra were generated in the range via the Monte Carlo procedure outlined in Sect. 4.2. The resolution and closely resembles the optical data of HE 23474342. We also generated the corresponding He ii forests at FUSE resolution and . We assumed pure non-thermal line broadening and . Voigt profiles were automatically fitted to the H i spectra using AUTOVP 111http://ursa.as.arizona.edu/~rad/autovp.tar (Davé et al. 1997). The He ii spectra were then automatically fitted with redshifts and non-thermal Doppler parameters fixed from the fitted H i line lists, yielding 7565 simulated values. On average the recovered is slightly higher than the simulated one (median ) with a large spread (), but only 285 lines have . Thus, we estimate a probability % that is scattered randomly from to if the assumption of non-thermal broadening is correct. Note that this probability is likely an upper limit due to the fact that only H i Ly was used to obtain the line parameters, which results in large error bars for saturated lines on the flat part of the curve of growth. In the real data, these errors were avoided by fitting unsaturated higher orders of the Lyman series wherever possible.
In the line sample by FR07, 94 out of the 526 absorbers have , whereas our simulation implies that only are expected to be randomly scattered to if was constant. Thus, the major part of the scatter of in the data is due to real fluctuations in the UV spectral shape. The majority of the low values is inconsistent with , so they indicate a hard radiation field in spite of the low in the He ii data. Yet, due to the large intrinsic scatter obtained from the simulations, individual values hardly trace the variations of the UV spectral shape. Local spatial averages should be more reliable (FR07). Since the transverse proximity effect zones always extend over some redshift range, this requirement is fulfilled and on average we reveal a harder radiation field than expected.
Concerning the high tail of the simulated distribution at , % of the lines are returned with . This may indicate that a fraction of the observed high values is still consistent with a substantially harder radiation field, underlining that single values poorly constrain the spectral shape.
Possibly, some values are systematically too low due to the assumption of non-thermal broadening () when fitting the He ii forest. FR07 found that this leads to underestimated values at cm-2 if the lines are in fact thermally broadened (). Non-thermal broadening is caused by turbulent gas motions or the differential Hubble flow, with the latter affecting in particular the low-column density forest. Thermal broadening becomes important in collapsed structures at high column densities. In simulations of the Ly forest, non-thermal broadening has been found to dominate (Zhang et al. 1995, 1998; Hernquist et al. 1996; Weinberg et al. 1997; Bolton et al. 2006; Liu et al. 2006). This has been confirmed observationally for the low-column density forest (Z04; Rauch et al. 2005). On the other hand, eight out of eleven absorbers with cm-2 in the vicinity of QSO C have (Fig. 7). Although the column density ratio of these absorbers could be underestimated due to an unknown contribution of thermal broadening, the statistical evidence for a hard radiation field is based on the vast majority of low-column density lines. The median obtained in this region does not increase significantly after excluding the suspected lines ( vs. ). This is still much lower than the median towards HS 17006416 in this redshift range (Fechner et al. 2006). Therefore, it is unlikely that our results are biased due to the assumed line broadening.
7 Conclusions
Traditionally, the transverse proximity effect of a quasar has been claimed to be detectable as a radiation-induced void in the H i Ly forest. But due to several systematic effects like quasar variability, finite quasar lifetime, intrinsic overdensities around quasars, or anisotropic radiation, most searches yielded negative results (e.g. Schirber et al. 2004; Croft 2004).
In this paper, we have analysed the fluctuating spectral shape of the UV background in the projected vicinity of the three foreground quasars QSO J235034328, QSO J235004319 and QSO J234954338 (dubbed QSO A, B and C) on the line of sight towards HE 23474342 (). By comparing the H i absorption and the corresponding He ii absorption, we have presented evidence for a statistical excess of hard UV radiation near the foreground quasars. However, due to contamination of the forests near QSO A () and QSO B (), the evidence is strongest for QSO C (). We interpret these indicators for an excess of hard radiation near the foreground quasars as a manifestation of the transverse proximity effect. A simple model indicates that the foreground quasars are capable of generating the observed hard radiation over the observed distances of several Mpc. Furthermore, we tried to model the ionising radiation field of three metal line systems close to the foreground quasars. Two of those are strongly affected by line blending and do not allow for reliable photoionisation models. The remaining system can be modelled reasonably with or without a contribution by a local quasar. Future larger samples of highly ionised unblended metal systems near foreground quasars may provide evidence for local hardness fluctuations.
In Worseck & Wisotzki (2006) we revealed the transverse proximity effect as a systematic local hardness fluctuation around four foreground quasars near Q 0302003 and pointed out that the relative UV spectral hardness is a sensitive physical indicator of the proximity effect over distances of several Mpc. In this study we are able to confirm this on a second line of sight. Evidently, small-scale transmission fluctuations in the H i forest can dilute the small predicted signature of the effect. However, the hard spectral shape of the UV radiation field still indicates the transverse proximity effect despite the H i density fluctuations. Thus, we confirm our previous result that the spectral hardness breaks the density degeneracy that affects the traditional searches for the proximity effect. Moreover, the predicted transverse proximity effect of the quasars in the H i forest is weak due to the high UV background at 1 ryd. Still the UV spectral shape is able to discriminate local UV sources independent of the amplitude of the UV background.
Bolton et al. (2006) find that the large UV spectral shape fluctuations in the IGM are likely due to the small number of quasars contributing to the He ii ionisation rate at any given point, whereas the H i ionisation rate is rather homogeneous due to the probable contribution of star-forming galaxies (e.g. Bianchi et al. 2001; Sokasian et al. 2003; Shapley et al. 2006). Our findings confirm the picture that AGN create the hard part of the intergalactic UV radiation field. If the quasar is active long enough, its hard radiation field can be observed penetrating a background line of sight. It is also likely that light echoes from already extinguished quasars are responsible for some locations of hard radiation without an associated quasar. The transverse proximity effect of QSO C implies a minimum quasar lifetime of Myr (probably even Myr), providing additional constraints to more indirect estimates (e.g. Martini 2004, and references therein).
However, the UV radiation field near the foreground quasars is not homogeneously hard as naively expected, but still shows fluctuations. Apart from substantial measurement uncertainties, the unknown density structure around the quasar could shield the ionising radiation in some directions, maybe even preferentially in transverse direction to the line of sight (Hennawi & Prochaska 2007). Thus, radiative transfer effects may become important to explain a fluctuating UV spectral shape in the presence of a nearby quasar. Large-scale simulations of cosmological radiative transfer with discrete ionising sources are required to adress these issues in detail.
Moreover, the He ii forest has been resolved so far only towards two quasars at a very low . While the low data quality primarily creates uncertainties in the spectral shape on small spatial scales, large scales could be affected by cosmic variance. Thus, the general redshift evolution of the UV spectral shape is not well known and estimates obtained from single lines of sight may well be biased by local sources.
Acknowledgements.
We thank the staff of the ESO observatories La Silla and Paranal for their professional assistance in obtaining the optical data discussed in this paper. We are grateful to Peter Jakobsen for agreeing to publish the quasars from his survey. We thank Gerard Kriss and Wei Zheng for providing the reduced FUSE spectrum of HE 23474342. Tae-Sun Kim kindly supplied an additional line list of HE 23474342. GW and ADA acknowledge support by a HWP grant from the state of Brandenburg, Germany. CF is supported by the Deutsche Forschungsgemeinschaft under RE 353/49-1. We thank the anonymous referee for helpful comments.References
- Akylas et al. (2006) Akylas, A., Georgantopoulos, I., Georgakakis, A., Kitsionas, S., & Hatziminaoglou, E. 2006, A&A, 459, 693
- Appenzeller et al. (1998) Appenzeller, I., Fricke, K., Furtig, W., et al. 1998, The Messenger, 94, 1
- Asplund et al. (2005) Asplund, M., Grevesse, N., & Sauval, A. J. 2005, in ASP Conf. Ser. 336: Cosmic Abundances as Records of Stellar Evolution and Nucleosynthesis, 25, astro–ph/0410214
- Baade et al. (1999) Baade, D., Meisenheimer, K., Iwert, O., et al. 1999, The Messenger, 95, 15
- Bajtlik et al. (1988) Bajtlik, S., Duncan, R. C., & Ostriker, J. P. 1988, ApJ, 327, 570
- Ballester et al. (2000) Ballester, P., Mondigliani, A., Boitquin, O., et al. 2000, The Messenger, 101, 31
- Barger et al. (2003) Barger, A. J., Cowie, L. L., Capak, P., et al. 2003, AJ, 126, 632
- Bergeron et al. (2004) Bergeron, J., Petitjean, P., Aracil, B., et al. 2004, The Messenger, 118, 40
- Bianchi et al. (2001) Bianchi, S., Cristiani, S., & Kim, T.-S. 2001, A&A, 376, 1
- Bolton et al. (2006) Bolton, J. S., Haehnelt, M. G., Viel, M., & Carswell, R. F. 2006, MNRAS, 366, 1378
- Cardelli et al. (1989) Cardelli, J. A., Clayton, G. C., & Mathis, J. S. 1989, ApJ, 345, 245
- Croft (2004) Croft, R. A. C. 2004, ApJ, 610, 642
- Crotts (1989) Crotts, A. P. S. 1989, ApJ, 336, 550
- Crotts & Fang (1998) Crotts, A. P. S. & Fang, Y. 1998, ApJ, 502, 16
- Davé et al. (1997) Davé, R., Hernquist, L., Weinberg, D. H., & Katz, N. 1997, ApJ, 477, 21
- Dobrzycki & Bechtold (1991a) Dobrzycki, A. & Bechtold, J. 1991a, ApJ, 377, L69
- Dobrzycki & Bechtold (1991b) Dobrzycki, A. & Bechtold, J. 1991b, in ASP Conf. Ser. 21: The Space Distribution of Quasars, 272
- Fardal et al. (1998) Fardal, M. A., Giroux, M. L., & Shull, J. M. 1998, AJ, 115, 2206
- Fardal & Shull (1993) Fardal, M. A. & Shull, J. M. 1993, ApJ, 415, 524
- Fechner et al. (2004) Fechner, C., Baade, R., & Reimers, D. 2004, A&A, 418, 857
- Fechner & Reimers (2007a) Fechner, C. & Reimers, D. 2007a, A&A, 461, 847
- Fechner & Reimers (2007b) Fechner, C. & Reimers, D. 2007b, A&A, 463, 69
- Fechner et al. (2006) Fechner, C., Reimers, D., Kriss, G. A., et al. 2006, A&A, 455, 91
- Ferland et al. (1998) Ferland, G. J., Korista, K. T., Verner, D. A., et al. 1998, PASP, 110, 761
- Fernández-Soto et al. (1995) Fernández-Soto, A., Barcons, X., Carballo, R., & Webb, J. K. 1995, MNRAS, 277, 235
- Gallerani et al. (2007) Gallerani, S., Ferrara, A., Fan, X., & Roy Choudhury, T. 2007, MNRAS, submitted, arXiv:0706.1053
- Gaskell (1982) Gaskell, C. M. 1982, ApJ, 263, 79
- Giallongo et al. (1996) Giallongo, E., Cristiani, S., D’Odorico, S., Fontana, A., & Savaglio, S. 1996, ApJ, 466, 46
- Guimarães et al. (2007) Guimarães, R., Petitjean, P., Rollinde, E., et al. 2007, MNRAS, 377, 657
- Haardt & Madau (1996) Haardt, F. & Madau, P. 1996, ApJ, 461, 20
- Haardt & Madau (2001) Haardt, F. & Madau, P. 2001, in Clusters of Galaxies and the High Redshift Universe Observed in X-rays, ed. D. M. Neumann & J. T. T. Van, 64
- Heap et al. (2000) Heap, S. R., Williger, G. M., Smette, A., et al. 2000, ApJ, 534, 69
- Hennawi & Prochaska (2007) Hennawi, J. F. & Prochaska, J. X. 2007, ApJ, 655, 735
- Hernquist et al. (1996) Hernquist, L., Katz, N., Weinberg, D. H., & Miralda-Escudé, J. 1996, ApJ, 457, L51
- Horne (1986) Horne, K. 1986, PASP, 98, 609
- Jakobsen (1998) Jakobsen, P. 1998, A&A, 335, 876
- Jakobsen et al. (2003) Jakobsen, P., Jansen, R. A., Wagner, S., & Reimers, D. 2003, A&A, 397, 891
- Kim et al. (2002) Kim, T.-S., Carswell, R. F., Cristiani, S., D’Odorico, S., & Giallongo, E. 2002, MNRAS, 335, 555
- Kim et al. (2001) Kim, T.-S., Cristiani, S., & D’Odorico, S. 2001, A&A, 373, 757
- Kriss et al. (2001) Kriss, G. A., Shull, J. M., Oegerle, W., et al. 2001, Sci, 293, 1112
- Krumpe et al. (2007) Krumpe, M., Lamer, G., Schwope, A. D., et al. 2007, A&A, 466, 41
- Landolt (1992) Landolt, A. U. 1992, AJ, 104, 340
- Leitherer et al. (1999) Leitherer, C., Schaerer, D., Goldader, J. D., et al. 1999, ApJS, 123, 3
- Liske (2000) Liske, J. 2000, MNRAS, 319, 557
- Liske & Williger (2001) Liske, J. & Williger, G. M. 2001, MNRAS, 328, 653
- Liu et al. (2006) Liu, J., Jamkhedkar, P., Zheng, W., Feng, L.-L., & Fang, L.-Z. 2006, ApJ, 645, 861
- Loeb & Eisenstein (1995) Loeb, A. & Eisenstein, D. J. 1995, ApJ, 448, 17
- Martini (2004) Martini, P. 2004, in Carnegie Observatories Astrophysics Series Vol. 1: Coevolution of Black Holes and Galaxies, ed. L. C. Ho (Cambridge University Press), 170
- Maselli & Ferrara (2005) Maselli, A. & Ferrara, A. 2005, MNRAS, 364, 1429
- McDonald et al. (2005) McDonald, P., Seljak, U., Cen, R., Bode, P., & Ostriker, J. P. 2005, MNRAS, 360, 1471
- McIntosh et al. (1999) McIntosh, D. H., Rix, H.-W., Rieke, M. J., & Foltz, C. B. 1999, ApJ, 517, L73
- Miralda-Escudé (1993) Miralda-Escudé, J. 1993, MNRAS, 262, 273
- Miralda-Escudé et al. (2000) Miralda-Escudé, J., Haehnelt, M., & Rees, M. J. 2000, ApJ, 530, 1
- Møller & Kjærgaard (1992) Møller, P. & Kjærgaard, P. 1992, A&A, 258, 234
- Picard & Jakobsen (1993) Picard, A. & Jakobsen, P. 1993, A&A, 276, 331
- Rauch et al. (2005) Rauch, M., Becker, G. D., Viel, M., et al. 2005, ApJ, 632, 58
- Reimers et al. (1997) Reimers, D., Köhler, S., Wisotzki, L., et al. 1997, A&A, 327, 890
- Rollinde et al. (2005) Rollinde, E., Srianand, R., Theuns, T., Petitjean, P., & Chand, H. 2005, MNRAS, 361, 1015
- Schaerer (2003) Schaerer, D. 2003, A&A, 397, 527
- Schaye et al. (2007) Schaye, J., Carswell, R. F., & Kim, T.-S. 2007, MNRAS, submitted, astro-ph/0701761
- Schirber et al. (2004) Schirber, M., Miralda-Escudé, J., & McDonald, P. 2004, ApJ, 610, 105
- Schlegel et al. (1998) Schlegel, D. J., Finkbeiner, D. P., & Davis, M. 1998, ApJ, 500, 525
- Scott et al. (2000) Scott, J., Bechtold, J., Dobrzycki, A., & Kulkarni, V. P. 2000, ApJS, 130, 67
- Scott et al. (2004) Scott, J., Kriss, G. A., Brotherton, M., et al. 2004, ApJ, 615, 135
- Shapley et al. (2006) Shapley, A. E., Steidel, C. C., Pettini, M., Adelberger, K. L., & Erb, D. K. 2006, ApJ, 651, 688
- Shull et al. (2004) Shull, J. M., Tumlinson, J., Giroux, M. L., Kriss, G. A., & Reimers, D. 2004, ApJ, 600, 570
- Smette et al. (2002) Smette, A., Heap, S. R., Williger, G. M., et al. 2002, ApJ, 564, 542
- Smith et al. (2002) Smith, L. J., Norris, R. P. F., & Crowther, P. A. 2002, MNRAS, 337, 1309
- Sokasian et al. (2003) Sokasian, A., Abel, T., & Hernquist, L. 2003, MNRAS, 340, 473
- Srianand (1997) Srianand, R. 1997, ApJ, 478, 511
- Szokoly et al. (2004) Szokoly, G. P., Bergeron, J., Hasinger, G., et al. 2004, ApJS, 155, 271
- Telfer et al. (2002) Telfer, R. C., Zheng, W., Kriss, G. A., & Davidsen, A. F. 2002, ApJ, 565, 773
- Tepper-García (2006) Tepper-García, T. 2006, MNRAS, 369, 2025
- Tittley & Meiksin (2006) Tittley, E. R. & Meiksin, A. 2006, astro-ph/0605317
- Treister & Urry (2006) Treister, E. & Urry, C. M. 2006, ApJ, 652, L79
- Tytler & Fan (1992) Tytler, D. & Fan, X. 1992, ApJS, 79, 1
- Ueda et al. (2003) Ueda, Y., Akiyama, M., Ohta, K., & Miyaji, T. 2003, ApJ, 598, 886
- Véron-Cetty & Véron (2006) Véron-Cetty, M.-P. & Véron, P. 2006, A&A, 455, 773
- Weinberg et al. (1997) Weinberg, D. H., Hernquist, L., Katz, N., Croft, R., & Miralda-Escudé, J. 1997, in Proceedings of the 13th IAP Astrophysics Colloquium: Structure and Evolution of the Intergalactic Medium from QSO Absorption Line Systems, ed. P. Petitjean & S. Charlot (Paris: Editions Frontières), 133
- Weymann et al. (1981) Weymann, R. J., Carswell, R. F., & Smith, M. G. 1981, ARA&A, 19, 41
- Wisotzki et al. (2001) Wisotzki, L., Selman, F., & Gilliotte, A. 2001, The Messenger, 104, 8
- Wolf et al. (2003) Wolf, C., Wisotzki, L., Borch, A., et al. 2003, A&A, 408, 499
- Worseck & Wisotzki (2006) Worseck, G. & Wisotzki, L. 2006, A&A, 450, 495
- Zhang et al. (1995) Zhang, Y., Anninos, P., & Norman, M. L. 1995, ApJ, 453, L57
- Zhang et al. (1998) Zhang, Y., Meiksin, A., Anninos, P., & Norman, M. L. 1998, ApJ, 495, 63
- Zheng et al. (2004) Zheng, W., Kriss, G. A., Deharveng, J.-M., et al. 2004, ApJ, 605, 631