A Spitzer census of the IC 348 nebula
Abstract
\sstmid-infrared surveys enable accurate census of young stellar objects by sampling large spatial scales, revealing very embedded protostars and detecting low luminosity objects. Taking advantage of these capabilities, we present a \sst based census of the IC 348 nebula and embedded star cluster, covering a 2.5 pc region and comparable in extent to the Orion nebula. Our \sst census supplemented with ground based spectra has added 42 class II T-Tauri sources to the cluster membership and identified class 0/I protostars. The population of IC 348 likely exceeds 400 sources after accounting statistically for unidentified diskless members. Our \sst census of IC 348 reveals a population of class I protostars that is anti-correlated spatially with the class II/III T-Tauri members, which comprise the centrally condensed cluster around a B star. The protostars are instead found mostly at the cluster periphery about pc from the B star and spread out along a filamentary ridge. We further find that the star formation rate in this protostellar ridge is consistent with that rate which built the older exposed cluster while the presence of fifteen cold, starless, millimeter cores intermingled with this protostellar population indicates that the IC 348 nebula has yet to finish forming stars. Moreover, we show that the IC 348 cluster is of order 3-5 crossing times old, and, as evidenced by its smooth radial profile and confirmed mass segregation, is likely relaxed. While it seems apparent that the current cluster configuration is the result of dynamical evolution and its primordial structure has been erased, our finding of a filamentary ridge of class I protostars supports a model where embedded clusters are built up from numerous smaller sub-clusters. Finally, the results of our \sst census indicate that the supposition that star formation must progress rapidly in a dark cloud should not preclude these observations that show it can be relatively long lived.
Subject headings:
infrared: stars — circumstellar matter — open clusters and associations: individual (IC 348)1. Introduction
The IC 348 (catalog IC 348) nebula on the northeastern corner of the Perseus Molecular Cloud (Barnard, 1915) has been known to harbor pre-main sequence T-Tauri stars since they were revealed through a slitless grism survey by Herbig (1954). Slitless grism surveys were once the most powerful tool for searching for young stars (c.f., Herbig & Bell, 1988), while the subsequent development of infrared bolometers permitted better census of the darker regions of molecular clouds, including very young protostars which are young stars that still retain infalling envelopes. Such infrared observations in IC 348 by Strom et al. (1974) led, for example, to the discovery of an optically invisible bright source about 1pc from the clustering of members. Strom’s IR (catalog Name IC 348 IR) source was the first such hint that the stars forming in the IC 348 nebula might not all have the same age. Modern tools for identifying young stars include X-ray surveys, which parse young stellar objects (YSOs) using energetic emissions from their rotationally enhanced, magnetic activity, and wide-field infrared imaging surveys, which identify YSOs using the signature in the star’s broadband spectral energy distribution (SED) of thermal reprocessing of the star’s light by an optically thick circumstellar disk. To date roughly 300 young stars have been identified in the IC 348 nebula from X-ray (e.g., Preibisch & Zinnecker, 2001, 2004), optical (e.g., Trullols & Jordi, 1997; Herbig, 1998), near-infrared (Lada & Lada, 1995; Muench et al., 2003, hereafter, LL95 and M03 respectively) and spectroscopic surveys (Luhman et al., 1998b; Luhman, 1999; Luhman et al., 2003b, 2005a). These known members are clustered at the center of the nebula and have a median age of My (Luhman et al., 2003b); we examined the disk properties of these members in Lada et al. (2006, hereafter, Paper 1),
For this paper we undertook a mid-infrared survey of the IC 348 nebula with the \sst Space Telescope (Werner et al., 2004) to make a more complete membership census over a large cluster area. Statistical studies of the surface density of stars around IC 348 (Tej et al., 2002; Cambrésy et al., 2006) anticipated the discovery of more cluster members, but they could not identify individual members and could give no information about their evolutionary status. The classification of a young star as protostellar (class I) or more evolved class II sources with optically thick disks (see Adams et al., 1987, etc) is best accomplished using its broadband spectral energy distribution. Thus, we have identified and classified approximately 60 new cluster members, including protostellar objects, by constructing each source’s broad band SED and through spectroscopic follow up. Our census has expanded the confirmed boundaries of IC 348 to a physical size comparable to that well studied portion of the Orion Nebula Cluster (catalog Name Orion Nebula Cluster) (Hillenbrand & Hartmann, 1998).
Paper I contains all details of the data processing except for the far-infrared Multiband Imaging Photometer for \sst (MIPS; Rieke et al., 2004) observations (see §2.3.2)111The \sst data obtained for this paper were taken from AORs 3955200 (catalog ADS/Sa.Spitzer#3955200), 3651584 (catalog ADS/Sa.Spitzer#3651584), 4315904 (catalog ADS/Sa.Spitzer#4315904).. Candidate members were selected initially using spectral indices to identify the presence of infrared excess in their composite SEDs (§2.1). Ground-based spectra, including new observations presented in this paper, support the membership status for nearly all of the class II candidates and many of the protostars. Our census of very low luminosity protostars required the removal of an overwhelming population of extragalactic sources that masquerade as young stars (§2.3). In §3 we examine the nature of the IC 348 protostellar and class II members by comparing their positions to recent dense gas and dust maps from the COMPLETE222The COordinated Molecular Probe Line Extinction Thermal Emission Survey of Star Forming Regions, http://cfa-www.harvard.edu/COMPLETE/. project (Ridge et al., 2006), by analyzing their physical separations, and by placing them on the Hertzsprung-Russell (HR) diagram. We discuss briefly the implications of the cluster’s inferred structure and star forming history and examine the timescales for dynamical evolution of the central star cluster, pointing out their relevance for the timescale for dark cloud and circumstellar disk evolution (§4). Appendices include a discussion of the effects of reddening on the portion of a stellar or star+disk SED (§A), spectra of new members (§B) and a photometric catalog of candidate apparently diskless (class III) members selected from X-ray surveys of this region (§C).
2. Spitzer census
2.1. SED selected young stellar objects
Studying the previously known members of IC 348 in Paper I, we showed that the power-law fit of the portion of the young stars’ SEDs as observed by \sst, provided a good diagnostic of these members’ disk properties. We were able to empirically separate members with optically thick T-Tauri disks (hereafter class II sources) from those with little (termed anemic) or no apparent disk excess at these wavelengths333Hereafter, we use the term “class III” to describe all members having SEDs indicative of “anemic” inner disks or simple photospheres; see Paper I.. In this section we describe how we used this SED parameter to identify new young stellar objects (YSOs) from our entire \sst catalog of IC 348, including new embedded protostars that were not studied in Paper I. In searching for new members using disk excess it is also important to avoid selecting reddened background stars; as we discuss in Appendix A, the SED slope is fairly insensitive to extinction, which allows us to be confident in the quality of our initial member selection.
To fit a power law to the SED we required sources in our catalog to be detected in at least three of the four \sst IRAC (InfraRed Array Camera; Fazio et al., 2004) bands; this restricted our search to a by region of the GTO IRAC maps centered at 03:44:20.518, +32:10:34.87 with a PA of . Note, this entire region was also surveyed with MIPS. The resulting pc region enclosed both the -limited completeness census of Luhman et al. (2003b) and the FLAMINGOS444The FLoridA Multi-object Imaging Near-IR Grism Observational Spectrometer. See http://flamingos.astro.ufl.edu/. region studied by Muench et al. (2003)555These survey regions are compared in Figure 5.. In this region there are 906 sources detected in three IRAC bands, including 282 of the 300 known members studied in Paper I. Of these 906 candidates, 648 were detected in all four IRAC bands. Only 19 of the 906 sources lacked detections while 238 sources detected from lacked detections666One spectroscopically confirmed member, #396 (M5.25), did not have photometry at due to a nearby bright star; Persi was saturated at and ; there were nine sources detected only at . Otherwise all the sources in our field were detected in bands and . We found no sources detected only at .. To better constrain the candidates’ SEDs we derived upper limits for all sources lacking either detections.
We constructed the versus color-magnitude diagram (CMD, Figure 1a) for these 906 candidates to further refine our selection criteria. Upper-limits for the sources lacking flux measurements are displayed with arrows. Two loci are clearly evident in the CMD: one of nearly colorless stars and the second redder locus we expect to consist primarily of T-Tauri stars with disks. A strong magnitude cutoff for colorless stars is evident at ; most the upperlimits are . In Figure 1b we have replaced the color with the power-law fit to the observed slope of the IRAC portion of these sources’ SEDs ()777Upper limits were not used in these calculations, although they were useful for filtering sources; see §2.1.; this clearly reinforces the existence of two intrinsic loci in the CMD. The two loci are more distinct when plotting as a function of because we have assumed the correct underlying shape of the objects’ SEDs; i.e., whether it is the Raleigh Jeans portion of a star’s photospheric SED or the thermal infrared SED of a passive, re-radiating optically thick disk.
Further, these power-law fits are less sensitive to uncorrelated photometric uncertainties than colors, which are of course ratios between only two wavelengths. Nonetheless, we further filtered our sample of candidate members based on photometric quality. We imposed an empirical flux limit of based on the increased spread in the value of for fainter colorless stars; we did, however include fainter IRAC sources if they were also detected at 888We will use the magnitude to parse the sources in our subsequent analysis for four reasons: 1) it is clearly more sensitive than the channel; 2) when combined with a standard extinction law it will be the primary IRAC bandpass for emergent flux from heavily reddened sources (Whitney et al. (2004); Appendix §A and Figure 22) due at least in part to silicate absorption in the bandpass; 3) it is somewhat less contaminated by PAH emission than the bandpass frequently evident in the SEDs of non-cluster sources.. We also required the detections to have photometric errors of less than 0.2 magnitudes.
After applying these photometric constraints we had 657 candidates in our IC 348 \sst region. Figure 2 displays the distribution function of as a histogram for these candidates. The first narrow peak in the distribution function at -2.8 reflects the narrowly constrained value of for stellar photospheres; photospheric has very little spectral type dependence (Paper I). A second peak at corresponds to class II T-Tauri stars with optically thick disks and a third peak corresponds to sources with flat or rising mid-IR SEDs. Using our empirical boundary between anemic and class II disks (; Paper I; shown in Figure 2 ) we identified candidate YSOs in our IC 348 region. Our tally of IC 348 YSOs is larger than the total number of IC 348 YSOs (158) identified by Jørgensen et al. (2006). While we are using slightly lower luminosity limits than Jørgensen et al., the statistics of their Legacy survey come from a different and larger cluster area, correspond to a different definition of the spectral index and include class III (by their definition) sources; thus, we do not further discuss the statistics of this Legacy project. Finally, we did not search for new members with “anemic” type disks (; Paper I) since a search for sources with very small excesses can be hampered by poor photometry, in this case due to the nebula (see the scatter in the power-law fit sigma overplotted Figure 2).
We subdivided the YSO sample into two classes based on the shape of the distribution function: thick disk class II sources in the peak, and class I “protostellar” candidates with . Flat spectrum sources, considered to be protostars in a later stage of envelope dispersal or with highly flared disks, can have slightly falling mid-infrared SED slopes, (Lada, 1987). A distinction between highly flared class II disks and emission from disk +remnant envelope may require data at wavelengths longer than . There are a total of candidate class II sources in our IC 348 \sst region and red class I candidates. For comparison to other \sst studies of YSOs in clusters that use color-color classification techniques (e.g., Megeath et al., 2004), we plot two such diagrams in Figure 3. Together these encompassed all band IRAC detected sources; protostellar and class II sources are color-coded on these plots. Sources parsed by are well segregated in the color-color diagram except where photometric errors in a single color yield some scattering.
| IDaaThe running number identifiers used in this work corresponds to and extends that system used in Luhman et al. (1998b); Luhman (1999); Luhman et al. (2003b, 2005b, 2005a); Muzerolle et al. (2006); Lada et al. (2006). | (J2000) | (J2000) | bb is a flag on the source’s position indicating the origin of that astrometry: Muench et al. (2m: 2003, ; FLAMINGOS); Luhman et al. (cfht: 2003b); Luhman et al. (wfpc: 2005b); irac: IRAC mosaics, this paper. | Spectral Type | MembershipccMembership in IC 348 is indicated by and a position above the main sequence for the distance of IC 348 (“”), excess emission in the IRACMIPS data (“ex”), the shape of the gravity-sensitive steam bands (“H2O”), Na I and K I strengths intermediate between those of dwarfs and giants (“NaK”), strong Li absorption (“Li”) or emission in the Balmer, Paschen or Brackett lines of hydrogen (“e”). | Class |
|---|---|---|---|---|---|---|
| 70 | 03 43 58.55 | 32 17 27.7 | cfht | M3.5(IR),M3.75(op) | ,H2O,ex,e,Li,NaK | II |
| 117 | 03 43 59.08 | 32 14 21.3 | 2m | M3-M4(IR) | ,H2O,e,ex | II |
| 132 | 03 44 27.25 | 32 14 21.0 | cfht | M3.5(IR,op) | ,H2O,ex,NaK | II |
| 162 | 03 43 48.81 | 32 15 51.7 | cfht | M4.5(IR) | ,H2O,ex | II |
| 179 | 03 44 34.99 | 32 15 31.1 | cfht | M3.5(IR,op) | ,H2O,ex,NaK | II |
| 199 | 03 43 57.22 | 32 01 33.9 | wfpc | M6.5(IR) | ,H2O,ex | II |
| 215 | 03 44 28.95 | 32 01 37.9 | cfht | M3.25(IR) | ,H2O,ex | II |
| 231 | 03 44 31.12 | 32 18 48.5 | cfht | M3.25(IR) | ,H2O,ex | II |
| 234 | 03 44 45.22 | 32 01 20.0 | cfht | M5.75(IR) | ,H2O,ex | I |
| 245 | 03 43 45.17 | 32 03 58.7 | cfht | ?(IR) | ex | I |
| 265 | 03 44 34.69 | 32 16 00.0 | cfht | M3.5(IR) | ,ex | II |
| 280 | 03 44 15.23 | 32 19 42.1 | cfht | M4.75(IR,op) | ,H2O,ex,NaK | II |
| 321 | 03 44 22.94 | 32 14 40.5 | cfht | M5.5(IR) | ,H2O,ex | II |
| 327 | 03 44 06.00 | 32 15 32.3 | cfht | M6.5(IR) | H2O,ex | II |
| 364 | 03 44 43.03 | 32 15 59.8 | cfht | M4.75(IR,op) | ,H2O,ex,NaK | II |
| 368 | 03 44 25.70 | 32 15 49.3 | cfht | M5.5(IR) | ,H2O,ex | II |
| 406 | 03 43 46.44 | 32 11 06.1 | cfht | M6.5(IR),M5.75(op) | ,H2O,ex,NaK | II |
| 643 | 03 44 58.55 | 31 58 27.3 | cfht | M6.5(IR) | ,H2O,ex | II |
| 723 | 03 43 28.47 | 32 05 05.9 | cfht | M4(IR) | ,H2O,e,ex | II |
| 904 | 03 45 13.81 | 32 12 10.1 | cfht | M3.5(IR) | ,H2O,ex | I |
| 1679 | 03 44 52.07 | 31 58 25.5 | cfht | M3.5(IR) | ,H2O,ex | II |
| 1683 | 03 44 15.84 | 31 59 36.9 | cfht | M5.5(IR),M5.25(op) | ,H2O,ex,e,NaK | II |
| 1707 | 03 43 47.63 | 32 09 02.7 | cfht | M7(IR) | H2O,ex | II |
| 1761 | 03 45 13.07 | 32 20 05.3 | 2m | M5(IR) | ,H2O,ex | II |
| 1833 | 03 44 27.21 | 32 20 28.7 | cfht | M5.25(IR),M5(op) | ,H2O,ex,NaK | II |
| 1843 | 03 43 50.57 | 32 03 17.7 | cfht | M8.75(IR) | ,H2O,ex | II |
| 1872 | 03 44 43.31 | 32 01 31.6 | 2m | ?(IR) | e,ex | I |
| 1881 | 03 44 33.79 | 31 58 30.3 | cfht | M4.5(IR),M3.75(op) | ,H2O,ex,e,NaK | II |
| 1889 | 03 44 21.35 | 31 59 32.7 | 2m | ?(IR) | e,ex | I |
| 1890 | 03 43 23.57 | 32 12 25.9 | cfht | M4.5(op) | ,NaK | II |
| 1905 | 03 43 28.22 | 32 01 59.2 | cfht | M0(IR),M1.75(op) | ,H2O,ex,e,Li | II |
| 1916 | 03 44 05.78 | 32 00 28.5 | 2m | ?(IR) | ex | I |
| 1923 | 03 44 00.47 | 32 04 32.7 | 2m | M5(IR) | ,H2O,ex | II |
| 1925 | 03 44 05.78 | 32 00 01.3 | cfht | M5.5(IR) | ,H2O,ex | II |
| 1933 | 03 45 16.35 | 32 06 19.9 | cfht | ?(IR),K5(op) | ,ex,e | II |
| 10120 | 03 45 17.83 | 32 12 05.9 | cfht | M3.75(op) | e,NaK,,ex | II |
| 10176 | 03 43 15.82 | 32 10 45.6 | cfht | M4.5(IR) | ,H2O,ex | II |
| 10219 | 03 45 35.63 | 31 59 54.4 | cfht | M4.5(IR,op) | ,H2O,ex,NaK,e | II |
| 10305 | 03 45 22.15 | 32 05 45.1 | cfht | M8(IR) | ,H2O,ex | II |
| 22232 | 03 44 21.86 | 32 17 27.3 | cfht | M5(IR),M4.75(op) | ,H2O,ex,e,NaK | II |
| 30003 | 03 43 59.17 | 32 02 51.3 | wfpc | M6(IR) | ,H2O,ex | I |
2.2. Class II census results
2.2.1 Membership
In this section we explore the membership status of the 136 class II candidates identified in §2.1, revealing that the vast majority of them are confirmed spectroscopicallly as members. Seventy six of our 136 selected class II objects were cataloged previously as members of IC 348 (Herbig, 1998; Luhman et al., 1998b; Luhman, 1999; Luhman et al., 2003b, 2005a). For this paper we obtained optical and near-infrared spectroscopy of 34 more class II sources; these observations are detailed in Appendix B and in Table 1 we list new members with spectral types. From the remaining 26 class II candidates, we identified an additional eight sources whose SEDs suggest they are high quality candidates (55308, 10031, 1287, 1379, 22865, 753; see Figure 4 and Table 2). The four latter objects are very faint ; see also Figure 6), and if they are cluster members rather than background sources (e.g. galaxies) then they are almost certainly brown dwarfs given their low luminosities. Three sources classified initially as class II sources using IRAC data were reclassified as protostellar (§2.3) based on their MIPS SEDs. The remaining sources were class II contaminants, consisting of either HH knots (2) or false excesses sources detected in only 3 bands and contaminated by nebular emission (13). We conclude that the technique of using as a discriminator of class II YSOs is successful for roughly 90% of the initial class II sample (118 members from 136 candidates).
Figure 5 compares the locations of our new class II sources to previous deep IR/spectroscopic census.
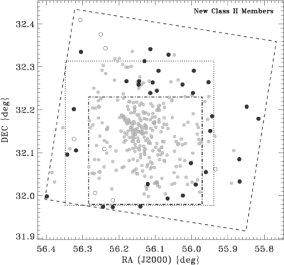
New class II sources roughly correlate spatially with previously known members although all but 8 lie outside the Luhman et al. (2003b) completeness region. Inside that survey region five new class II members are deeply embedded in a dark molecular gas cloud at the cluster’s southwestern boundary, while three are very faint, likely lying below that survey’s limit (e.g. # 1379) and lack spectroscopic followup. Most (27) of the new class II members fall within the boundaries of the Muench et al. (2003) near-infrared survey and confirmed cluster members can now be found as far as 2 pc from the cluster core. Compared to unidentified members predicted by Cambrésy et al. (2006) we found 23 new class II and 4 class I with while our disk based SED selection criteria could not have revealed new class III members, which outnumber class II members by a factor of two. If we consider that the surface density excess seen in the Cambrésy et al. 2MASS map of IC 348 extends well beyond the borders of our \sst survey then we would conclude that Cambrésy et al. has underestimated somewhat the true population size at larger radii. A simple ratio of 2MASS excess to \sst survey areas suggests a correction factor of 3-4. Section 4.1 includes further discussion of the total cluster population size inferred from our \sst survey statistics.
2.2.2 Completeness
We explored the completeness of our class II membership as affected by the selection requirements we used when identifying new candidates and by the depth of our spectroscopic observations. Intrinsically, our \sst census is very sensitive to faint sources while insensitive to the effects of dust extinction. For example, the magnitude limit in the \sst color-magnitude diagram of Figure 1a corresponds to the ability to detect a diskless 10 My brown dwarf (; Muench et al., 2003, ; see their Figure 12) at multiple \sst wavelengths.; further, we could easily detect a 3 My brown dwarf seen through through visual magnitudes of extinction. Our first selection requirement, requiring detection at three bands short-ward of , would have included of the known IC 348 members examined in Paper I; those missing were primarily class III members (those whose SEDs lack disk excess signatures). We were more concerned the application of two photometric constraints, and mag and how these filters might affect the completeness of our census.
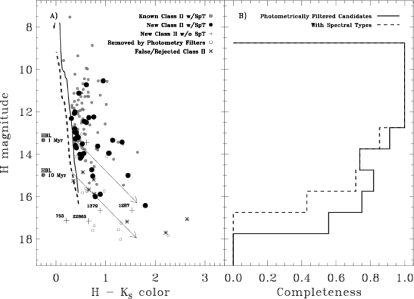
Figure 6a is an CMD for all potential class II candidates. This includes the 136 class II candidates and those sources excluded by our photometric constraints; each category is plotted with different symbols. Using the band magnitude as our proxy for the mass+age+extinction limits of this study, the ratio of the photometrically filtered to the unfiltered Class II band LFs gives an estimate of our incompleteness due to these quality filters (Figure 6b). Sources photometrically filtered from our catalog correspond to about of the sample over a range of magnitude, due probably to the variable intensity of the nebular background. Our class II census is probably more complete than suggested ( complete for ) because some fraction of the photometrically filtered class II candidates would have been rejected as non-members. Most of our high quality candidate members lacking spectra are faint. Dividing the LF of our spectroscopic sample by the LF of the unfiltered class II candidates yields a similar completeness limit: complete for .
| ID | (J2000) | (J2000) | Class | |
|---|---|---|---|---|
| 753 | 03 44 57.617 | 32 06 31.25 | cfht | II |
| 1287 | 03 44 56.904 | 32 20 35.86 | cfht | II |
| 1379 | 03 44 52.010 | 31 59 21.92 | cfht | II |
| 1401 | 03 44 54.690 | 32 04 40.28 | cfht | I |
| 1517 | 03 43 20.029 | 32 12 19.38 | cfht | IbbThese class I sources are located away from any molecular material and may be background sources with SEDs that mimic circumstellar disks. |
| 1898 | 03 44 43.893 | 32 01 37.37 | 2m | 0/I |
| 4011 | 03 44 06.914 | 32 01 55.35 | cfht | I |
| 10031 | 03 44 59.979 | 32 22 32.83 | 2m | II |
| 21799 | 03 43 51.586 | 32 12 39.92 | cfht | IbbThese class I sources are located away from any molecular material and may be background sources with SEDs that mimic circumstellar disks. |
| 22865 | 03 45 17.647 | 32 07 55.33 | cfht | II |
| 22903 | 03 45 19.053 | 32 13 54.85 | cfht | IbbThese class I sources are located away from any molecular material and may be background sources with SEDs that mimic circumstellar disks. |
| 40150 | 03 43 56.162 | 32 03 06.11 | irac | I |
| 40182 | 03 45 03.838 | 32 00 23.54 | irac | II |
| 52590 | 03 44 20.384 | 32 01 58.45 | irac | I |
| 52648 | 03 44 34.487 | 31 57 59.60 | irac | I |
| 54299 | 03 43 44.284 | 32 03 42.41 | irac | II |
| 54361 | 03 43 51.026 | 32 03 07.74 | irac | I |
| 54362 | 03 43 50.948 | 32 03 26.24 | irac | I |
| 54419 | 03 43 59.400 | 32 00 35.40 | irac | I |
| 54459 | 03 44 02.415 | 32 02 04.46 | irac | I |
| 54460 | 03 44 02.622 | 32 01 59.58 | irac | I |
| 55308 | 03 45 13.497 | 32 24 34.68 | irac | II |
| 55400 | 03 44 02.376 | 32 01 40.01 | irac | I |
| 57025 | 03 43 56.890 | 32 03 03.40 | m24m | 0 |
| HH-211 | 03 43 56.770 | 32 00 49.90 | m70m | 0 |
| IDaaThe optical/near-IR spectra of these sources indicate they are galaxies (§2.3.1) or field stars (§B.3). The wavelength regime of the spectral observation is given (op/IR). Column descriptions same as in Table 1. | (J2000) | (J2000) | Spectra | |
|---|---|---|---|---|
| 398 | 03 43 43.28 | 32 13 47.3 | cfht | op |
| 424 | 03 43 43.11 | 32 17 47.7 | cfht | op |
| 1920 | 03 43 23.55 | 32 09 07.8 | cfht | op |
| 22898 | 03 45 18.713 | 32 05 31.0 | cfht | IR |
| 40163 | 03 44 39.994 | 32 01 33.5 | irac | IR |
| 52827 | 03 45 14.012 | 32 06 53.0 | irac | IR |
| 52839 | 03 45 13.199 | 32 10 01.9 | irac | IR |
2.3. Protostellar census
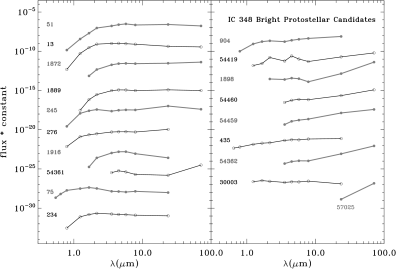
The results of scrutinizing the 56 selected class I candidates are given in this section. Figure 7 displays the spectral energy distributions of the 15 brightest class I protostellar () candidates, including MIPS photometry out to . Sources are sorted on decreasing flux; all have , which should reduce the chance that they might be galaxies (Jørgensen et al., 2006). All of these sources are clearly protostars from their SEDs; previous speculation on the nature of some of these objects based on the association of such red \sst point sources with HH objects (Walawender et al., 2006) appears to be confirmed. There is an interesting apparent correlation of SED shape with flux. As has been shown for protostars in Taurus (Kenyon & Hartmann, 1995), the most luminous IC 348 protostars are exclusively flat spectrum sources, while source SEDs longward of become progressively steeper with decreasing source luminosity. Moreover, the location of the flat spectrum sources in Figure 1b mirrors another fact shown by the Kenyon & Hartmann Taurus study, namely, that flat spectrum protostars are intrinsically more luminous than class II sources. If we were to “deredden” our flat spectrum protostars along the reddening vector in Figure 1b then we would find them to be 2-3+ magnitudes brighter than essentially all other IC 348 members. This indicates to us that flat spectrum protostars have a star+disk+envelope structure distinct from class II sources and likely correspond to a different evolutionary phase. For comparison to the fainter steeper class I protostars we plot the steep slope of the MIPS SED of #57025, which lacks detection in IRAC bands (it is placed on this plot using the upperlimit) and which corresponds to a previously known class 0 source that drives the HH-797 jet (§2.3.2).
Five of these bright protostars had existing spectroscopy to which we have added seven new spectra (see also Appendix B). Seven of these twelve IC 348 protostars have M type spectra, ranging from M0 for the luminous IR source first identified by Strom et al. (1974, (our source #13)) to the newly typed faint M6 source #30003, which is enshrouded in a scattered light cavity that can been seen in HST/optical (Luhman et al., 2005b), near-IR (M03) and \sst images. Spectral types were not measurable for the other five sources because no absorption features were detected in the infrared. New featureless infrared spectra of four of these sources are shown in Figure 8; a spectrum of the fifth, #51, appeared in Luhman et al. (1998b). Based on their mid-IR SEDs, the featureless nature of their near-IR spectra is probably due to veiling by continuum emission from circumstellar material (Casali & Matthews, 1992; Greene & Lada, 1996) though these spectra do not exclude the possibility that they are embedded, early type (thus hotter) YSOs. Much hotter YSOs (corresponding to A or B type) are excluded because we do not observed the characteristics of massive protostars, namely, very large bolometric luminosities , hydrogen absorption lines and/or evidence of embedded H II regions. Given the presence of hydrogen emission lines in a number of the objects and their proximity to other class I objects and mm cores, it is very likely they are low mass members of IC 348 rather than massive members or background sources. Three additional bright class I candidates are physically associated with molecular cloud cores (54460, 54459, 54362) but lack spectra. All three of these sources have MIPS SEDs consistent with significant reprocessing of their emergent flux by cold envelopes, and Tafalla et al. (2006) recently identified a molecular outflow associated with #54362. We tabulated all of these bright sources as protostellar members of IC 348; again, sources with spectra are listed in Table 1; those without are in Table 2.
Additionally, we reclassified three selected class II sources as protostellar based upon their SEDs. Sources #1898, 54361 and #55419, which all appeared as nebulous blobs in the near-IR images of M03, appear as point sources in \sst data, have class II IRAC SED slopes yet have sharply rising MIPS SEDs (See Figure 7). Source #1898 is infact the brightest far-IR source in IC 348 (fluxes of and ) and is almost certainly a newly identified protostellar member (see also §3.3.3; Figure 18a). The slope of its 70/160µm SED is 1.2 compared to 1.1 and 2.4, respectively for the HH-797 and HH-211 class 0 sources. Were it not for its detection in scattered light in the near-IR and that a strong molecular outflow has not (yet) been found, its far-IR SED would suggest that it is also a class 0 source. Source #54361 is a point source from but is blended with #54362 at ; the emission is elongated N-S, peaks right between #54361 and #54362 and cannot be ascribed confidently to either. This source also appears to lie along the axis of the #54362 molecular outflow found recently by Tafalla et al. (2006), who suggested that #54361 may be a bright but unresolved knot of shocked gas instead of a young embedded star. Source #55419 also appears to be blended with parts of the HH-211 outflow and is detected at . Additional spectroscopic data may clarify these latter 2 candidates’ true nature; in this work we have included them as candidate class I sources.

2.3.1 Low luminosity protostellar candidates
Finally, we noted an interesting trend in Figure 1b: most of the class II candidates are bright, while most of the class I candidates are very faint. Although this low luminosity range has a high likelihood of galaxy contamination, it is important to investigate these faint candidates to search for low luminosity young stars that would be missed by the flux limits suggested by Jørgensen et al. (2006) and co-workers. We began our exploration of these sources by plotting in Figure 9 the SEDs of the 41 faint protostellar candidates, sorting them by magnitude (or its upper limit).
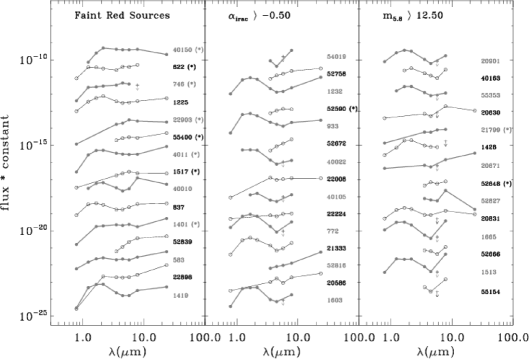
The ensemble population is clearly dominated by a class of objects with non-power law SEDs, which was a fact previously evident in the poor quality of many of the class I SED power-law fits (Figure 2). Many have stellar-like continuum out to 5 microns with sharply inflected and rising SEDs beyond. Such a SED feature can be ascribed to PAH emission at 6 and 8 microns, which appear in galaxies and evolved stars (Jura et al., 2006). To substantiate this point, we obtained Keck NIRC (Matthews & Soifer, 1994) spectra of 4 of these red low luminosity sources. Two of these targets have monotonically rising \sst SEDs, while 2 have sharp inflections. These spectra, which were obtained on 23 November 2004, are shown in Figure 10. The fact that these sources are not very red (especially compared to those spectra in Figure 8) indicates they are not class I objects, and the lack of steam indicates they are not brown dwarfs. They are probably all galaxies. Source #52839 is almost certainly a galaxy based on its emission lines, which do not correspond to rest-frame wavelengths of any lines typical of young stars.
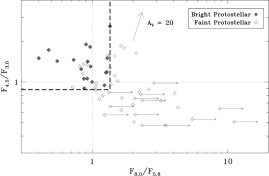
We chose to exclude all sources with PAH or similar features from our census of faint YSOs. To identify the best YSO candidates out of these faint sources and exclude PAH rich sources, we compared the monochromatic flux ratios and of these faint candidate YSOs to these flux ratios for the brighter protostars none of which show obvious PAH emission (Figure 11). Flat spectrum sources are located at (1,1) and sources with strong silicate absorption fall into the upper left quadrant. We traced a box around the locations of the brighter protostellar candidates in this diagram and chose the 11 faint candidates within it as additional protostellar candidates. This box excluded the four Keck sources whose spectra are clearly not those of YSOs.
Some of these 11 low-luminosity class I candidates are more likely to be young stars than others. Two sources in particular have stellar (or sub-stellar) spectral features (#622, M6; #746, M5) and two sources are close companions to bright class I sources (#55400 and 40150). Source #4011 lies in the center of narrow dark lane/shadow clearly seen in the infrared images of Muench et al. (2003). This strongly suggests it is a young star-disk system seen nearly edge-on, which is reinforced by the presence of a jet (HH799) that was observed and associated with this source by Walawender et al. (2006). However, the presence of an edge-on disk could cause a class II member to appear as a class I source (Chiang & Goldreich, 1999); thus, the exact evolutionary stage of these young stars is unclear. Edge-on geometries also cause sources to appear subluminous on the HR diagram due to the fact the optical/near-IR flux is likely scattered light, which leads to low measured values of extinction, while the mid-IR flux is still quenched by the disk extinction. Both #622 and #746 are, for example, subluminous on the HR diagram. Note, if the dust in the disk is grey, the reddening vector(s) in Figure 1 are vertical and the basic IRAC SED classification remains nearly unchanged 999See also the SED dependence of nearly-edge on disks and dust settling in D’Alessio et al. (1999)..

Although these faint class I candidates are spatially correlated near dark cores, others lie far from the molecular cloud, including candidates #1517 and 21799 to the NW. These are likely extragalactic contaminants despite their convincing SEDs; for completeness, all of the protostellar candidates lacking spectral confirmation are given Table 2. In total we find the accuracy of for uniquely selecting class I sources is quite low (less than ). While the application of additional selection criteria (flux limits) like those used by Jørgensen et al. (2006) and we used in Figure 11 can improve the accuracy of a class I census, the reality is that galaxies and PAH sources masquerading as protostars dominate the statistics even for this nearby young cluster and follow up spectroscopy is clearly needed to confirm low luminosity protostellar candidates.
| ID | Magnitudes | UncertaintiesaaThe listed magnitude is an upper limit if the listed uncertainty is given as -9. | ||||||||
|---|---|---|---|---|---|---|---|---|---|---|
| 70 | 9.93 | 9.58 | 9.28 | 8.59 | 5.40 | 0.02 | 0.01 | 0.02 | 0.03 | 0.03 |
| 117 | 10.87 | 10.27 | 9.99 | 9.27 | 6.40 | 0.01 | 0.02 | 0.03 | 0.06 | 0.03 |
| 132 | 11.06 | 10.64 | 10.16 | 9.61 | 6.25 | 0.01 | 0.05 | 0.01 | 0.04 | 0.03 |
| 162 | 11.26 | 10.86 | 10.32 | 9.51 | 6.81 | 0.02 | 0.02 | 0.03 | 0.03 | 0.03 |
| 179 | 11.35 | 10.98 | 10.47 | 9.60 | 7.19 | 0.02 | 0.05 | 0.03 | 0.05 | 0.03 |
| 199 | 11.96 | 11.59 | 11.16 | 10.54 | 7.79 | 0.03 | 0.05 | 0.06 | 0.03 | 0.05 |
| 215 | 11.08 | 10.73 | 10.28 | 9.62 | 5.91 | 0.01 | 0.02 | 0.03 | 0.02 | 0.03 |
| 231 | 11.82 | 11.28 | 10.89 | 10.02 | 6.66 | 0.01 | 0.06 | 0.05 | 0.02 | 0.03 |
| 234 | 11.57 | 10.94 | 10.30 | 9.46 | 6.13 | 0.02 | 0.03 | 0.05 | 0.03 | 0.03 |
| 245 | 10.05 | 9.02 | 8.15 | 7.18 | 2.40 | 0.01 | 0.03 | 0.03 | 0.01 | 0.03 |
| 265 | 11.00 | 10.43 | 9.85 | 9.15 | 4.59 | 0.02 | 0.06 | 0.04 | 0.02 | 0.03 |
| 280 | 12.22 | 11.99 | 11.69 | 11.07 | 5.87 | 0.01 | 0.01 | 0.05 | 0.04 | -9.00 |
| 321 | 12.70 | 12.45 | 12.12 | 11.40 | 5.61 | 0.01 | 0.03 | 0.07 | 0.08 | -9.00 |
| 327 | 12.58 | 12.24 | 11.79 | 11.11 | 8.60 | 0.01 | 0.02 | 0.05 | 0.05 | 0.04 |
| 364 | 12.04 | 11.66 | 11.04 | 10.16 | 6.46 | 0.01 | 0.04 | 0.03 | 0.09 | 0.03 |
| 368 | 12.74 | 12.32 | 12.01 | 11.35 | 7.11 | 0.01 | 0.02 | 0.08 | 0.08 | 0.06 |
| 406 | 13.15 | 12.81 | 12.58 | 12.00 | 9.09 | 0.01 | 0.02 | 0.06 | 0.14 | 0.04 |
| 643 | 13.19 | 12.87 | 12.25 | 11.54 | 8.86 | 0.01 | 0.02 | 0.03 | 0.04 | 0.04 |
| 723 | 12.18 | 11.67 | 11.42 | 10.62 | 7.44 | 0.01 | 0.03 | 0.04 | 0.05 | 0.03 |
| 753 | 16.03 | 15.45 | 14.88 | 13.25 | 6.83 | 0.12 | 0.12 | 0.15 | -9.00 | -9.00 |
| 904 | 12.91 | 11.72 | 10.66 | 9.39 | 5.22 | 0.05 | 0.01 | 0.05 | 0.02 | 0.03 |
| 1287 | 13.40 | 12.82 | 12.26 | 11.82 | 7.98 | 0.02 | 0.10 | 0.07 | 0.05 | 0.04 |
| 1379 | 15.02 | 14.60 | 14.12 | 13.65 | 8.35 | 0.03 | 0.04 | 0.04 | 0.10 | -9.00 |
| 1401 | 15.07 | 14.43 | 13.53 | 12.89 | 8.13 | 0.02 | 0.04 | 0.06 | 0.13 | 0.13 |
| 1517 | 15.35 | 14.32 | 13.31 | 12.54 | 9.04 | 0.04 | 0.03 | 0.11 | 0.08 | 0.04 |
| 1679 | 11.30 | 11.07 | 10.74 | 10.28 | 6.47 | 0.01 | 0.02 | 0.03 | 0.03 | 0.03 |
| 1683 | 12.31 | 12.04 | 11.62 | 10.85 | 7.55 | 0.02 | 0.02 | 0.07 | 0.04 | 0.03 |
| 1707 | 13.04 | 12.59 | 12.29 | 11.50 | 8.68 | 0.02 | 0.02 | 0.06 | 0.04 | 0.04 |
| 1761 | 12.77 | 12.54 | 12.13 | 11.60 | 9.04 | 0.01 | 0.03 | 0.05 | 0.04 | 0.05 |
| 1833 | 12.10 | 11.79 | 11.52 | 10.92 | 8.03 | 0.01 | 0.02 | 0.04 | 0.04 | 0.03 |
| 1843 | 13.88 | 13.36 | 12.76 | 11.97 | 5.04 | 0.03 | 0.05 | 0.08 | 0.06 | -9.00 |
| 1872 | 7.78 | 6.67 | 5.84 | 4.92 | 1.26 | 0.01 | 0.00 | 0.05 | 0.02 | 0.03 |
| 1881 | 10.99 | 10.75 | 10.50 | 9.97 | 6.44 | 0.02 | 0.03 | 0.06 | 0.04 | 0.03 |
| 1889 | 9.76 | 8.78 | 8.06 | 7.26 | 3.48 | 0.02 | 0.03 | 0.03 | 0.03 | 0.03 |
| 1890 | 12.11 | 11.86 | 11.55 | 11.10 | 8.63 | 0.01 | 0.03 | 0.04 | 0.04 | 0.04 |
| 1898 | 12.46 | 11.28 | 10.72 | 10.70 | 4.57 | 0.12 | 0.11 | 0.17 | 0.29 | 0.04 |
| 1905 | 9.30 | 8.98 | 8.78 | 8.25 | 5.75 | 0.02 | 0.03 | 0.04 | 0.03 | 0.03 |
| 1916 | 10.87 | 9.75 | 8.97 | 8.61 | 6.40 | 0.03 | 0.02 | 0.02 | 0.04 | 0.03 |
| 1923 | 13.11 | 12.54 | 12.00 | 11.42 | 7.62 | 0.02 | 0.02 | 0.06 | 0.05 | 0.04 |
| 1925 | 12.66 | 12.09 | 11.50 | 10.87 | 7.52 | 0.02 | 0.03 | 0.05 | 0.04 | 0.03 |
| 1933 | 8.09 | 7.42 | 6.96 | 6.06 | 3.26 | 0.01 | 0.01 | 0.03 | 0.02 | 0.03 |
| 4011 | 14.61 | 14.00 | 13.30 | 12.28 | 7.60 | 0.04 | 0.03 | 0.10 | 0.06 | 0.03 |
| 10031 | 12.59 | 12.39 | 12.01 | 11.30 | 8.26 | 0.01 | 0.04 | 0.03 | 0.03 | 0.04 |
| 10120 | 11.99 | 11.71 | 11.41 | 11.00 | 8.04 | 0.02 | 0.02 | 0.04 | 0.04 | 0.04 |
| 10176 | 13.36 | 13.01 | 12.63 | 12.10 | 7.59 | 0.02 | 0.03 | 0.06 | 0.04 | -9.00 |
| 10219 | 11.28 | 10.96 | 10.69 | 9.87 | 6.98 | 0.01 | 0.01 | 0.05 | 0.01 | 0.03 |
| 10305 | 14.33 | 13.82 | 13.55 | 12.89 | 7.30 | 0.03 | 0.02 | 0.16 | 0.15 | -9.00 |
| 21799 | 16.51 | 15.79 | 14.71 | 13.64 | 8.37 | 0.06 | 0.13 | 0.20 | 0.20 | -9.00 |
| 22232 | 12.05 | 11.69 | 11.34 | 10.38 | 7.67 | 0.02 | 0.02 | 0.10 | 0.03 | 0.04 |
| 22865 | 15.40 | 15.03 | 14.48 | 13.60 | 9.86 | 0.02 | 0.05 | 0.05 | -9.00 | -9.00 |
| 22903 | 15.37 | 14.48 | 13.24 | 12.41 | 9.03 | 0.04 | 0.03 | 0.08 | 0.03 | 0.04 |
| 30003 | 13.99 | 13.08 | 12.36 | 11.11 | 8.44 | 0.06 | 0.03 | 0.10 | 0.07 | 0.12 |
| 40150 | 14.39 | 13.73 | 12.98 | 11.91 | 9.14 | 0.03 | 0.04 | 0.04 | 0.07 | 0.06 |
| 40182 | 14.37 | 13.72 | 13.29 | 12.75 | 9.34 | 0.12 | 0.03 | 0.04 | 0.13 | -9.00 |
| 52590 | 16.26 | 15.13 | 14.12 | 13.20 | 6.61 | 0.05 | 0.04 | 0.05 | 0.18 | -9.00 |
| 52648 | 16.84 | 15.61 | 15.08 | 13.76 | 8.47 | 0.04 | 0.07 | 0.09 | 0.17 | -9.00 |
| 54299 | 13.59 | 12.85 | 12.32 | 11.82 | 5.66 | 0.02 | 0.02 | 0.05 | 0.10 | -9.00 |
| 54361 | 10.88 | 9.55 | 9.17 | 8.97 | 5.69 | 0.03 | 0.02 | 0.06 | 0.03 | 0.03 |
| 54362 | 14.25 | 12.87 | 11.87 | 10.91 | 5.12 | 0.07 | 0.08 | 0.05 | 0.04 | 0.03 |
| 54419 | 12.84 | 10.46 | 10.70 | 10.50 | 5.49 | 0.09 | 0.05 | 0.08 | 0.06 | 0.04 |
| 54459 | 14.31 | 12.54 | 11.41 | 10.09 | 4.60 | 0.14 | 0.06 | 0.07 | 0.04 | 0.03 |
| 54460 | 13.52 | 12.08 | 11.04 | 10.16 | 5.32 | 0.04 | 0.06 | 0.07 | 0.04 | 0.03 |
| 55308 | 12.01 | 11.64 | 11.51 | 10.81 | 7.87 | 0.02 | 0.02 | 0.04 | 0.03 | 0.03 |
| 55400 | 15.22 | 14.17 | 13.27 | 12.37 | 8.13 | 0.10 | 0.04 | 0.13 | 0.07 | 0.06 |
| 57025 | 7.10 | 0.04 | ||||||||
| HH-211 | 7.24 | -9.00 | ||||||||
| ID | MIPS | MIPS | SCUBA ccAperture flux derivation same as Table 7. Sources with SCUBA fluxes only in a beam are 95% upperlimits. | Comments/ | ||||
|---|---|---|---|---|---|---|---|---|
| fluxaaAll flux densities are in Janskys. | uncbbSources with uncertainties equal to -9 correspond to upperlimits. | flux | unc | Blend ID | ||||
| 13 | 2.601 | 0.368 | 14.492 | -9.000 | 0.096 | MMP-10 | ||
| 51 | 3.944 | 0.453 | 19.126 | -9.000 | 0.051 | 0.097 | 0.012 | |
| 75 | 5.078 | -9.000 | 0.009 | nebula | ||||
| 234 | 0.110 | |||||||
| 245 | 0.945 | 0.262 | 0.049 | |||||
| 276 | 1.778 | -9.000 | 0.031 | |||||
| 435 | 0.006 | nebula | ||||||
| 622 | 0.014 | nebula | ||||||
| 746 | 0.012 | |||||||
| 904 | 1.144 | -9.000 | 0.037 | |||||
| 1401 | 0.007 | |||||||
| 1517 | Off SCUBA. | |||||||
| 1872 | 9.583 | 0.705 | 61.196 | 2.650 | 0.249 | 0.633 | 0.624 | 1898 |
| 1889 | 0.730 | 0.191 | 14.902 | -9.000 | 0.058 | 0.193 | 0.205 | |
| 1898 | 9.583 | 0.705 | 61.196 | 2.650 | 0.249 | 0.633 | 0.624 | 1872 |
| 1916 | 0.248 | -9.000 | 13.134 | -9.000 | 0.034 | 0.116 | 0.055 | |
| 4011 | 0.110 | |||||||
| 21799 | Off SCUBA. | |||||||
| 22903 | Off SCUBA. | |||||||
| 30003 | 1.292 | -9.000 | 0.186 | |||||
| 40150 | 0.327 | 57025 | ||||||
| 52590 | 0.005 | |||||||
| 52648 | 0.051 | |||||||
| 54361 | 2.320 | 0.337 | 26.142 | -9.000 | 0.218 | 0.671 | 0.653 | 54362 |
| 54362 | 2.002 | 0.330 | 26.142 | -9.000 | 0.218 | 0.671 | 0.653 | 54361 |
| 54419 | 0.452 | 0.207 | 0.042 | |||||
| 54459 | 0.894 | 0.241 | 0.160 | 54460 | ||||
| 54460 | 0.894 | 0.241 | 0.147 | 54459 | ||||
| 55400 | 0.085 | |||||||
| 57025 | 3.428 | 0.426 | 19.839 | 3.508 | 0.408 | 0.985 | 1.201 | 40150 |
| HH211 | 2.854 | 0.388 | 48.655 | 4.803 | 0.618 | 1.695 | 1.617 | |
| ID | (J2000) | (J2000) | Other IDs | Associated | Comments | |
|---|---|---|---|---|---|---|
| (a)(a)Origin of positions (#): (1) Hatchell et al. (2005); (2) Enoch et al. (2006); (3) Kirk et al. (2006); (4) Closed Contour SCUBA, this paper. | (b)(b)Origin of acronyms []: [H]: Hatchell et al. (2005); [Bolo]: Enoch et al. (2006); [K]: Kirk et al. (2006); [SMM]: Walawender et al. (2006) | Protostars | (c)(c)No SCUBA source is evident at the 1.1mm bolometer position; SCUBA flux given should be considered an upperlimit in that aperture. | |||
| MMS-01 | 3:44:43.7 | 32:01:32.3 | 3 | H05-14, Bolo116, | 1898, | Peak on |
| K034471+32015, | 1872, | 1872/1898 | ||||
| SMM-07 | 234 | |||||
| MMS-02 | 3:44:21.4 | 31:59:20.3 | 4 | Bolo113, | 1889 | \sst src. offset N. |
| SMM-14 | ||||||
| MMS-03 | 3:44:12.8 | 32:01:37.0 | 4 | SMM-17 | 51 | No Bolocam src. |
| MMS-04 | 3:44:05.0 | 32:00:27.7 | 2 | Bolo109 | 1916 | SCUBA peak N. |
| MMS-05 | 3:43:56.5 | 32:00:50.0 | 1 | H05-12, Bolo103, | HH-211 | |
| K034393+32008 | ||||||
| SMM-01 | ||||||
| MMS-06 | 3:43:57.2 | 32:03:01.8 | 3 | H05-13, Bolo104, | 57025, | \sst src. |
| K034395+32030, | 40150 | offset SW. | ||||
| IC348-mm, HH-797 | ||||||
| SMM-02 | ||||||
| MMS-07 | 3:43:50.8 | 32:03:24.0 | 1 | H05-15, Bolo102, | 54362, | Peak on 54362. |
| K034383+32034 | 54361 | |||||
| SMM-03 | ||||||
| MMP-01 | 3:45:16.8 | 32:04:46.4 | 4 | Bolo119 | Starless | Near IRAS 03422+3156 |
| MMP-02 | 3:44:56.0 | 32:00:31.3 | 2 | Bolo118 | Starless | No SCUBA pt. src. |
| MMP-03 | 3:44:48.8 | 32:00:29.5 | 2 | H05-25, Bolo117 | Starless | abs. |
| SMM-12 | ||||||
| MMP-04 | 3:44:36.8 | 31:58:49.0 | 1 | H05-19, Bolo115, | Starless | abs. |
| K034460+31587 | ||||||
| SMM-11 | ||||||
| MMP-05 | 3:44:14.1 | 31:57:57.0 | 4 | Bolo111 | Starless | abs. |
| SMM-15 | ||||||
| MMP-06 | 3:44:06.0 | 32:02:14.0 | 4 | H05-22, Bolo110, | Starless | SCUBA peak; |
| K034410+32022 | abs. | |||||
| SMM-09 | ||||||
| MMP-07 | 3:44:05.4 | 32:01:50.0 | 4 | H05-20, Bolo110 | Starless | SCUBA peak; abs. |
| MMP-08 | 3:44:02.8 | 32:02:30.5 | 3 | H05-18, Bolo107, | Starless | SCUBA peak; |
| K034405+32024 | abs. | |||||
| SMM-06 | ||||||
| MMP-09 | 3:44:02.3 | 32:02:48.0 | 1 | H05-21, Bolo107 | Starless | SCUBA peak |
| MMP-10 | 3:44:01.3 | 32:02:00.8 | 3 | H05-16, Bolo106, | Starless | src? |
| K034401+32019 | ||||||
| SMM-05 | ||||||
| MMP-11 | 3:44:02.3 | 32:04:57.3 | 2 | Bolo108 | Starless | No SCUBA pt. src. |
| MMP-12 | 3:43:57.7 | 32:04:01.6 | 3 | H05-17, Bolo105, | Starless | |
| K034395+32040 | ||||||
| SMM-08 | ||||||
| MMP-13 | 3:43:45.6 | 32:01:45.1 | 2 | Bolo101 | Starless | abs. |
| MMP-14 | 3:43:43.7 | 32:02:53.0 | 4 | H05-26, Bolo100, | Starless | SCUBA peak; |
| K034373+32028 | abs. | |||||
| SMM-04 | ||||||
| MMP-15 | 3:43:42.5 | 32:03:23.0 | 1 | H05-24, Bolo100 | Starless | SCUBA peak; abs. |
| MMP-16 | 3:43:38.0 | 32:03:09.0 | 4 | H05-23, Bolo099, | Starless | abs. |
| K034363+32031 | ||||||
| SMM-10 | ||||||
| MMP-17 | 3:44:23.1 | 32:10:01.1 | 4 | Bolo114 | Starless | |
| MMP-18 | 3:44:15.5 | 32:09:13.1 | 4 | Bolo112 | Starless | |
| MMP-19 | 3:43:45.8 | 32:03:10.4 | 3 | Bolo100, | Starless | SCUBA Peak; |
| K34346+32032 | abs. | |||||
| ID | \sst MIPS(a)(a)All \sst flux density upperlimits are given in Jy. Central source fluxes for cores with protostars are given in Table 5. | SCUBA (b)(b)Aperture flux in a 20 or 40 beam on the COMPLETE SCUBA Perseus image. We corrected for the non-uniform nebular emission, which includes a pedestal flux contribution or bowl-outs due to sky chopping, by subtracting a “sky” based on the mode of the pixel values in an annulus from . For comparison the last column labeled “” is the simple sum of the pixels in a aperture without correction for the non-uniform background emission. The conversion from Jy/beam to Jy was . | ||||
|---|---|---|---|---|---|---|
| MMP-01 | 0.0007 | 0.209 | 6.234 | 0.072 | 0.227 | 0.198 |
| MMP-02(c)(c)No SCUBA source is evident at the 1.1mm bolometer position; SCUBA flux given should be considered an upperlimit in that aperture. | 0.0008 | 0.393 | 9.285 | 0.034 | 0.115 | 0.119 |
| MMP-03 | 0.0017 | 0.360 | 17.199 | 0.095 | 0.284 | 0.283 |
| MMP-04 | 0.0009 | 0.162 | 18.773 | 0.107 | 0.287 | 0.303 |
| MMP-05 | 0.0010 | 0.471 | 12.846 | 0.066 | 0.218 | 0.191 |
| MMP-06 | 0.0016 | 1.726 | 23.118 | 0.150 | 0.486 | 0.402 |
| MMP-07 | 0.0020 | 0.783 | 31.037 | 0.119 | 0.399 | 0.361 |
| MMP-08 | 0.0012 | 0.631 | 22.191 | 0.137 | 0.462 | 0.510 |
| MMP-09 | 0.0026 | 0.562 | 22.305 | 0.117 | 0.393 | 0.502 |
| MMP-10 | 0.0190 | 2.326 | 14.492 | 0.164 | 0.536 | 0.592 |
| MMP-11(c)(c)No SCUBA source is evident at the 1.1mm bolometer position; SCUBA flux given should be considered an upperlimit in that aperture. | 0.0328 | 2.251 | 20.301 | 0.042 | 0.158 | 0.131 |
| MMP-12 | 0.0024 | 1.431 | 20.300 | 0.139 | 0.459 | 0.450 |
| MMP-13 | 0.0005 | 0.521 | 17.214 | 0.087 | 0.298 | 0.156 |
| MMP-14 | 0.0010 | 0.424 | 17.826 | 0.092 | 0.291 | 0.382 |
| MMP-15 | 0.0036 | 0.350 | 12.689 | 0.112 | 0.393 | 0.368 |
| MMP-16 | 0.0013 | 0.504 | 23.390 | 0.124 | 0.394 | 0.320 |
| MMP-17 | 0.0300 | 9.158 | 66.411 | 0.050 | 0.164 | 0.165 |
| MMP-18 | 0.0024 | 2.776 | 24.274 | 0.070 | 0.212 | 0.151 |
| MMP-19 | 0.0060 | 0.097 | 0.377 | 0.401 | ||
2.3.2 MIPS survey of dark cloud cores near IC 348
To identify the most embedded protostars we examined our , and MIPS images of our IRAC survey region and cross-correlated our \sst source list with a composite catalog (Table 6) of millimeter (mm) and sub-mm dark cloud cores near to the IC 348 nebula. Our dark core list was cataloged from and contains cross-references to a number of recent mm-wave studies of the Perseus Molecular Cloud; it is similar to but encompasses a larger area than one presented in Walawender et al. (2006). Hatchell et al. (2005) performed a Submillimetre Common-User Bolometer Array (SCUBA, Holland et al., 1999) survey that identified 15 unique dust continuum peaks near the IC 348 nebula, lying mostly in a molecular ridge south of the cluster center. While also surveying the entire Perseus cloud at 1.1mm, Enoch et al. (2006) found 21 compact sources within our \sst survey region. Finally, Kirk et al. (2006) produced a archival based SCUBA mosaic of the entire Perseus cloud for the COMPLETE project and these data are publicly available on their website. For source extraction Kirk et al. used a single conservative threshold for identifying sources and recovered only some of the Hatchell et al. SCUBA sources. Yet all of the Hatchell et al. sources and most of the 1.1mm bolometer objects are clearly detected in the COMPLETE SCUBA images.
Our MIPS observations of these cores were obtained with the camera in scan mode operating at medium scan rate and covering a total area of 30’ by 30’ common to all three detector arrays. The map consisted of 12 scan legs; half-array cross-scan offsets were employed to ensure full sky coverage at and on side “A” of the array. The total effective exposure time per pixel was 80 seconds at , 40 seconds at , and 8 seconds at . The data were reduced and mosaicked using the MIPS instrument team Data Analysis Tool (Gordon et al., 2005). Coaddition and mosaicking of individual frames included applying distortion corrections and cosmic ray rejection. The frames were further processed by applying a time filter on each scan leg in order to ameliorate time-dependent transient effects such as source and stimulator latency and readout-dependent drifts. We used IRAF and the DAOPHOT package to perform point-source photometry; specifically, at , we employed PSF fitting with an empirical PSF with a 5.6” fit radius and 15-22.5” sky annulus. For the data we used aperture photometry with beamsizes of 9” and 30” and sky annuli of 9-20” and 32-56”, respectively. We applied aperture corrections at all wavelengths as derived from STinyTim PSF models (Engelbracht, 2006). No color corrections were applied. Typical measurement uncertainties are at 24 m and 10-20% at 70 and 160 m (though there may be somewhat larger systematic uncertainties at 160 m because of uncorrectable saturation effects). The sensitivity at the latter two channels is limited by the very bright thermal emission from the molecular cloud environs, and varies significantly with spatial position. Only four sources are confidently detected at .
In these 26 IC 348 dark cores we found only two MIPS sources which lacked detections shortward of and, thus, were not already identified as YSOs using . These two MIPS-only sources corresponded to the previously identified driving sources of two outflows traced by Herbig-Haro objects: HH-211 (catalog HH 211) (McCaughrean et al., 1994) and HH-797 (catalog HH 797) (Walawender et al., 2005). The HH-211 source appears only at 70 micron, which is the position we recorded in Table 6. The HH-797 jet was originally detected in molecular hydrogen by McCaughrean et al. (1994) and Eislöffel et al. (2003). Eislöffel et al. discovered the 1.2 mm counterpart to the HH-797 driving source, naming it IC348-mm while Tafalla et al. (2006) identified a strong molecular outflow correlating with the HH objects. The apparent driving source appears first at and corresponds to source #57025 in our numbering system; the position we tabulated corresponds to the source. Both of these sources have been previously characterized as class 0 sources (Eislöffel et al., 2003; Froebrich, 2005)101010The definition of embedded protostars was expanded by Andre et al. (1993) to include so called “class 0” sources, whose original definition included: 1) little or no flux shortward of , 2) a spectral energy distribution peaking in the sub-mm regime and characterized by a single black body temperature, and the somewhat less observable but more physical criteria 3) . Their detection only at appear to support this original definition.. Including these class 0 sources #57025 and HH-211, we tally 20 bright protostellar members of IC 348 as well as 11 fainter candidates.
Five other dark cloud cores contained sources we classified as protostellar based upon their SEDs. These protostars are in systems of 1-3 bright members and we are confident of their association with these cores (also §3.3 and Table 6). Thus, 19 of our composite list of 26 mm sources in our IC 348 \sst region appear to be starless. To permit future SED analysis we tabulated all the relevant photometry for these starless cores. Foremost we derived \sst upperlimits in the three MIPS bandpasses (Table 7). Since not all these sources were photometered in Kirk et al. (2006) we also derived aperture fluxes (or their upper limits) for all 26 cloud cores in the SCUBA mosaic111111A sub-region SCUBA map of the IC 348 region was provided by J. Di Francesco, private communication; it had a pixel resolution of compared to the COMPLETE map.. Given the crowded nature of these sources and the varying background emission, we tabulated SCUBA fluxes at different aperture beamsizes and corrected for the varying nebular emission by subtracting a sky or pedestal value. In general the central positions of these aperture fluxes and upperlimits (and listed in Table 6) come from the better resolution SCUBA data. In some cases the actual closed contour peaks in the SCUBA survey were much better correlated to what appear to be absorption features in the nebulosity or to individual \sst sources than those positions previously published. If the published positions appeared to us to be inaccurate then we used either the location of the closed contour SCUBA peak or the minima of the absorption features.
3. Analysis
3.1. Spatial distribution of members
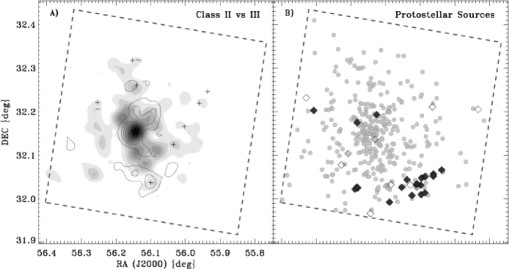
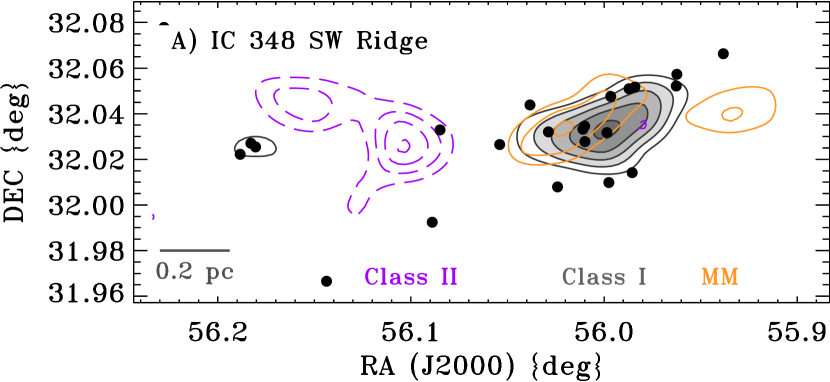
From our \sst census we have identified 42 new class II members of IC 348 and a population of candidate class 0/I protostars of which we are confident in the membership and evolutionary status of . This section explores the spatial distribution of the cluster’s class I, II and III members. Figures 12a compares the surface density maps of all (new and old) class II and III members; these maps were created by convolving the members’ positions with a 0.2 pc box filter . Note, class III source statistics are formally complete only in the region bounded by the Luhman et al. (2003b) survey121212Section 4.1 discusses our incompleteness for class III members in more detail; as described in Appendix C we searched X-ray catalogs for additional class III sources, finding 27. These candidates were included to the class III source list when creating Figure 12a, although their addition or removal have little impact on our subsequent conclusions about the cluster’s structure.. Interestingly, the locations of the class II and class III surface density peaks are essentially identical; we derive the same result when we directly calculated the median spatial centroids for each population131313The median spatial centroids we derived are 03:44:30.053 +32:08:33.86 for class II members and 03:44:32.809 32:09:6.00 for class III; both J2000.. This class II/III surface density peak corresponds approximately to the location of the B5 star HD 281159 (catalog HD~281159) at the center of the nebula and the concentration of members surrounding this peak in Figure 12a represents the centrally condensed IC 348 cluster core (Herbig, 1998; Muench et al., 2003). Using a near-IR survey to derive the surface density distribution toward IC 348, LL95 found that the cluster appeared to be constructed of this core, their IC 348a, and eight smaller sub-clusters. At that time they did not have access to the refined cluster membership provided by subsequent surveys. Overplotting all nine of the LL95 sub-cluster centroids on our membership filtered map reveals that only two, or maybe three of them (a, b and possibly e) represent significant cluster substructure; the rest are apparently background surface density fluctuations likely due to counting statistics and/or patchy line of sight extinction.
On the other hand, Figure 12b reveals that the class 0/I protostars have an entirely different spatial distribution. While there are a few class I sources projected toward the cluster’s class II/III center, most were found at the periphery, wrapping around the cluster from the east to the southwest. While many are widely spaced, a large concentration of IC 348 protostars lies pc S.W. of the nominal cluster center and where there is no corresponding surface density enhancement of class II or III members. Strom’s IC 348 IR source lies near the center of this region, which is also the apex of most of the Herbig-Haro jets found near IC 348, including HH-211, HH-797 and many new jets recently identified by Walawender et al. (2006).
3.2. Comparison of gas, mid-IR dust emission
and young stars
We further examined the spatial distribution of disk bearing IC 348 members (class 0/I/II) by comparing their locations to maps of the dust and gas emission from the associated Perseus molecular cloud. The most useful sets of such dust and gas maps come from the publicly available COMPLETE project, which were published by Ridge et al. (2006). Figure 13a compares the locations of the young stars with disks to the Perseus COMPLETE integrated gas map.
Nearly all the disk bearing members of IC 348 are projected against dense molecular gas. The class II members are more concentrated centrally near a gas filament that stretches from the southwest to the northeast. Even though our survey area is large class II sources are not distributed uniformly; there are few class II members found to the northwest or southeast of this filament (hereafter termed the central filament). Only those LL95 subclusters that are projected against the central filament are confirmed by our analysis of known members (IC 348a, b to the south and perhaps e to the north). Unconfirmed LL95 sub-clusters are located off the central filament and where the reddening of background stars is probably small and patchy. Moreover, the stars in the IC 348a cluster core appear to be associated physically with the central filament. Plotting the of individual members versus declination in Figure 14,
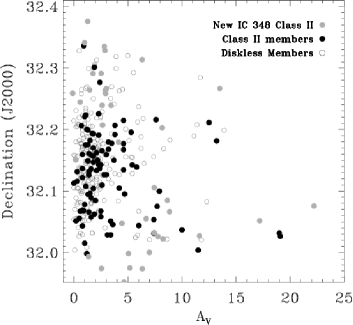
we see that the bulk of the cluster is infront of the central filament and they have fairly constant and low reddennings – . Near the cluster core , however, varies much more, reaching fairly large extinctions and indicating that the cluster’s core remains at least partially embedded in the central filament141414Further evidence for the semi-embedded nature of cluster core is found in the reddened nebulosity surrounding it in the near-IR color image M03 (Figure 1; print edition).. Finally, there is no evidence that class II members avoid the cluster center or prefer the cluster halo as was suggested previously in studies (LL95, M03).
Protostars are projected against, and embedded presumably within another molecular CO filament that stretches west-to-east along the southern edge of the nebula. We term this the southern filament. Note that the integrated CO emission is somewhat misleading in this respect: the apparent 13CO bridge (see Figure 13a) connecting the central and southern filaments is at a completely different (strongly blue-shifted) radial velocity compared to either filament (Borkin et al., 2005); therefo, the central and southern filaments are infact distinct. These distinct filaments, however, share a common radial velocity to within 0.45 km/sec (; Borkin et al., 2005); thus, they are physically related. Further, there is significantly more contrast in the reddenings of foreground and embedded members along this southern filament than in the cluster core. In Figure 14 we find that most members lie in front the southern filament () with small reddenings, but the reddened members very embedded with , ranging up to magnitudes. This segregation of members by might be evidence of distinct cluster populations that orginate in the two distinct gas filaments.
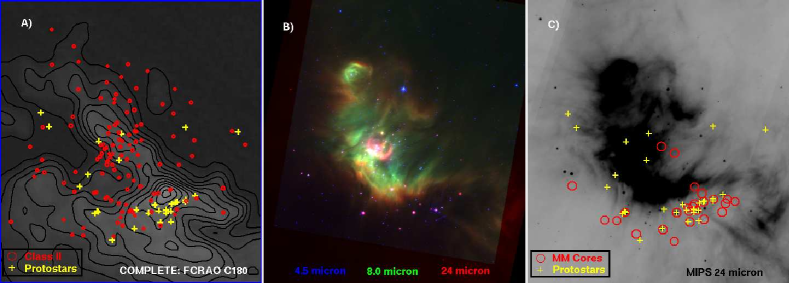
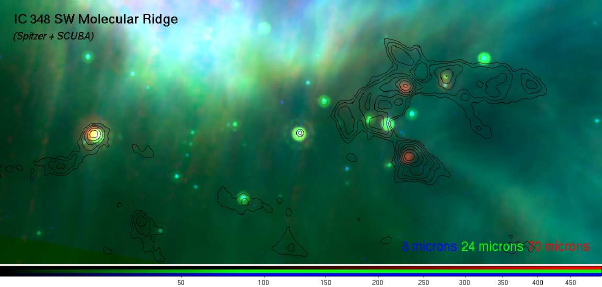
Figure 13b reveals additional details about the IC 348 nebula, using the and images to trace blue (scattered light and/or shocked hydrogen), green (scattered light and/or PAH) and red (24 micron dust emission). The optical portion of the nebula appears here as a blue-green cavity that surrounds the centrally condensed class II/III cluster core, providing more evidence that the central filament lies mostly but not far behind these stars. At the cluster’s periphery, on the other hand, the molecular gas contours in panel (a) are closely mirrored by emission or scattering traced by the \sst 8 and 24µm data in panel (b). Northwest of the cluster center, for example, one can see the way the \sst dust emission traces around the perimeter of a large low density CO clump facing the central B star. We also find that the bright red nearly circular (r=0.13pc) emission micron ring that surrounds the central B5 type binary has corresponding low level (30mJy/beam) SCUBA emission that forms small clumps around this ring. This red ring also correlates with a ring of red near-IR band) dust emission in the color Figure 1 of M03. Unfortunately, SCUBA submm maps do not include another less red r=0.1pc cavity that surrounds a pair of A type stars (#3 & 14) to the NE. In this color image the class I protostars are found in strings of bright red 24 micron sources behind the southern emission wall and in the dark cloud core at the heart of the southern filament.
Comparing Figure 13(a) to panel (c) one can better see how MIPS emission etches out the edges of the southern molecular filament, wrapping around and into a 13CO cavity on the ridge’s southern edge. Many of the bumps and wiggles in the CO gas contours have counterparts in the dust emission and the dark molecular ridge does not appear sharp edged as it would were it a foreground cloud. It is instead enveloped in and therefore immediately adjacent to (and we believe slightly behind) the nebula surrounding the central B star. Panel (c) includes symbols marking the locations of class I protostars and sub/millimeter dark cores (Table 6). While dust emission closely follows the surface of the cloud as traced by molecular line data, the mid-IR dust emission does not closely follow the contours of the SCUBA dust emission. This could be due on the one hand to the spatially chopped nature of the SCUBA data, which acts to remove larger scale and spatially smoother sub-mm emission structures. On the other hand the SCUBA (starless) cores are frequently seen in silhouette as absorption features (§3.3) against low level scattered mid-IR light that permeates this filament. The source of that scattered light is not clear. In projection, two starless cores are seen much closer to the central B star and its clustering, but have neither emission nor absorption features in \sst data; at least one (MMP-18) is associated with an core identified by Tafalla et al. (2006) . They appear to be hidden from the illuminating source of the mid-IR dust emission by the densest part of the central gas filament in which they reside and which reaches a peak reddening of magnitudes in the extinction maps presented in M03.
3.3. The protostars of the southern filament
3.3.1 \sst & SCUBA correlations
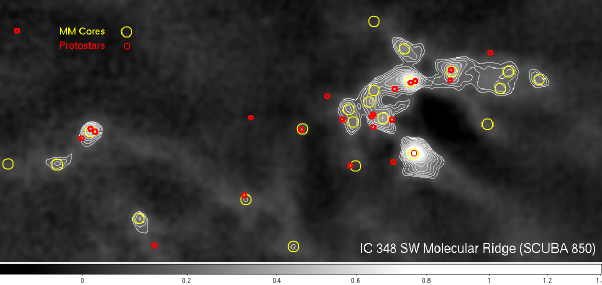
In this section we focus on the southern molecular ridge, containing most of the class 0/I protostellar objects; Figures 15 and 16 compare \sst and SCUBA images of this region. We used a sub-region of the COMPLETE SCUBA Perseus map created by Kirk et al. (2006) to compare the cloud’s dust continuum to our detected mid-IR point sources. In the IC 348 region of the Perseus SCUBA data we measured a mean and rms of 8.6 and 4.8mJy/beam, which were used to plot logarithmically spaced contours starting at 57 mJy/beam . As discussed in the previous section there are a large number of starless SCUBA cores (Table 6) whose contours correspond precisely to dark absorption features. These SCUBA emission/\sst dark cores appear across this protostellar ridge and indicate to us that the registration error for these SCUBA and \sst IC 348 comparisons is no more than 1-2 SCUBA pixels . We conclude similarly that the removal of large-scale structures from the SCUBA map by Kirk et al. has had little affect on the spatial correlations of \sst and SCUBA point sources we discuss below.
In this southern molecular ridge there are 23 identified protostars and a comparable number (22) of MM cores of which 15 are starless. Low level dusty filaments stretch across the region, threading the various star forming sites; there are not, however, spatially distinct regions of star forming versus starless cores. Unlike the spatially anti-correlated distributions of class I and class II sources (Figure 13a), starless and star forming cores are intermingled and the empty SCUBA cores are typically no further from the B star at the cluster center than are the protostars. While in Figure 15 the three strongest 70 micron point sources shine through associated SCUBA core peaks and correspond to class 0 sources, the fact is that most of the protostars are only peripherally associated with SCUBA cores (Figure 16). In all but 6 cases, the closest SCUBA peak is more that 3000 AU from a protostar and we conclude that these cores are neither the original “infalling” envelope nor “common” envelopes encompassing a set of protostars (Looney et al., 2000). The intermingled SCUBA cores are instead probabe sites of future star formation. Moreover, six flat-spectrum protostars appear to be completely disassociated from the dust continuum, having neither SCUBA nor 1.1 mm detections. If the remnant envelopes are small ( AU) or if we are seeing the envelope pole on, the integrated dust continuum might not have enough contrast to be detected in larger beam size of the sub-mm observations151515These sources are reminiscent of and may be similar to those nearby “peculiar” class I Taurus sources detected by but unresolved with single dish 1.3mm data in Motte & André (2001, see also discussion in ()). Whether these non-detections (or those unresolved Taurus detections) rule out the existence of an envelope (so removing the protostellar moniker) can only be firmly determined using observations of the silicate feature at coupled with detailed SED modeling (e.g. Eisner et al., 2005). Indeed such SED modeling by Eisner et al. of one these Motte & André (2001) “peculiar” class I objects, L1489 (catalog LDN 1489), nonetheless prefers a disk+envelope structure; thus, for now we retained the SED based protostellar classification.. It is interesting to note that most of the protostars in or adjacent to SCUBA cores appear in systems of only 1-3 members (at the \sst MIPS resolution limit of AU). Protostars distant from mm cores actually appear essentially solitary (down to separations of AU based on the near-IR data) and are typically separated from other protostars by AU.
3.3.2 Clustering
Following our studies of protostars in Orion (Lada et al., 2000, 2004), we convolved the position of sources in the SW ridge with a box kernel to create surface density maps and to identify and characterize any embedded sub-clusterings of protostars. Unlike Orion where the embedded subclusters have , convolution with kernels less than 0.2 pc produced no significant clumping in the protostellar ridge; the youngest IC 348 sources are much more spread out. Figure 17a displays the surface density maps for class II, class I and MM objects in the ridge convolved using an 0.2 pc kernel. There is an apparent protostellar clustering whose peak coincidentally coincides with Strom’s IR source and reaches , which is more than an order of magnitude lower then we found for the embedded subclusters in the molecular gas behind the Orion nebula. The class I and MM sources are correlated except for a small group of starless cores on the western edge of the ridge. These two sets of sources are, however, anti-correlated with the LL95 IC 348b subcluster of class II sources, which splits the ridge in half and achieves a nearly identical peak surface density. This class II subgroup is obvious in Figure 15 as the central group of bright sources lacking SCUBA emission.
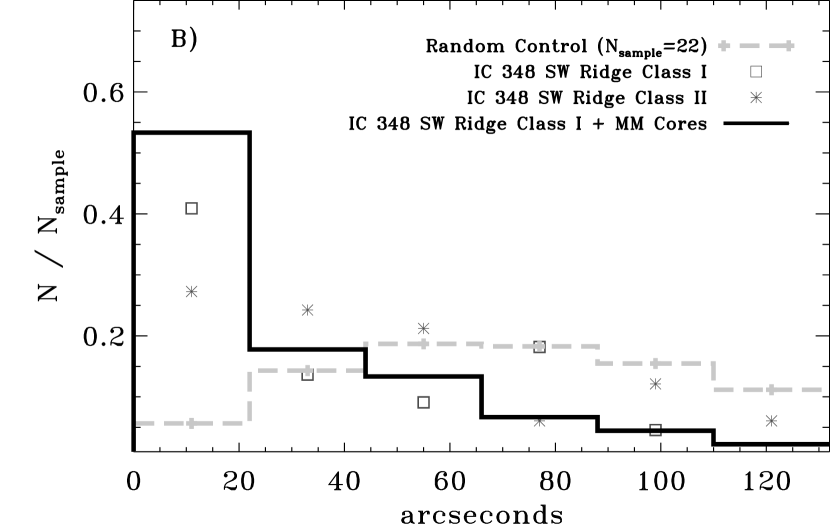
We also applied a nearest neighbor analysis to these ridge sources. Teixeira et al. (2006) examined the nearest neighbor distribution of bright class I sources in the embedded Spokes subcluster of NGC 2264, finding a preferred spacing of or 0.1 pc (d=900pc). A nearest neighbor analysis for the class II, class I and MM cores in the SW ridge reveals no resolved, preferred spacings (Figure 17b) but instead all rise to the resolution limit. Unlike the Spokes, the spacings of protostars are mostly flat except for a peak at or below ; this unresolved peak is sharpened by including starless cores as neighbors to the protostars. Visually inspecting Figures 18(a-c) reveals the nature of this difference with NGC 2264. These small spacings come from a few protostellar systems of 1-3 members with small AU separations, although the majority of the class I sources are essentially solitary and widely spaced. The class II spacing distribution also rises down to the resolution limit.
3.3.3 Near-Infrared Images
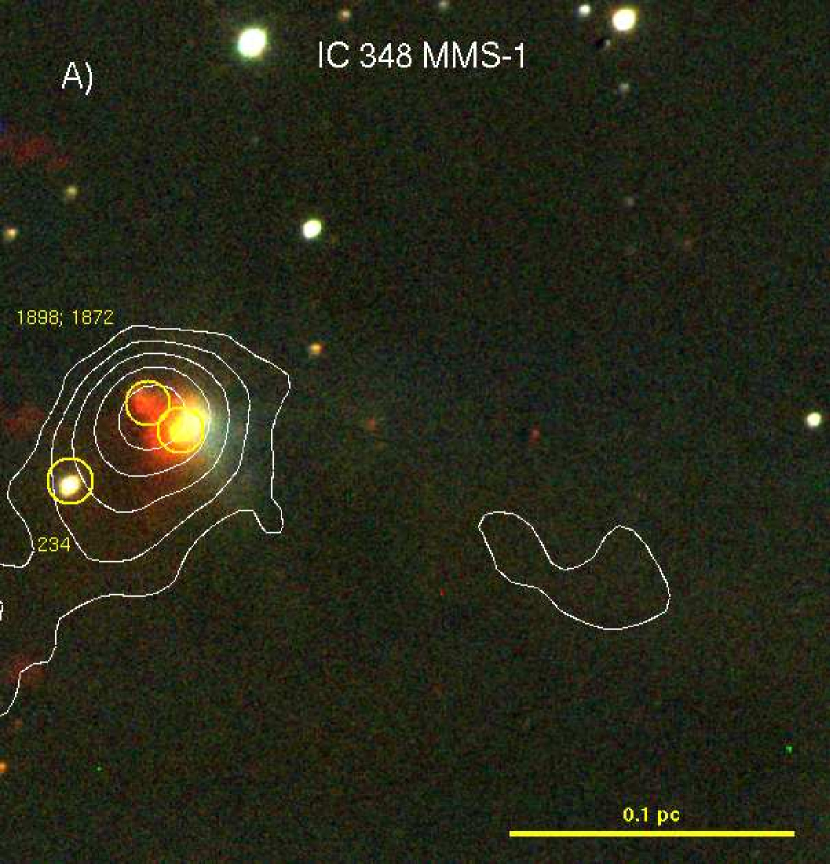
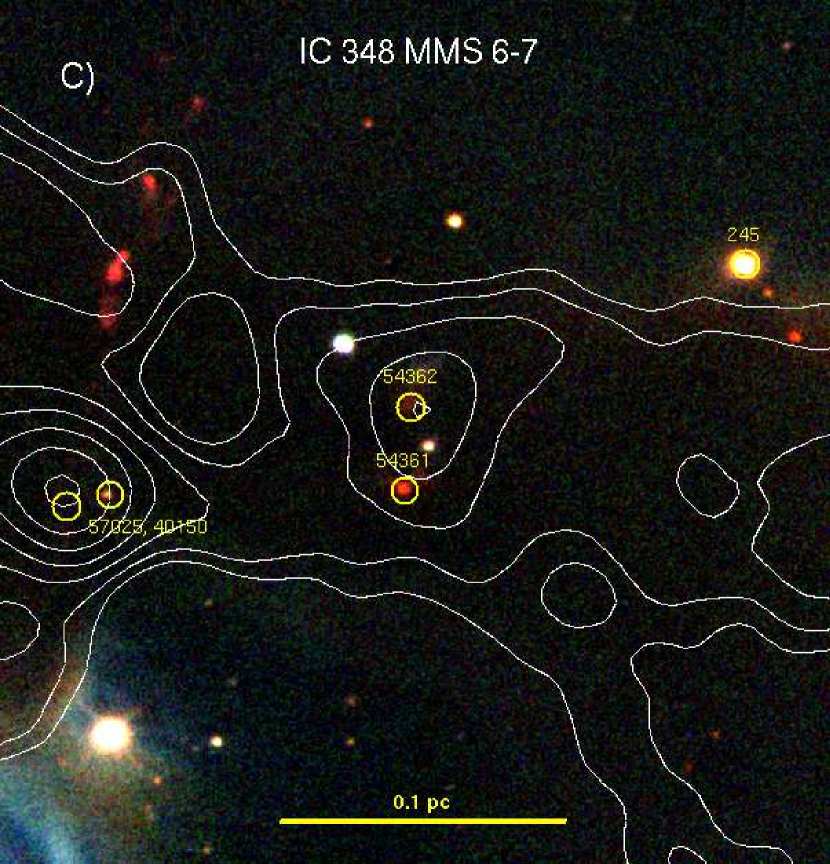
In this section we use deep near-infrared images from M03 to illustrate some of these small 1-3 member protostellar subclusters. Figure 18(a-c) show three closeup views of the protostellar ridge, progressing from east to west. The eastern MMS-1 core, illustrated in Figure 18a, contains three protostars, including the brightest far-IR source in the entire cluster. Although the SCUBA core peaks right between protostars #1898 and #1872, our comparison of the near-IR, \sst and images leads us to conclude that the source (and thus also the source) peaks up on the eastern red band knot (source #1898) rather than on the western protostar, #1872, which is where the source peaks (scrutinize the color version of Figure 15). Source #234 could be either the tertiary member of a hierarchal triple or an entirely separate clump fragment.
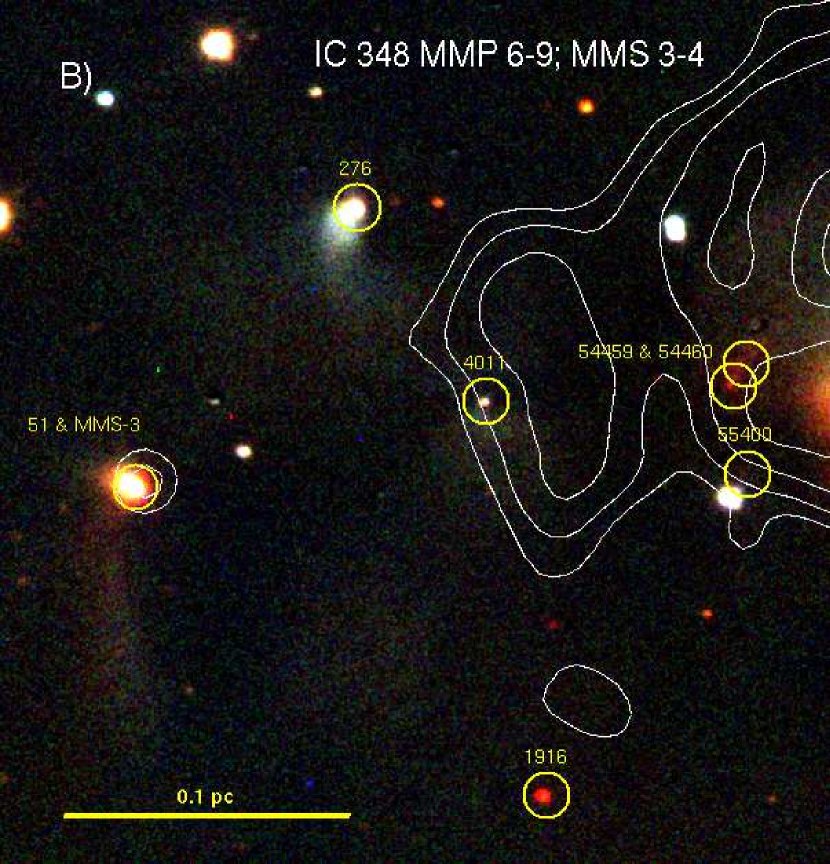
Unlike MMS-1 in Figure 18a, panel (b) shows how most of the protostars are unassociated with individual SCUBA cores. The edge-on source #4011 and the trio of 54459/54460/55400 are simply adjacent to starless SCUBA cores. All of the protostars in Figure 18b are seen in scattered light, including the rather solitary flat spectrum protostars #51 and #276 as the flat spectrum protostar # 245 panel (c). On the other hand, two other very good SCUBA/\sst/near-IR correlations are illustrated in panel (c). The class 0 #57025 and protostar #54362 both appear almost precisely at their respective SCUBA closed contour peaks (within 1000 AU of MMS-6 & MMS-7, respectively). These comparisons reinforce our arguement that most of these SCUBA cores are infact starless.
3.4. Inferred cluster properties
Considering the expanded borders of the IC 348 cluster traced by our \sst census, it is useful to ask how the addition of new cluster members over a large physical scale might have modified global cluster properties such as the median age or stellar initial mass function (IMF). In this section we derived bolometric luminosities for the new and old members and compared them to theoretical isochrones on the Hertzsprung-Russell (HR) diagram to answer this question. In this exercise all the sources were placed on the HR diagram by dereddening a single passband flux, using the derived from SED fitting (see Paper I), and applying a bolometric correction (BC), which is tabulated as a function of effective temperature and taken from our previous studies. Other fixed values or assumptions included a value of , the use of a subgiant spectral type to Teff scale from Luhman (1999), and a distance of 320 pc, which is the value we have assumed in all of our previous studies of IC 348 members. One subclass spectral type uncertainties were assumed and were propagated into the uncertainty, which was the quadratic sum of the photometric error, the fit uncertainty and the variation in BC as a function of . The fit uncertainty dominates the error budget of for each star. We actually derived at all passbands from to and found that these derivations are extremely self-consistent in the near-IR with essentially no variation between derived from the or bands though there was some evidence for band excess producing slightly higher bolometric luminosities (typically, however, dex). Figure 19 presents HR diagrams for sets of members parsed spatially or according to their disk properties.
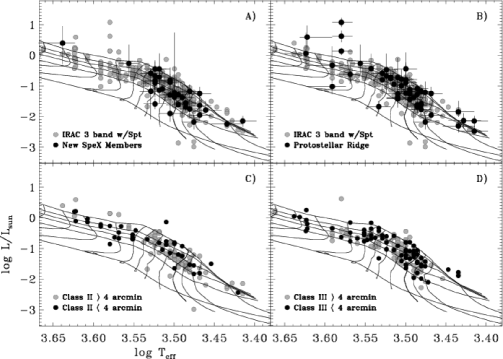
Isochrones and evolutionary sequences were taken from Baraffe et al. (1998)161616No single set of Baraffe et al. models fit the locations of the GG Tau quadruple or the IC 348 locus on the HR diagram (most recently see Luhman et al., 2003b, and references therein). As prescribed previously, we use a mixed set of Baraffe et al. (1998) models with different convective properties for different mass ranges: a mixing length parameter 1/Hp=1 for and 1/Hp=1.9 for . Thus, by design, our set of isochrones will yield a constant inferred mean age as a function of ().. Figure 20 presents the inferred cluster properties based on these HR diagrams and theoretical tracks.
Although they lie preferentially at the edges of previous spectroscopic census, the new, primarily class II sources identified in our \sst census fall in the same basic locations on the HR diagram as previous members (Figure 19a); specifically, they have a very similar spread in at fixed . This spread in at a fixed should represent a range of radii for stars of approximately the same stellar mass and should correspond to the spread in the birth times for contracting pre-main sequence stars. This spread is, however, convolved with a distribution of uncertainties, which in this case we find to be dominated by uncertainties in extinction estimates, and the age of a particular star should be viewed with caution. The ensemble of cluster members ages may yield some clues about the cluster’s star forming history, so we quantified this luminosity (age) spread by counting sources between logarithmically spaced isochrones and plotting them in Figure 20a.
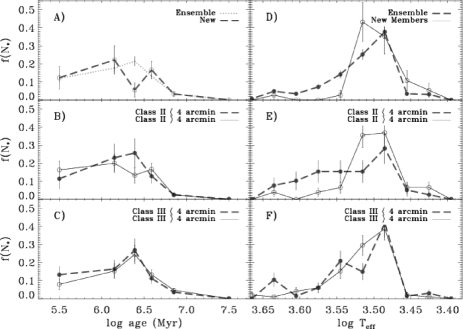
In this way, for example, we can show that the addition of new class II sources does not appear to modify the star forming history inferred previously for IC 348.
A spatially distinct population of protostars spread along the cluster’s periphery clearly suggests that star formation in IC 348 is not necessarily coeval and that the location of star formation may have varied with time across the nebula. We tested the hypothesis of spatial variations in the SFH for IC 348 members by examining radial variations of the cluster loci on the HR diagram (Figures 19cd) and the inferred SFHs (Figure 20bc). Radial variations of the apparent ages of IC 348 members were reported by Herbig (1998) yet our class II \sst survey is spatially complete over a much larger area than his based survey. We divided the population into a core and a halo, which is approximately the same radial distinction used by or discussed in LL95, Herbig (1998) and M03; these two samples correspond to roughly equal proportions of cluster membership ( and , specifically). We find no significant radial differences in the spread of on the HR diagram or in the extracted SFHs of the spatially complete class II populations (Figure 20b); although spatially complete only in the core, we found no radial variation in the class III SFHs (Figure 20c) either. Infact, the class II and class III age distributions are essentially indistinguishable, displaying a peak at 2.5 My and an age spread of 4 My, which we derived using the half dpower points of the cluster ensemble age distribution. Even if star formation were a function of time and location in the nebula, the common heritage of stars inside and outside the cluster core means that the core is either a distinct and long lived star formation site or the merger of many smaller briefer star formation events whose initial spatial distribution no longer appears terribly obvious.
| ID | aaThe best fit from fits and the lower and upper limits from SED fitting. | bbThe derived log luminosity at band derived at the best fit and the lower and upper 1 sigma values; for sources without spectral types, and estimates were derived assuming a K7 spectral type. | SED ParamsccComments include the existence of a absorption feature and whether we agreed with Hatchell et al. (2005) that a distinct SCUBA peak is present. These two criteria frequently agreed. | ||||||||
|---|---|---|---|---|---|---|---|---|---|---|---|
| Sp.T. | (K) | Best Fit | - | + | Best Fit | - | + | ||||
| 1 | B5 | 15400 | 3.1 | 1.0 | 8.7 | 3.230 | 2.778 | 3.787 | -2.638 | 0.102 0.005 | |
| 2 | A2 | 8970 | 3.2 | 1.1 | 8.5 | 2.067 | 1.774 | 2.656 | -1.396 | 0.127 0.009 | |
| 3 | A0 | 9520 | 3.9 | 3.0 | 4.7 | 2.073 | 1.708 | 2.329 | -2.794 | 0.110 0.000 | |
| 4 | F0 | 7200 | 2.3 | 1.0 | 7.3 | 1.614 | 1.435 | 2.168 | -2.786 | 0.091 0.004 | |
| 5 | G8 | 5520 | 7.7 | 5.5 | 9.9 | 1.306 | 1.045 | 1.556 | -1.389 | 0.160 0.014 | |
| 6 | G3 | 5830 | 3.5 | 1.9 | 7.4 | 1.209 | 1.010 | 1.645 | -1.972 | 0.079 0.011 | |
| 7 | A0 | 9520 | 1.7 | 0.0 | 8.1 | 1.642 | 1.235 | 2.383 | -2.788 | 0.071 0.009 | |
| 8 | A2 | 8970 | 1.6 | 0.0 | 8.0 | 1.509 | 1.272 | 2.234 | -2.532 | 0.101 0.008 | |
| 9 | G8 | 5520 | 5.3 | 3.7 | 7.7 | 1.032 | 0.839 | 1.304 | -2.894 | 0.134 0.012 | |
| 10 | F2 | 6890 | 2.1 | 0.8 | 7.0 | 1.153 | 0.976 | 1.705 | -2.827 | 0.054 0.057 | |
Although our new members are preferentially cool stars and thus low mass ; Figures 20ad) this does not appear to be the result of a bias in our survey. It is instead a consequence of the IMF, which peaks in IC 348 for low mass stars (Luhman et al., 2003b; Muench et al., 2003) coupled with an apparent radial variation in this mass function which skews to lower mass stars at large radii where most of our new class II sources are found. Besides the unclassifiable protostars we found only 1 new early type class II K star (#1933); the solar mass members at larger radii are either already included in our census and/or perhaps diskless. We found that the spatially complete class II population of IC 348 displays a modest radial variation in the distribution of effective temperatures, which we use as a proxy for mass. The hotter, higher mass sources are more concentrated in the cluster’s core and cooler lower mass stars prefer the cluster halo (Figure 20b). This result using the HR diagram supports the luminosity function analysis of M03 which first identified radial MF variations in this cluster. Further, the M03 IMF analysis is not biased for or against the presence of disk excess so that despite the inconclusive HR diagram results for the spatially incomplete class III population (Figure 20c) we conclude that this MF radial skew is real.
4. Discussion
4.1. Total young star population of the IC 348 nebula
We have added a substantial contingent of new young stars to the membership of IC 348, bringing the total known membership to 363 sources. This is larger than anticipated statistically by Cambrésy et al. (2006) using 2MASS all sky data. We now perform an estimate of the total young star population in IC 348, accounting statistically for undocumented class III members not identified using our disk based criteria. We first use the ratio of class II to class III sources in the Luhman et al. (2003b) completeness region (70 / 186 = 0.38) to extrapolate from our class II census. We find 90 class II members within the radius of the Muench et al. (2003) survey and, thus, we estimate there should be a population of 227 class III sources or a total population estimate of 327 members in a pc region. Although this is consistent with but slightly larger than the members estimated by Muench et al. using a luminosity function analysis, it suggests that about 30 more class III members remain unconfirmed in this pc portion of the IC 348 nebula.
Probably the most efficient way to find the 30 predicted class III sources would be to employ deep X-ray surveys; unfortunately, existing X-ray surveys are much smaller than our \sst survey, and only roughly cover the M03 region. They also miss most of the protostellar ridge. A second means to identify young stars is by monitoring for periodic (variable) stars over large cluster areas. Combining archived X-ray data and recent literature results (e.g. Cieza & Baliber, 2006) for these two techniques (see Appendix C), we cataloged 27 class III candidates of which 17 fall within the M03 + Xray portion of our \sst survey region. Considering that both of these techniques have their own (different) completeness limits (less than 1/3rd of the confirmed IC 348 members are periodic while 2/3rds are detected in X-rays) these 17 class III candidates confirm our prediction of 30 missing class III members as accurate. Wider field X-ray surveys are clearly warranted, especially to elucidate the radial MF variation we observe for the class II members.
On the larger 2.5pc spatial scale of our \sst survey, we conclude that the known class II members suggest a total population size perhaps as large as IC 348 sources. This assumes that the ratio of class II/III members does not vary much over the survey area. Thus, we predict approximately 60 class III sources remain either unidentified or lacking spectroscopic follow up within the immediate vicinity of IC 348. In total our findings (confirmed or extrapolated) represent a substantial (30%) increase to the traditional population estimate of sources for IC 348 (Lada & Lada, 1995; Muench et al., 2003; Lada & Lada, 2003). It is, however, unclear where the boundaries of this cluster are and thus where we should stop looking for missing members. The 2MASS surface density excess identified by Cambrésy et al. (2006) extends beyond the borders of our \sst survey (but appears to underestimate its membership); from a cursory analysis of archival \sst data171717Wider field \sst data of the IC 348 nebula was obtained by an \sst Legacy Science project entitled “Cores to Disks,” (Evans et al., 2003); the IRAC data was analyzed in Jørgensen et al. (2006). We downloaded the fluxes from their third incremental release which were posted on a web site (http://data.spitzer.caltech.edu/popular/c2d/20051220enhancedv1/). We then applied our selection criteria to find additional candidates. Unfortunately, the boundaries of the c2d IRAC survey are irregular and one could not simply expand our study to larger cluster radii. it is quite clear that not far from IC 348 there are small aggregates of young stars, including those around Lk 330 to the NE and around MSX6C G160.2784-18.4216 (Kraemer et al., 2003; Cambrésy et al., 2006) to the SE, which may or may not be associated with the star formation we observe within the nebula. Even if we were to include all these groups and account for subsequent generations of stars yet to form in the protostellar ridge it is clear that in a physically similar volume of space, the IC 348 nebula will produce about an order of magnitude fewer stars than the Orion nebula.
4.2. Physical structure of the IC 348 star cluster
Our \sst census of the IC 348 nebula has revealed a couple of new facts about the structure of the associated embedded star cluster, which we discuss briefly in this section. First, our analysis of the composite spectral energy distributions of probable cluster members confirms that a population of embedded sources along the nebula’s southern edge are infact class 0/I protostars, as suggested by previous observations of jets and outflows (Tafalla et al., 2006; Walawender et al., 2006). The protostars follow a ridge of molecular material, are characterized by low spatial surface densities, and are anti-correlated spatially with the cluster’s much more centrally condensed class II and class III population. On the other hand these protostars are correlated spatially with a population of millimeter cores, which we find however to be mostly starless using our \sst data.
Our analysis of protostars in Trapezium cluster using ground based data found somewhat similar results: the youngest stars are distributed into an elongated ridge following the densest molecular gas. The youngest Trapezium members appear segregated in subclusters with radii of pc, populations of 10-20+ members (Lada et al., 2004; Grosso et al., 2005). We find something rather different in IC 348 where the protostars are less clustered and have surface densities at least one order of magnitude lower than in Orion ( in IC 348 as opposed to the we found behind the Trapezium (Lada et al., 2004) ). Moreover, the IC 348 nebula is sufficiently nearby that we can resolve individual protostellar cluster members in our \sst data and possibly identify the smallest fragmentation scale, which nonetheless appears unresolved . This is in contrast, for example, to the Spokes embedded cluster in NGC 2264, where the bright MIPS sources are spaced by 0.1pc yet appear mostly singular in the \sst data (Teixeira et al., 2006). It is possible that higher resolution data will find that the singular Spokes sources will break up into multiples or even small clusters (Young et al., 2006), but it will be interesting to learn whether their protostellar object densities will approach those we find in Orion or are more similar to those we discuss here in IC 348.
We also found that the cluster in the IC 348 nebula is more simply structured than previously thought. Using the expanded cluster boundaries provided by our \sst census, we found that the spatial surface density of confirmed members is fairly smooth and that most of the substructure previously reported in IC 348 is not apparently significant. Only those substructures which appear correlated with molecular gas appear to be clusterings of actual members. To further examine the structure of the IC 348 cluster, we calculated the (spherically symmetric) radial surface density profile of confirmed IC 348 members. The cluster’s surface density drops off smoothly as out to a radius of 1pc, which means the space density of stars goes as . This means that the apparent flattening of the radial profile for seen by Herbig (1998) and M03 was the result of variable background contamination, which was also the likely cause for the insignificant sub-clusterings found by LL95.
4.3. History of star formation in the IC 348 nebula
Our wide field \sst census permits us to reconstruct a more complete history of star formation in the IC 348 nebula. Foremost, we found spatially correlated and nearly equal sized populations of class 0/I protostars and starless MM sources in a filamentary ridge that is 1pc from the central B star and lying behind the nebula’s apparent edge. This finding clearly indicates that star formation in the nebula is not finished but is infact ongoing. As pointed out by Hatchell et al. (2005) the large concentration (relative to the entire Perseus cloud) of MM cores near IC 348 is infact consistent with a present day star formation rate equivalent to that which built the older central cluster, assuming that each core will eventually produce 1-3 stars. That our \sst data indicate that the majority of these cores appear starless suggests star formation can continue at this rate into the near future.
Figure 21a plots the histogram of inferred ages from the HR diagram, and at first glance the SFH for the cluster ensemble is quite broad and suggests a peak at around 2.5 My with perhaps a decline to the present. The interpretation of such a “peak” depends upon the accurate counting of the population of embedded protostars, which could not be included into previous studies of cluster age spreads (e.g. Palla & Stahler, 2000) as they lacked the deep mid-IR data provided by \sst 181818Lada et al. (2000) used the statistics of protostellar candidates detected at in the Trapezium core of the Orion Nebula Cluster to draw a similar conclusion about the quite vigorous present day star formation rate in that nebula.. Even if the protostars in the SW ridge were long lived (as postulated in White et al., 2006, for class I), the star formation rate in the southern molecular ridge is increasing and approaching , which already exceeds the average star formation rate in the cluster halo (Figure 21). The sum of the SFH for the cluster ensemble and the protostellar ridge confirms essentially a constant star formation rate of over the past 5 My.
Attempts to further quantify of the duration of star formation in IC 348 are very difficult. Besides intrinsic differences in birth times, the observed luminosity spread is inflated by the propagated uncertainties in the derivation of (Kenyon & Hartmann, 1990; Hartmann, 2001). On one hand we have the fact that extremely “old” members on the HR diagram could be the result of gross underestimates of the intervening extinction caused perhaps by the sources being seen edge-on. On the other hand, the existence of a real luminosity spread on the HR diagram (or color-magnitude diagram) is fairly clear evidence for the stars having a range of radii and thus a range of contraction ages independent of systematic uncertainties in the theoretical tracks used to interpret them. From the vs color-magnitude diagram Herbig (1998) argued that star formation in the IC 348 nebula was not coeval. Instead Herbig found the spread of star formation ages in IC 348 was of order 5 My, which is larger than the members’ median age. Using members drawn from a much larger survey covering the entire nebula we come the same conclusion: if we conservatively ignore the tails of the observed SFH and use the half power points in our derived age distribution functions (Figure 21; cluster ensemble) as the age spread we find that non-negligible star formation began at least 4 My ago. Put another way, if we ignore structure in the SFH and infer a constant star formation rate to the present, the derivation of a median age of 2.5 My, implies a star formation duration of My. Again, the presence of primarily starless mm cores suggests this duration will continue to lengthen. Note, if we were to assume that the IC 348 nebula were closer (250 pc; Scholz et al., 1999; Belikov et al., 2002) then the inferred median age and duration of star formation (using the half power points of the SFH) would increase by roughly My and My, respectively.
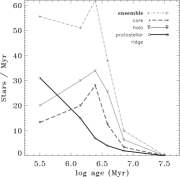
4.4. The origin & evolution of the IC 348 star cluster
Using the structure and star forming history derived from our \sst census, we can address a few questions about the origin and evolution of the IC 348 star cluster. Foremost, we observe a difference between the structure of the more populous, centrally condensed and somewhat older cluster and the filamentary ridge of likely younger protostars. As already discussed, there is evidence that the youngest stars in other regions, such as Orion (Lada et al., 2004) and the Spokes cluster in NGC 2264 (Teixeira et al., 2006), are also arranged in small subclusters along a filamentary structure. Scally & Clarke (2002) used numerical simulations of the cluster in the Orion Nebula to show that despite the youth of that cluster its current structure could be explained by the merger and evaporation of many very small subclusters similar perhaps to the protostellar ridge in IC 348. Thus, it is possible that the centrally condensed, older cluster looks different from the protostellar ridge because of significant dynamical evolution due to stellar interactions. We can examine such a hypothesis by deriving the relevant timescales for dynamical evolution to act upon the stars in the IC 348 nebula.
Consider the central cluster of members in the IC 348 nebula: within a roughly 1pc radius region there is a total stellar mass of . Were this cluster virialized (by its own stellar mass excluding the natal cloud) it would have a 3 dimensional velocity dispersion of 0.86 km/sec. Assuming a star forming efficiency (SFE) less than unity increases this value; for example, a SFE of , would increase the isotropic virial by a factor of 2. Rewriting the cluster crossing time, (Binney & Tremaine, 1987), as
we find the central cluster has maximum My, assuming . The relatively simple radial profile we find for central cluster members and the lack of substructure outside of the molecular cloud are consistent with the conclusion that the IC 348 cluster is at least one crossing time old (Tan et al., 2006). Indeed, our somewhat conservative estimate for the duration of star formation in the nebula (3-5 My) suggests that the central cluster is at minimum 3-5 crossing times old. For systems older than one crossing time, stellar interactions are important and, subsequently after one relaxation time,
they will undergo a change in their velocity of order their velocity; this is also the equipartition time for a system (Binney & Tremaine, 1987). For the central cluster in the IC 348 nebula the relaxation time corresponds to about five crossing times, which is of order the duration of star formation in the nebula. We note (again) that reasonable changes to any of these assumptions, e.g. the cluster were initially smaller or had an SFE , would only increase the dynamical age of IC 348 as expressed in crossing (or relaxation) times. Thus, we safely conclude the stars in the nebula have had enough time to undergo an initial relaxation. We believe that the mass segregation we observe is thus the product of the equipartition of energy during these dynamical encounters and is not primordial. Put another way which is independent of whether or not the cluster is relaxed, if there were primordial mass segregation then its precise functional form has likely been erased since the cluster is more than a few crossing times old.
Given that sufficient time has passed for the central cluster to undergo dynamical evolution we find it difficult to differentiate between two viable models for this cluster’s origin. The current cluster configuration (centrally condensed, smooth radial profile, lack of subclusters) could be the byproduct of the infall and dissolution of stars or small subclusters that formed in filamentary cloud structures, similar to the protocluster ridge. The fact that protostellar populations are often observed to be aligned in filamentary structures, including, for examples, the Spokes cluster in NGC 2264 and the embedded subclusters behind the Trapezium in Orion, lends support to this hypothesis. Yet to build up the IC 348 cluster in 3-5 My requires an (constant) infall rate (in stars) of about per My; there is infact evidence for infall of gas onto the central cluster (see below). In an alternative model the cluster forms from in single, massive core and the protostellar ridge is a subsequent but separate star forming event. In this latter case, for example, we could be observing a process of sequential star formation in which the nebula’s expansion, induced by the presence of the newly formed cluster, swept up the ridge and triggered a second generation or new burst of star formation within it.
A more detailed comparison of the radial velocities of the stars and gas could provide some clarity. Stellar radial velocities are, unfortunately, known for only of the cluster members (Nordhagen et al., 2006, very recently published and heliocentric radial velocities for 27 stars). These measurements, which have a typical uncertainty of 3 km/sec, yield a median heliocentric radial velocity of 16.5 km/sec for the stars. This converts to 10 km/sec in the local standard of rest, with a range from 8 to 12 km/sec. No radial velocities are known for the protostars but the southern molecular filament that appears to surround the protostars is blue-shifted relative to the cluster stars ( km/sec). On the one hand the blue velocity shift of the southern filament relative to the stars is consistent with it being swept up (and pushed outward) by the nebula. Since these relative radial velocities are of order the escape speed at the distance of the protostellar ridge ( or km/sec assuming the star cluster’s potential can be treated as that of a uniform sphere of mass ) the protostars may escape. On the other hand the relative radial velocities of the stars and the gas provide evidence for continued global infall of gas onto the cluster stars: the central filament, which lies behind the cluster stars, also has a radial velocity of -2 km/sec in the rest frame of the stars and this gas is therefore colliding with or falling in toward the cluster. Perhaps a future study combining additional, higher precision stellar radial velocities and a more detailed map of the gravitational potential well created by the star cluster and the molecular gas will provide an origin and fate for the youngest members of the nebula.
There are a few additional conclusions we can draw about the IC 348 nebula and its members. First, class II and III sources have the same median “age” and the same luminosity spread on the HR diagram. This means that external to the protostellar ridge, disked and diskless stars are in general co-spatial and “coeval;” there is absolutely no evidence that the halo represents generations of stars which formed before (e.g. Herbig, 1998) or more recently (e.g. Tafalla et al., 2006) than the cluster core. Put another way, we have no information from the spatial distribution of disked and non-disked sources (outside the ridge) to indicate when or where they were created. Interestingly, a uniform spatial and temporal distribution of class II and III sources suggests that there is a wide dispersion in the timescale for (inner) disk evolution, regardless of the stars’ initial configurations. We can state this same point another way and suggest that since the age spread in IC 348 is of order the disk dissipation timescale as derived from young clusters with a range of median ages (Haisch et al., 2001), the dispersion observed in such a correlation is probably real instead of a byproduct of uncertainties in age or disk excess measurement. This uniform spatial and temporal mixing of class II and III members also affirms the notion that accretion does not significantly alter the locations of the stars on the HR diagram.
5. Conclusions
Using sensitive \sst mid-IR observations we have performed a census of disk-bearing members of the IC 348 young cluster in Perseus, including class II T-Tauri stars and embedded class 0/I protostars. Using spectral indices indicative of excess mid-infrared emission, we identified and scrutinized roughly 200 candidate YSOs about which we can draw the following conclusions:
- 1)
-
There are a total of 118 class II members within a 2.5 pc region in and around the IC 348 nebula. Using extensive existing and new spectroscopy we determine that 118 of 136 candidate class II sources are actual members, indicating that the spectral diagnostic, , is fairly robust for identifying class II stars.
- 2)
-
We catalog a population of 31 protostars, of which are high quality candidates (confirmed via other source characteristics such as spectra). Three appear likely to be in the youngest class 0 phase. The catalog of protostars includes 11 faint class I candidates though this faint sample still appears contaminated by background sources which are unassociated with the molecular gas cloud. Some of these protostars have been previously associated with Herbig-Haro jets and molecular outflows, but lacked an SED analysis appropriate to their classification. Using SED diagnostics to identify class I members was much less effective than for finding class II YSOs; more than half of the initial sample of SED selected class I candidates were eliminated as non-member background contaminants with strong PAH emission features suggestive of extragalactic sources. Reconnaissance spectroscopy of very faint class I candidates reveal only interlopers which are probably all background galaxies.
- 3)
-
The size of the class II population suggests a total cluster size of approximately 420 members, which includes a prediction of 60 new class III members that were not uncovered by our \sst survey. This estimate is reinforced by a search of archival X-ray data that covers a much smaller area than our \sst data but that nonetheless allow us to identify candidates corresponding to about half of these predicted members (also, Appendix C). Comparing various techniques for finding young stars in IC 348, we find that disk excess surveys were successful at identifying approximately 1/3rd of the population, which is similar to the fraction of members that are periodic photometric variables. On the other hand, 60-80% of the known population are detected in X-rays.
We further analyzed the properties of the YSOs we identified in the IC 348 nebula, including plotting their spatial distributions, deriving their clustering properties and estimating their physical properties by placing them on the HR diagram. From this analysis we draw the following conclusions about star formation in the IC 348 nebula:
- 1)
-
Protostars and class II/III YSOs are spatially anti-correlated, with protostars restricted to a narrow filamentary ridge 1pc SW of the exposed cluster’s core. The existence of this protostellar ridge illustrates the need for \sst surveys to identify securely a cluster’s protostellar population before conclusions are drawn about that young cluster’s structure or star forming history.
- 2)
-
The stars forming in this protostellar ridge are characterized by a lower spatial surface density than either the central cluster core or those protostellar subclusters found in Orion; they also display no preferred resolved spacings which could trace the fragmentation scale of the dense molecular gas in the region. A few small pairs or triples trace the highest order of multiplicity in the region but most protostars appear essentially solitary (down to AU).
- 3)
-
The structure of the central cluster is much simpler than previously supposed. Using confirmed cluster members we found that we do not recover most of the small sub-clusterings previously reported in the halo of the central cluster. Instead the central cluster displays a smooth radial surface density profile out to a radius of 1 pc. That the exposed cluster shows little substructure indicates that nebula is more than a crossing time old (Tan et al., 2006).
- 3)
-
The star forming history of the IC 348 nebula is consistent with essentially constant star formation over the past 2.5- 5 Myr. The star formation rate in the southern molecular ridge is roughly the same as that spatially averaged rate which formed the foreground cluster, and an ensemble of starless mm cores mixed with the protostars indicates star formation will continue at a similar rate in the SW ridge into the near future (Hatchell et al., 2005).
Star formation in the vicinity of the IC 348 nebula has been relatively long lived, corresponding to at least a few cluster crossing times. The cluster is also relaxed as evidenced by the segregation of low mass members to the cluster halo, which was reported previously by M03 but is confirmed here using the HR diagram. On the one hand this relatively long duration of star formation means that we cannot determine a precise origin for the central cluster based simply on its structure; such information about its primordial structure appears to have been erased. On the other hand, because the youngest protostars in IC 348 have a filamentary distribution and this distribution matches what is observed in other embedded clusters, e.g. the Orion and Spokes clusters, we tend to favor a model where the central cluster was built from members that formed in filaments or perhaps small subclusters and that have since fallen into the central cluster’s potential well. The relative radial velocities of the stars and gas in IC 348 are infact consistent with global infall of molecular gas onto the cluster. In summary, we believe that what we have observed in the protostellar ridge 1pc SW of the central IC 348 cluster represents the primordial building blocks for young embedded clusters.
Finally, the argument that star formation is “fast,” i.e., beginning rapidly after parts of an initially turbulent cloud passes some critical gravitational threshold, should not preclude the idea that star formation may also be long lived. Until either the natal gas reservoir is depleted, resulting in a relatively high star formation efficiency, or the infall of gas and new stars is disrupted by an ionizing member, star formation continues. Clearly, neither circumstance has yet been reached for the IC 348 nebula. As star formation in the IC 348 nebula does not appear destined to soon cease, a fairly long period of star formation in a fairly small volume of space should be considered when examining numerical renditions of cloud collapse or the dynamics of young stars.
Appendix A Extinction effects on
We explored the influence of dust extinction on our preferred spectral index, . Using a diskless K0 IC 348 member from Paper I (Table 3) as a template, we reddened the observed photosphere by extinctions as large as using the reddening law from Indebetouw et al. (2005). Ten of these reddened SEDs are shown for illustration in Figure 22a with passbands from to MIPS micron included.
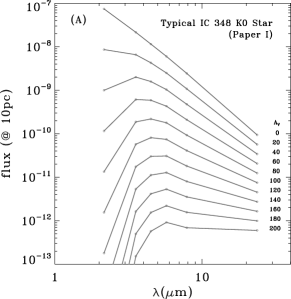
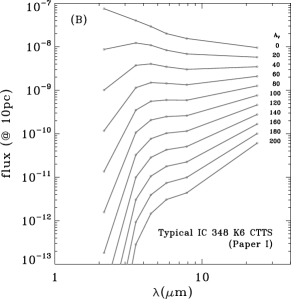

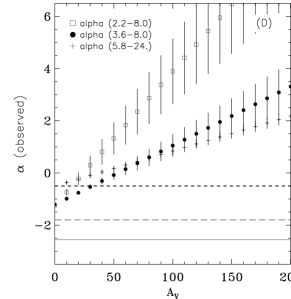
While the IRAC slope of the SED requires to inflect to a positive slope, the slope of the SED is inflected by . Note that even for the SED slope of background stars remains negative. Since such large column densities within typical molecular clouds occur only in regions very close to embedded YSOs, this SED slope proves that background sources with normal Raleigh-jeans SEDs cannot mimic class I sources except if they were seen through the protostellar envelope of a class I source.
Figure 22b plots the explicit dependence of on , from which we can derive the reddening law for these spectral indices. We calculate the index for the IRAC, IRAC and portions of the SED, plotting them versus fit quality to demonstrate the degree of departure from a true power-law as a function of . These yield the relationships given in Table 9 and used in Figure 1.
We repeated this experiment with empirical SEDs for thick disk classical T-Tauri stars in IC 348 (Figure 22ab). Reddening the median observed SED of K6-M0 IC 348 member (Paper I, Table 3), we find that cause both the \sst based SED indices to inflect. Actually, for the index becomes steeper than the slope, a result that would rarely occur for background field stars. In principle, background stars could be differentiated from cluster members by a rising slope coupled with a negative slope. Again, indices using , which include those indices calculated by Jørgensen et al. (2006), are very sensitive to extinction causing source classifications including that band to become degenerate for . A fixed value of , for example, could correspond either to a typical class II YSO or to an extremely heavily reddened diskless star. However, the IRAC SEDs of heavily reddened diskless stars are distinct from those of typical Class II star+disk sources: the power-law IRAC SEDs of class II objects are intrinsically shallow but heavily reddened diskless stars are bent downward at 2-5 micron; their poor power-law SED fits should distinguish them as being diskless. Finally, we see that characteristic dip at , often seen in the SEDs of embedded YSOs (see Figure 7) can be produced by large reddenings of normal cTTs. Such a dip does not necessitate particular envelope geometries, although the observation of such large column densities may only be possible through an envelope (Myers et al., 1987).
| SED Range | |
|---|---|
| 0.0514 | |
| 0.0226 | |
| 0.0134 |
Appendix B Spectroscopy of new members
B.1. Infrared Spectra
We selected for spectroscopy objects in the IRAC images that display IRAC SEDs indicative of disk excess, are sufficiently bright for the spectrometer employed (), and have not been previously classified as field stars or cluster members. A resulting sample of 39 candidate cluster members with spectroscopic confirmation is provided in Table 1. We also observed a sample of 36 known late-type members of IC 348 and Taurus (Briceño et al., 1998, 2002; Luhman et al., 1998a, 2003a, 2003b; Luhman, 1999, 2004), which are listed in Figures 23-26. These optically-classified objects will be used as the standards during the classification of the candidates in §B.2. These data were collected with the spectrometer SpeX (Rayner et al., 2003) at the NASA Infrared Telescope Facility (IRTF) on the nights of 2004 November 11-13 and 2005 December 12-14. The instrument was operated in the prism mode with a slit, producing a wavelength coverage of 0.8-2.5 µm and a resolution of . The spectra were reduced with the Spextool package (Cushing et al., 2004), which included a correction for telluric absorption (Vacca et al., 2003).
B.2. Classification
To measure spectral types for the candidate members of IC 348 that we observed spectroscopically in §B.1, we used the absorption bands of VO and TiO ( µm) and H2O ( µm). These bands are the primary spectral classification diagnostics for late-type objects (Kirkpatrick et al., 1991; Leggett et al., 2001; Reid et al., 2001) and are broad enough to be easily detected at the low resolution of our data. Because near-IR H2O absorption bands are stronger in young objects than in field dwarfs at a given optical spectral type (Luhman & Rieke, 1999; Lucas et al., 2001; McGovern et al., 2004), spectral types of young objects derived from H2O with dwarf standards will be systematically too late. Instead, to arrive at accurate spectral types, optically-classified young objects rather than dwarfs should be used when measuring spectral types of young sources from steam (Luhman & Rieke, 1999; Luhman et al., 2003b), which is the approach we adopted in our classification of the candidates in IC 348.
To facilitate the comparison of the band depths between the candidates and the optically-classified known members, we have dereddened the spectra to the same slope as measured by the ratios of fluxes at 1.32 and 1.68 µm. These dereddened spectra are not meant to be precise estimates of the intrinsic, unreddened appearance of these stars since the slopes likely vary with spectral type. As shown in Figures 23-26, we first arranged the dereddened spectra of the previously known, optically-classified members of IC 348 and Taurus in order of the strengths of their molecular absorption features. With a few minor exceptions, the IR features change monotonically with optical type. We then measured a spectral type for each candidate by visually comparing the absorption features in its spectrum to those in the data of the optically-classified objects. Through this analysis, we found that 34 of the 39 candidates in our sample exhibit M types. We have inserted these 34 sources in the sequence of optically-classified objects in Figures 23-26 and have labeled them with the types derived from these IR spectra, which have uncertainties of subclass unless noted otherwise.
The detection of late-type, stellar photospheric features now demonstrates that these objects indeed are young stars, and thus members of IC 348. Other available evidence of youth and membership for these objects is listed in Table 1, which is based on the diagnostics described by Luhman et al. (2003b) and Luhman et al. (2005b). Of the 35 sources with new spectral types, 32 are classified as class II T-Tauri stars, while 3 have flat or rising mid-IR SEDs and are classified as protostellar. The composite SEDs of these 32 class II sources are shown in Figure 28.
B.3. Optical Spectra
We obtained optical spectra of 20 \sst selected sources in IC 348 using the Blue Channel spectrograph on the MMT during the nights of 2004 December 10 and 11 and with the Inamori Magellan Areal Camera and Spectrograph (IMACS) on the Magellan I telescope at Las Campanas Observatory during the night of 2005 January 4. The resulting spectra have a wavelength coverage of 6300-8900 Å and a resolution of 3 Å. The procedures for the collection and reduction of these data were similar to those described by Luhman (2004).
The sources were classified in the same manner as data for Taurus taken on the same nights (Luhman, 2006). Of the 20 targets, 17 were members and 3 were determined to be non-members (the infrared excess of which were very weak; Table 3). Of the members, 13 sources had both optical and SpeX IR spectra and the spectral types derived from them in general agreed very well, except for two class II members whose infrared spectra were indeterminate (1905, 1933). Four sources have only optical spectral types, including two new class II members (1890 and 10120) and two class III members (Appendix C). The reduced, dereddened, optical spectra of these 17 members are displayed in Figure 27. In addition to spectral types, we measured particularly useful optical spectral features (e.g. )
| Source | EW(H,unc) | Other spectral informationaaThe equivalent widths of Ca II are given in order of 8499,8543,8664Å. |
|---|---|---|
| 70 | 145(10) | HeI 6678; |
| Ca II: [3.1(0.3),4.1(0.3),3.1(0.4] | ||
| 132 | 11.5(0.5) | |
| 179 | 4.8(0.5) | |
| 273 | ||
| 280 | 18(5) | |
| 364 | ||
| 401 | ||
| 406 | 22(2) | |
| 451 | 10(1) | NaK inconclusive. |
| 1683 | 62(4) | |
| 1833 | 12.5(1) | |
| 1840 | 4.5(0.5) | |
| 1881 | 45(4) | |
| 1890 | 7.5(0.5) | |
| 1905 | 45(3) | [OI]6300;, HeI 6678; |
| Ca II: [1.7(0.2),1.6(0.2),1.6(0.2] | ||
| 1933 | 55(4) | HeI 6678; |
| Ca II: [17.5(1),18.0(1),18.3(1)] | ||
| 10120 | 17.5(1) | |
| 10219 | 23(3) | |
| 22232 | 85(10) |
for these members (10).
Appendix C Class III membership
Our \sst census cannot uniquely identify diskless cluster members and we did not attempt an exhaustive search for anemic disk candidates. In this appendix we describe how we used archival X-ray and recent optical monitoring results to tabulate candidate members lacking strong disk signatures (class III), which we used to justify our extrapolated population estimate given in Section 4.1.
Matching the 220 Chandra X-ray sources identified in the uniformly processed ANCHORS data191919ANCHORS: an Archive of Chandra Observations of Regions of Star Formation; Chandra Archival Proposal 06200277; S. Wolk, PI. See http://hea-www.harvard.edu/~swolk/ANCHORS/. Data (53ksec ACIS; Chandra ObsId 606 (catalog ADS/Sa.CXO#obs/00606)) originally observed (2000-09-21) and published by Preibisch & Zinnecker (2001). to our source catalog provides the following statistics: (31) of these sources have no match to our \sst catalog or are lacking near-IR photometry – these are all likely from background galaxies; 12 X-ray sources with , consisting of 4 flat spectrum protostars, 4 low luminosity candidate class I and 4 rejected low luminosity class I sources; 2 known foreground stars and 162 known members. We inspected the composite SEDs of the remaining 13 sources; on the vs color-magnitude diagram three of them fall below the main sequence at the distance of IC 348 and were rejected; the remaining 10 fall into the locus of X-ray detected known members. Similarly, a cross match of our master catalog to the 71 unique X-ray sources in wider-field XMM data (Preibisch & Zinnecker, 2004)202020XMM ObsId 0110880101; ObsDate: 2003-02-02 (catalog ADS/Sa.XMM#obs/0110880101) yielded a further 11 candidate X-ray members along with 39 probable extragalactic sources, 17 confirmed members and 3 known non-members. Lastly, we searched a recent catalog of IC 348 periodic sources (Cieza & Baliber, 2006) and found 5 periodic unconfirmed members that fell inside our \sst survey region but outside of pre-existing X-ray surveys. Of these five, one falls below the main sequence and we did not consider it a member (Cieza & Baliber, source #140); thus, within the boundaries of our \sst census the total number of candidate IC 348 member identified by these two techniques is 25. Only two of these 25 candidate members (#104 and 185) were detected at ; both are anemic disk members with , respectively. The SEDs of the remaining 23 candidate members are consistent with stellar photospheres. Two X-ray selected candidates were fortuitously assigned random slits in our IMACS observations: # 273 is an M4.25 type member and # 401 is an M5.25 type member. Two other anemic disk sources (# 451 and 1840), which are neither X-ray sources nor periodic, have optical spectral types and luminosities that suggest they are infact members. Note that excess of #451 is very weak while the gravity sensitive NaK features are indeterminate; thus, its membership is poorly defined. As discussed above, these 27 sources correspond to about half the predicted number of class III members based on the statistics of class II members identified in our \sst census. Source names, cross-references, positions and photometry of these class III source are given in Table 11.
References
- Adams et al. (1987) Adams, F. C., Lada, C. J., & Shu, F. H. 1987, ApJ, 312, 788, ADS
- Andre et al. (1993) Andre, P., Ward-Thompson, D., & Barsony, M. 1993, ApJ, 406, 122, ADS
- Baraffe et al. (1998) Baraffe, I., Chabrier, G., Allard, F., & Hauschildt, P. H. 1998, A&A, 337, 403, ADS, astro-ph/9805009
- Barnard (1915) Barnard, E. E. 1915, ApJ, 41, 253, ADS
- Belikov et al. (2002) Belikov, A. N., Kharchenko, N. V., Piskunov, A. E., Schilbach, E., & Scholz, R.-D. 2002, A&A, 387, 117, ADS
- Binney & Tremaine (1987) Binney, J., & Tremaine, S. 1987, Galactic dynamics, third printing (1994) edn., Princeton Series in Astrophysics (Princeton, NJ: Princeton University Press), 747, astro-ph/9304010, ADS
- Borkin et al. (2005) Borkin, M. A., Ridge, N. A., Goodman, A. A., & Halle, M. 2005, ArXiv Astrophysics e-prints, arXiv:astro-ph/0506604
- Briceño et al. (1998) Briceño, C., Hartmann, L., Stauffer, J., & Martín, E. 1998, AJ, 115, 2074, ADS
- Briceño et al. (2002) Briceño, C., Luhman, K. L., Hartmann, L., Stauffer, J. R., & Kirkpatrick, J. D. 2002, ApJ, 580, 317, ADS
- Cambrésy et al. (2006) Cambrésy, L., Petropoulou, V., Kontizas, M., & Kontizas, E. 2006, A&A, 445, 999, ADS, astro-ph/0509560
- Casali & Matthews (1992) Casali, M. M., & Matthews, H. E. 1992, MNRAS, 258, 399
- Chiang & Goldreich (1999) Chiang, E. I., & Goldreich, P. 1999, ApJ, 519, 279, ADS, astro-ph/9812194
- Cieza & Baliber (2006) Cieza, L., & Baliber, N. 2006, ArXiv Astrophysics e-prints, ADS, astro-ph/0606127
- Cushing et al. (2004) Cushing, M. C., Vacca, W. D., & Rayner, J. T. 2004, PASP, 116, 362, ADS
- D’Alessio et al. (1999) D’Alessio, P., Calvet, N., Hartmann, L., Lizano, S., & Cantó, J. 1999, ApJ, 527, 893, ADS, astro-ph/9907330
- Eislöffel et al. (2003) Eislöffel, J., Froebrich, D., Stanke, T., & McCaughrean, M. J. 2003, ApJ, 595, 259, ADS, astro-ph/0306067
- Eisner et al. (2005) Eisner, J. A., Hillenbrand, L. A., Carpenter, J. M., & Wolf, S. 2005, ApJ, 635, 396, ADS, astro-ph/0508380
- Engelbracht (2006) Engelbracht, C. W. e. 2006, PASP, submitted
- Enoch et al. (2006) Enoch, M. L. et al. 2006, ApJ, 638, 293, ADS, astro-ph/0510202
- Evans et al. (2003) Evans, II, N. J. et al. 2003, PASP, 115, 965, ADS, astro-ph/0305127
- Fazio et al. (2004) Fazio, G. G. et al. 2004, ApJS, 154, 10, ADS, astro-ph/0405616
- Froebrich (2005) Froebrich, D. 2005, ApJS, 156, 169, ADS, astro-ph/0410044
- Gordon et al. (2005) Gordon, K. D. et al. 2005, PASP, 117, 503, ADS, astro-ph/0502079
- Greene & Lada (1996) Greene, T. P., & Lada, C. J. 1996, AJ, 112, 2184, ADS
- Grosso et al. (2005) Grosso, N. et al. 2005, ApJS, 160, 530, ADS
- Haisch et al. (2001) Haisch, Jr., K. E., Lada, E. A., & Lada, C. J. 2001, ApJ, 553, L153, ADS, astro-ph/0104347
- Hartmann (2001) Hartmann, L. 2001, AJ, 121, 1030, ADS
- Hatchell et al. (2005) Hatchell, J., Richer, J. S., Fuller, G. A., Qualtrough, C. J., Ladd, E. F., & Chandler, C. J. 2005, A&A, 440, 151, ADS
- Herbig (1954) Herbig, G. H. 1954, PASP, 66, 19, ADS
- Herbig (1998) —. 1998, ApJ, 497, 736, ADS
- Herbig & Bell (1988) Herbig, G. H., & Bell, K. R. 1988, Catalog of emission line stars of the orion population : 3 : 1988 (Lick Observatory Bulletin, Santa Cruz: Lick Observatory, —c1988), ADS
- Hillenbrand & Hartmann (1998) Hillenbrand, L. A., & Hartmann, L. W. 1998, ApJ, 492, 540, ADS
- Holland et al. (1999) Holland, W. S. et al. 1999, MNRAS, 303, 659, ADS, astro-ph/9809122
- Indebetouw et al. (2005) Indebetouw, R. et al. 2005, ApJ, 619, 931, ADS, astro-ph/0406403
- Jørgensen et al. (2006) Jørgensen, J. K. et al. 2006, ApJ, 645, 1246, ADS, astro-ph/0603547
- Jura et al. (2006) Jura, M. et al. 2006, ApJ, 637, L45, ADS, astro-ph/0512371
- Kenyon & Hartmann (1995) Kenyon, S. J., & Hartmann, L. 1995, ApJS, 101, 117, ADS
- Kenyon & Hartmann (1990) Kenyon, S. J., & Hartmann, L. W. 1990, ApJ, 349, 197, ADS
- Kirk et al. (2006) Kirk, H., Johnstone, D., & Di Francesco, J. 2006, ApJ, 646, 1009, ADS, astro-ph/0602089
- Kirkpatrick et al. (1991) Kirkpatrick, J. D., Henry, T. J., & McCarthy, Jr., D. W. 1991, ApJS, 77, 417, ADS
- Kraemer et al. (2003) Kraemer, K. E., Shipman, R. F., Price, S. D., Mizuno, D. R., Kuchar, T., & Carey, S. J. 2003, AJ, 126, 1423, ADS
- Lada (1987) Lada, C. J. 1987, in IAU Symp. 115: Star Forming Regions, ed. M. Peimbert & J. Jugaku, 1–17, ADS
- Lada & Lada (2003) Lada, C. J., & Lada, E. A. 2003, ARA&A, 41, 57, ADS, astro-ph/0301540
- Lada et al. (2000) Lada, C. J., Muench, A. A., Haisch, Jr., K. E., Lada, E. A., Alves, J. F., Tollestrup, E. V., & Willner, S. P. 2000, AJ, 120, 3162, ADS, astro-ph/0008280
- Lada et al. (2004) Lada, C. J., Muench, A. A., Lada, E. A., & Alves, J. F. 2004, AJ, 128, 1254, ADS, astro-ph/0406326
- Lada et al. (2006) Lada, C. J. et al. 2006, AJ, 131, 1574, ADS, astro-ph/0511638
- Lada & Lada (1995) Lada, E. A., & Lada, C. J. 1995, AJ, 109, 1682, ADS
- Leggett et al. (2001) Leggett, S. K., Allard, F., Geballe, T. R., Hauschildt, P. H., & Schweitzer, A. 2001, ApJ, 548, 908, ADS, astro-ph/0010174
- Looney et al. (2000) Looney, L. W., Mundy, L. G., & Welch, W. J. 2000, ApJ, 529, 477, ADS, astro-ph/9908301
- Lucas et al. (2001) Lucas, P. W., Roche, P. F., Allard, F., & Hauschildt, P. H. 2001, MNRAS, 326, 695, ADS, astro-ph/0105154
- Luhman (1999) Luhman, K. L. 1999, ApJ, 525, 466, ADS, astro-ph/9905287
- Luhman (2004) —. 2004, ApJ, 617, 1216, ADS, astro-ph/0411447
- Luhman (2006) —. 2006, ApJ, 645, 676, ADS
- Luhman et al. (2003a) Luhman, K. L., Briceño, C., Stauffer, J. R., Hartmann, L., Barrado y Navascués, D., & Caldwell, N. 2003a, ApJ, 590, 348, ADS, astro-ph/0304414
- Luhman et al. (1998a) Luhman, K. L., Briceno, C., Rieke, G. H., & Hartmann, L. 1998a, ApJ, 493, 909+, ADS
- Luhman et al. (2005a) Luhman, K. L., Lada, E. A., Muench, A. A., & Elston, R. J. 2005a, ApJ, 618, 810, ADS, astro-ph/0411449
- Luhman et al. (2005b) Luhman, K. L., McLeod, K. K., & Goldenson, N. 2005b, ApJ, 623, 1141, ADS, astro-ph/0501537
- Luhman & Rieke (1999) Luhman, K. L., & Rieke, G. H. 1999, ApJ, 525, 440, ADS, astro-ph/9905286
- Luhman et al. (1998b) Luhman, K. L., Rieke, G. H., Lada, C. J., & Lada, E. A. 1998b, ApJ, 508, 347, ADS
- Luhman et al. (2003b) Luhman, K. L., Stauffer, J. R., Muench, A. A., Rieke, G. H., Lada, E. A., Bouvier, J., & Lada, C. J. 2003b, ApJ, 593, 1093, ADS, astro-ph/0304409
- Matthews & Soifer (1994) Matthews, K., & Soifer, B. T. 1994, in ASSL Vol. 190: Astronomy with Arrays, The Next Generation, ed. I. S. McLean, 239, ADS
- McCaughrean et al. (1994) McCaughrean, M. J., Rayner, J. T., & Zinnecker, H. 1994, ApJ, 436, L189, ADS
- McGovern et al. (2004) McGovern, M. R., Kirkpatrick, J. D., McLean, I. S., Burgasser, A. J., Prato, L., & Lowrance, P. J. 2004, ApJ, 600, 1020, ADS, astro-ph/0309634
- Megeath et al. (2004) Megeath, S. T. et al. 2004, ApJS, 154, 367, ADS, astro-ph/0406008
- Motte & André (2001) Motte, F., & André, P. 2001, A&A, 365, 440, ADS
- Muench et al. (2003) Muench, A. A. et al. 2003, AJ, 125, 2029, ADS, astro-ph/0301276
- Muzerolle et al. (2006) Muzerolle, J. et al. 2006, ApJ, 643, 1003, ADS
- Myers et al. (1987) Myers, P. C., Fuller, G. A., Mathieu, R. D., Beichman, C. A., Benson, P. J., Schild, R. E., & Emerson, J. P. 1987, ApJ, 319, 340, ADS
- Nordhagen et al. (2006) Nordhagen, S., Herbst, W., Rhode, K. L., & Williams, E. C. 2006, AJ, 132, 1555, ADS, astro-ph/0606428
- Palla & Stahler (2000) Palla, F., & Stahler, S. W. 2000, ApJ, 540, 255, ADS
- Preibisch & Zinnecker (2001) Preibisch, T., & Zinnecker, H. 2001, AJ, 122, 866, ADS
- Preibisch & Zinnecker (2004) —. 2004, A&A, 422, 1001, ADS
- Rayner et al. (2003) Rayner, J. T., Toomey, D. W., Onaka, P. M., Denault, A. J., Stahlberger, W. E., Vacca, W. D., Cushing, M. C., & Wang, S. 2003, PASP, 115, 362, ADS
- Reid et al. (2001) Reid, I. N., Burgasser, A. J., Cruz, K. L., Kirkpatrick, J. D., & Gizis, J. E. 2001, AJ, 121, 1710, ADS, astro-ph/0012275
- Ridge et al. (2006) Ridge, N. A. et al. 2006, AJ, 131, 2921, ADS, astro-ph/0602542
- Rieke et al. (2004) Rieke, G. H. et al. 2004, ApJS, 154, 25, ADS
- Scally & Clarke (2002) Scally, A., & Clarke, C. 2002, MNRAS, 334, 156, ADS
- Scholz et al. (1999) Scholz, R.-D. et al. 1999, A&AS, 137, 305, ADS
- Skrutskie et al. (2006) Skrutskie, M. F. et al. 2006, AJ, 131, 1163, ADS
- Strom et al. (1974) Strom, S. E., Strom, K. A., & Carrasco, L. 1974, PASP, 86, 798, ADS
- Tafalla et al. (2006) Tafalla, M., Kumar, M. S. N., & Bachiller, R. 2006, A&A, 456, 179, ADS, astro-ph/0606390
- Tan et al. (2006) Tan, J. C., Krumholz, M. R., & McKee, C. F. 2006, ApJ, 641, L121, ADS, astro-ph/0603278
- Teixeira et al. (2006) Teixeira, P. S. et al. 2006, ApJ, 636, L45, ADS, astro-ph/0511732
- Tej et al. (2002) Tej, A., Sahu, K. C., Chandrasekhar, T., & Ashok, N. M. 2002, ApJ, 578, 523, ADS, astro-ph/0206325
- Trullols & Jordi (1997) Trullols, E., & Jordi, C. 1997, A&A, 324, 549, ADS
- Vacca et al. (2003) Vacca, W. D., Cushing, M. C., & Rayner, J. T. 2003, PASP, 115, 389, ADS, astro-ph/0211255
- Walawender et al. (2006) Walawender, J., Bally, J., Kirk, H., Johnstone, D., Reipurth, B., & Aspin, C. 2006, AJ, 132, 467, ADS
- Walawender et al. (2005) Walawender, J., Bally, J., & Reipurth, B. 2005, AJ, 129, 2308, ADS
- Werner et al. (2004) Werner, M. W. et al. 2004, ApJS, 154, 1, ADS, astro-ph/0406223
- White et al. (2006) White, R. J., Greene, T. P., Doppmann, G. W., Covey, K. R., & Hillenbrand, L. A. 2006, ArXiv Astrophysics e-prints, ADS, astro-ph/0604081
- Whitney et al. (2004) Whitney, B. A., Indebetouw, R., Bjorkman, J. E., & Wood, K. 2004, ApJ, 617, 1177, ADS
- Young et al. (2006) Young, E. T. et al. 2006, ApJ, 642, 972, ADS, astro-ph/0601300
| ID | Cross-reference | Position (J2000) | Photometry(2)(2)Origin of photometry are as follows: : Luhman et al. (2003b); : Muench et al. (2003); \sst : this paper. The listed magnitude is an upper limit if the listed uncertainty is given as -9. | |||||||||||||||
|---|---|---|---|---|---|---|---|---|---|---|---|---|---|---|---|---|---|---|
| (1)(1)CXOANC: ANCHORS catalog; XMMU: Preibisch & Zinnecker (2004); CB2006: Cieza & Baliber (2006); 2MASS: Skrutskie et al. (2006). | RA | DEC | unc | unc | unc | unc | unc | |||||||||||
| Members | ||||||||||||||||||
| 273 | XMMU J034352.1+320343 | 03:43:52.09 | 32:03:40.0 | 16.02 | 15.20 | 13.77 | 13.01 | 12.66 | 12.31 | 0.01 | 12.01 | 0.02 | 12.22 | 0.07 | 12.14 | 0.06 | 7.91 | -9.00 |
| 401 | CXOANC J034431.3+321448 | 03:44:31.20 | 32:14:47.2 | 18.72 | 17.60 | 15.35 | 14.20 | 13.62 | 13.10 | 0.02 | 12.90 | 0.02 | 13.03 | 0.08 | 13.35 | 0.04 | 6.27 | -9.00 |
| 451 | 2MASS J03434521+3205247 | 03:43:45.23 | 32:05:24.8 | 17.62 | 16.73 | 15.30 | 14.54 | 14.02 | 13.72 | 0.02 | 13.62 | 0.04 | 13.30 | 0.09 | 13.43 | -9.00 | 8.66 | -9.00 |
| 1840 | 2MASS J03431992+3202412 | 03:43:19.93 | 32:02:41.4 | 15.73 | 15.00 | 13.81 | 13.16 | 12.84 | 12.81 | 0.03 | 12.39 | 0.02 | 12.51 | 0.06 | 12.33 | 0.10 | 8.14 | -9.00 |
| Candidates | ||||||||||||||||||
| 102 | CXOANC J034435.8+321503 | 03:44:35.898 | 32:15:02.35 | 16.05 | 15.17 | 12.86 | 11.59 | 11.13 | 10.80 | 0.01 | 10.74 | 0.03 | 10.67 | 0.04 | 10.65 | 0.03 | 7.92 | -9.00 |
| 104 | XMMU J034429.9+321921 | 03:44:29.98 | 32:19:22.7 | 14.71 | 13.89 | 12.49 | 11.50 | 11.14 | 10.84 | 0.00 | 10.79 | 0.08 | 10.64 | 0.04 | 10.43 | 0.04 | 8.01 | 0.07 |
| 118 | XMMU J034402.1+321940 | 03:44:02.19 | 32:19:40.1 | 14.11 | 13.56 | 12.52 | 11.60 | 11.33 | 11.12 | 0.01 | 11.09 | 0.02 | 11.04 | 0.05 | 11.06 | 0.04 | 8.49 | -9.00 |
| 126 | CB2006 024 | 03:43:47.89 | 32:17:56.9 | 14.52 | 13.89 | 12.53 | 11.67 | 11.38 | 11.25 | 0.03 | 11.17 | 0.02 | 11.06 | 0.03 | 11.11 | 0.02 | 8.65 | -9.00 |
| 148 | CXOANC J034435.9+321554 | 03:44:34.71 | 32:15:54.4 | 16.30 | 15.28 | 13.30 | 12.07 | 11.58 | 11.09 | 0.01 | 11.06 | 0.03 | 10.95 | 0.06 | 10.93 | 0.05 | 3.81 | -9.00 |
| 155 | XMMU J034359.5+321551 | 03:43:59.55 | 32:15:55.4 | 15.23 | 13.05 | 12.00 | 11.68 | 11.39 | 0.01 | 11.45 | 0.03 | 11.40 | 0.04 | 11.32 | 0.06 | 6.46 | -9.00 | |
| 185 | CXOANC J034421.6+321511 | 03:44:21.56 | 32:15:09.8 | 14.93 | 14.23 | 12.98 | 12.18 | 11.91 | 11.72 | 0.01 | 11.71 | 0.03 | 11.67 | 0.06 | 11.38 | 0.03 | 8.88 | 0.28 |
| 196 | CXOANC J034440.9+321721 | 03:44:40.90 | 32:17:19.1 | 17.01 | 15.98 | 13.94 | 12.67 | 12.17 | 11.73 | 0.01 | 11.64 | 0.04 | 11.60 | 0.03 | 11.61 | 0.04 | 6.35 | -9.00 |
| 204 | CXOANC J034439.9+321601 | 03:44:39.86 | 32:15:58.1 | 15.71 | 14.94 | 13.49 | 12.53 | 12.20 | 11.83 | 0.01 | 11.78 | 0.02 | 11.86 | 0.04 | 11.81 | 0.13 | 6.43 | -9.00 |
| 208 | XMMU J034438.7+321905 | 03:44:38.79 | 32:19:05.6 | 15.19 | 14.51 | 13.26 | 12.36 | 12.10 | 11.82 | 0.02 | 11.77 | 0.02 | 11.77 | 0.12 | 12.51 | 1.15 | 4.91 | -9.00 |
| 283 | XMMU J034434.1+321957 | 03:44:34.38 | 32:19:56.9 | 15.49 | 14.89 | 13.84 | 13.07 | 12.84 | 12.56 | 0.01 | 12.45 | 0.05 | 12.45 | 0.07 | 12.37 | 0.12 | 6.19 | -9.00 |
| 288 | CXOANC J034347.1+321320 | 03:43:47.12 | 32:13:21.4 | 15.52 | 15.05 | 13.85 | 13.20 | 12.91 | 12.77 | 0.01 | 12.70 | 0.02 | 12.67 | 0.09 | 12.66 | 0.13 | 7.65 | -9.00 |
| 323 | CXOANC J034358.1+321356 | 03:43:58.12 | 32:13:57.1 | 15.97 | 15.46 | 14.23 | 13.41 | 13.22 | 13.06 | 0.01 | 13.00 | 0.02 | 12.92 | 0.05 | 13.16 | 0.17 | 6.35 | -9.00 |
| 1680 | XMMU J034505.1+315752 | 03:45:05.07 | 31:57:54.3 | 17.80 | 16.89 | 15.31 | 14.68 | 14.18 | 13.84 | 0.02 | 13.61 | 0.11 | 9.80 | -9.00 | ||||
| 1688 | CXOANC J034510.2+320451 | 03:45:10.02 | 32:04:48.8 | 16.99 | 16.23 | 14.76 | 13.97 | 13.62 | 13.29 | 0.01 | 13.20 | 0.03 | 13.14 | 0.07 | 13.29 | 0.11 | 9.80 | -9.00 |
| 1888 | CXOANC J034419.8+315919 | 03:44:19.78 | 31:59:19.0 | 15.12 | 12.07 | 0.01 | 11.07 | 0.02 | 10.57 | 0.04 | 10.41 | 0.03 | 7.74 | -9.00 | ||||
| 1931 | XMMU J034452.9+320005 | 03:44:53.19 | 32:00:06.7 | 18.61 | 15.15 | 13.21 | 12.20 | 0.01 | 11.91 | 0.03 | 11.59 | 0.06 | 11.72 | 0.04 | 10.22 | -9.00 | ||
| 10019 | CB2006 138 | 03:45:18.00 | 32:19:33.0 | 13.46 | 12.47 | 12.14 | 11.79 | 0.01 | 11.68 | 0.02 | 11.78 | 0.04 | 11.52 | 0.04 | 8.12 | -9.00 | ||
| 10138 | CB2006 141 | 03:45:21.06 | 32:18:17.8 | 13.01 | 11.90 | 11.49 | 11.05 | 0.01 | 10.89 | 0.01 | 10.77 | 0.03 | 10.88 | 0.04 | 7.49 | -9.00 | ||
| 10284 | XMMU J034535.3+320328 | 03:45:35.45 | 32:03:25.8 | 14.94 | 14.30 | 13.17 | 12.48 | 12.14 | 9.59 | -9.00 | ||||||||
| 10373 | XMMU J034522.0+320203 | 03:45:22.15 | 32:02:04.1 | 15.12 | 14.48 | 13.23 | 12.58 | 12.06 | 0.00 | 11.95 | 0.01 | 11.88 | 0.03 | 11.94 | 0.06 | 8.85 | -9.00 | |
| 54519 | XMMU J034413.8+315534 | 03:44:13.77 | 31:55:34.4 | 13.64 | 12.19 | 11.59 | 11.02 | 0.01 | 10.88 | 0.05 | 8.39 | -9.00 | ||||||
| 54916 | CB2006 116 | 03:44:40.63 | 32:23:10.7 | 12.74 | 11.85 | 11.50 | 11.28 | 0.01 | 11.28 | 0.01 | 11.25 | 0.03 | 11.21 | 0.07 | 8.72 | -9.00 | ||