Interface dynamics of microscopic cavities in water
Abstract
An analytical description of the interface motion of a collapsing nanometer-sized spherical cavity in water is presented by a modification of the Rayleigh-Plesset equation in conjunction with explicit solvent molecular dynamics simulations. Quantitative agreement is found between the two approaches for the time-dependent cavity radius at different solvent conditions while in the continuum picture the solvent viscosity has to be corrected for curvature effects. The typical magnitude of the interface or collapse velocity is found to be given by the ratio of surface tension and fluid viscosity, , while the curvature correction accelerates collapse dynamics on length scales below the equilibrium crossover scales (1nm). The study offers a starting point for an efficient implicit modeling of water dynamics in aqueous nanoassembly and protein systems in nonequilibrium.
pacs:
68.03.-g,68.35.Md,83.10.Rs,47.55.ddI Introduction
Hydrophobic hydration in equilibrium is a phenomenon which exhibits qualitatively different behavior at small and large length scales. Chandler (2005); Rajamani et al. (2005) While small solutes (radii 1nm) are accommodated by water with only minor perturbations, larger solutes (1nm) induce major rearrangements of water interfacial structure. As a consequence the solvation free energy of small hydrophobic cavities scales with solute volume while for larger cavities it grows with surface area (as a good approximation near liquid-vapor coexistence) accompanied by weak solvent dewetting at extended restraining hydrophobic surfaces.Poynor et al. (2006) Furthermore, water, which is close to the liquid-vapor transition at normal conditions, can minimize interface area by locally evaporating and forming a ’nanobubble’ within hydrophobic confinement. Evidence of bubble formation in confined geometry has been given early by computer simulations of smooth plate-like solutes,Wallquist and Berne (1995) but more recently it has been demonstrated in varying degrees in atomistically resolved plate-like solutes, Koishi (2004); Giovambattista et al. (2006) hydrophobic tubes and ion channels,Beckstein and Sansom (2003); Anishkin and Sukharev (2004) and in the collapse of proteins,Zhou et al. (2004); Liu et al. (2005) suggesting that it plays a key role in the stabilization and folding dynamics of certain classes of biomolecules.ten Wolde and Chandler (2002); Huang and Chandler (2000) Experimental evidence of nanobubbles in strong confinement (in contrast to bubbles at a single planar surface Poynor et al. (2006)) has been given for instance in studies of water between hydrophobic surfaces,Carambassis et al. (1998) in zeolites and silica nanotubes,Helmy et al. (2005); Jayaraman et al. (2005) and on a subnanometer scale in nonpolar protein cavities.Collins et al. (2005)
The dewetting induced change in solvation energy is typically estimated using simple macroscopic arguments as known from capillarity theory, e.g. by describing interfaces with Laplace-Young (LY) type of equations.Huang et al. (2003); Helmy et al. (2005) Recently an extension of the LY equation has become available which extrapolates to microscopic scales by including a curvature correction to the interface tension and considering atomistic dispersion and electrostatic potentials of the solvated solute explicitly.Dzubiella et al. (2006a) Although those macroscopic considerations (e.g,. the concept of surface tension) are supposed to break down on atomistic scales they show surprisingly good results for the solvation energy of microscopic solutes, e.g. alkanes and noble gases, and quantitatively account for dewetting effects in nanometer-sized hydrophobic confinement.Dzubiella et al. (2006b) While we conclude that the equilibrium location of the solute-solvent interface seems to be well described by those techniques, nothing is known about the interface dynamics of evolution and relaxation. In this study we address two fundamental questions: First, what are the equations which govern the interface motion on atomistic (1nm) scales? Secondly, does the dynamics exhibit any signatures of the length scale crossover found in equilibrium?
On macroscopic scales the collapse dynamics of a (vapor or gas) bubble is related to the well-known phenomenon of sonoluminescence.Brennen (1995) The governing equations can be derived from Navier-Stokes and capillarity theory and are expressed by the Rayleigh-Plesset (RP) equation.Plesset and Prosperetti (1977) We will show that the RP equation simplifies in the limit of microscopic cavities and can be extended to give a quantitative description of cavity interface dynamics on nanometer length scales. We find a qualitatively different dynamics than the typical “mean-curvature flow” description of moving interfaces, Spohn (1993) in particular a typical magnitude of interface or collapse velocity given by the ratio of surface tension and fluid viscosity, . Our study is restricted to the generic case of the collapse of a spherical cavity and is complemented by explicit solvent molecular dynamics (MD) computer simulations. We note here that recently, Lugli and Zerbetto studied nanobubble collapse in ionic solutions by MD simulations on similar length scales.Lugli and Zerbetto (2007) While their MD data compares favorably with our results their interpretation and conclusions in terms of the RP equation are different. We will resume this discussion in the conclusion section.
In this study we show that a simple analytical approach quantitatively describes microscopic cavity collapse for a variety of different solvent situations while the simulations suggest that the solvent viscosity needs to be corrected for curvature effects. Our study might offer a simple starting point for an efficient implicit modeling of water dynamics in aqueous nanoassembly and protein systems in nonequilibrium.
II Theory
The Rayleigh-Plesset equation for the time evolution of a macroscopic vapor bubble with radius can be written asPlesset and Prosperetti (1977)
| (1) |
where is the solvent mass density, the difference in liquid and vapor pressures, the dynamic viscosity, and the liquid-vapor interface tension. While for macroscopic bubble radii the inertial terms (left hand side) control the dynamics, for decreasing radii the frictional and pressure terms (right hand side) grow in relative magnitude and eventually dominate, so that completely overdamped dynamics can be assumed on atomistic scales:
| (2) |
A rough estimate for the threshold radius below which friction dominates is given when the Reynolds number becomes unity and viscous and inertial forces are balanced. With a typical initial interface velocity of the order of [from in eq. (1)] we obtain
| (3) |
which is nm for water at normal conditions. Note that this threshold value can deviate considerably for a fluid different than water and that the viscosity typically has a strong temperature () dependence which implies that can change significantly with .
In equilibrium () the remaining expression in eq. (2) is the (spherical) LY equation . Thus eq. (2) describes a linear relationship between capillary pressure and interface velocity where plays the role of an interface mobility (inverse friction).Spohn (1993) Interestingly, the mobility is linear in bubble radius which leads to a constant velocity driven by surface tension independent of radius (assuming ); this has to be contrasted to the typically used capillary dynamics which is proportional to the local mean curvature .Spohn (1993)
Generalizations of the LY equation to small scales are available by adding a Gaussian curvature term () as shown by Boruvka and NeumannBoruvka and Neumann (1977); that has been demonstrated to be equivalent to a first order curvature correction in surface tension, i.e. ,Dzubiella et al. (2006a) where is the Tolman length Tolman (1949) and the liquid-vapor surface tension for a planar interface (). The Tolman length has a magnitude which is usually of the order of the size of a solvent molecule. Furthermore, it has been observed experimentally that the viscosity of strongly confined water can depend on the particular nature of the surface/interface.Raviv et al. (2002) We conclude that in general one has to anticipate that - analogous to the surface tension - the effective interface viscosity obeys a curvature correction in the limit of small cavities due to water restructuring in the first solvent layers at the hydrophobic interface. In the following we make the simple first order assumption that the correction enters eq. (2) also linear in curvature () yielding
| (4) | |||||
where the constant is the coefficient for the first order curvature correction in viscosity and the macroscopic bulk viscosity. Additionally, we define and second order terms in curvature are neglected. We note that the choice of the -scaling of the viscosity curvature correction has no direct physical justification and is arbitrary. We think however, that a curvature correction based on an expansion in orders of mean curvature is the simplest and most natural way for such a choice.
In water at normal conditions the pressure terms in (4) are negligible so that for large radii () the interface velocity is constant and . This leads to a collapse velocity of about 0.4Å/ps (40m/s) which is 6 of the thermal velocity of water showing that dissipative heating of the system is relatively weak on these scales. A rough estimate for the dissipation rate can be made by the released interfacial energy yielding for instance ps for a bubble with 2nm. At small radii () the solution of (4) goes as decreasing or increasing the velocity depending on the sign of , i.e. the acceleration depends on the particular sign and magnitude of the curvature corrections to surface tension and viscosity. For large pressures and radii the first term dominates which gives rise to an exponential decay . While extending to small scales we have assumed that the time scale of internal interface dynamics, i.e. hydrogen bond rearrangements,Kuo and Mundy (2004) is much faster than the one of bubble collapse.
III MD simulation
In order to quantify our analytical predictions we complement the theory by MD simulations using explicit SPC/E water.Berendsen et al. (1987) The liquid-vapor surface tension of SPC/E water has been measured and agrees with the experimental value for a wide range of temperatures.Alejandre et al. (1995) For K and bar we have mN/m. The Tolman length has been estimated to be Å from equilibrium measurements of the solvation energy of spherical cavities.Huang and Chandler (2002) At the same conditions the dynamic viscosity of SPC/E water has been found to be Pas,Hess (2002) 24 smaller than for real water. In experiments in nanometer hydrophobic confinement and at interfaces however, the viscosity shows deviations from the bulk value but remains comparable. Raviv et al. (2002) We proceed by treating the viscosity as an adjustable parameter together with its curvature correction coefficient .
The MD simulations are carried out with the DLPOLY2 package Smith and Forester (1999) using an integration time step of 2fs. The simulation box is cubic and periodic in all three dimensions with a length of )Å in equilibrium involving solvent molecules. Electrostatic interactions are calculated by the smooth-particle mesh Ewald summation method. Lennard-Jones interactions are cut-off and shifted at 9Å. Our investigated systems are at first equilibrated in the ensemble with application of an external spherical potential of the form and all molecules removed with since vapor can safely be neglected on these scales. This stabilizes a well-defined spherical bubble of radius Å. We define the cavity radius by the radial location where the water density drops to half of the bulk density . Thirty independent configurations in 20ps intervals are stored and serve as initial configurations for the nonequilibrium runs. We employ a Nosé-Hoover barostat and thermostat with a 0.2ps relaxation time to maintain the solvent at a pressure and a temperature . Other choices of relaxation times in the reasonable range between 0.1 and 0.5ps do not alter our results. In the nonequilibrium simulations the constraining potential is switched off and the relaxation to equilibrium is averaged over the thirty runs.
IV Results
| system | bar | /K | /M | /(Pas) | |
|---|---|---|---|---|---|
| I | 300 | 0 | 0 | 5.14 | |
| II | 300 | 1.5 | 0 | 5.94 | |
| III | 277 | 0 | 0 | 8.48 | |
| IV | 2000 | 300 | 0 | 0 | 4.56 |
| V | 1000 | 300 | 0 | 0 | 4.72 |
| VI | 300 | 0 | +2 | 5.14 |
We perform simulations of six different systems I-VI whose features are summarized in Tab. I and differ in thermodynamic parameters and (I, III, IV, and V) but also inclusion of dispersed salt (II), and the influence of a charged particle in the bubble center (VI) are considered. Note that the exact value of the crossover length scale (however defined) can depend on the detailed thermodynamic or solvent condition but remains close to 1nm.Rajamani et al. (2005)
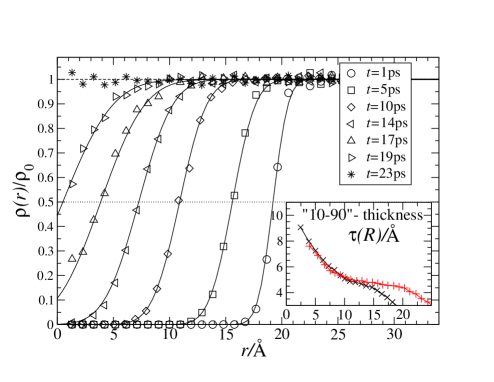
System I is at normal conditions (=300K, =1bar) and consists of pure SPC/E water. Fig. 1 shows the observed interface profiles in the nonequilibrium situation at different times /ps=1, 5, 10, 14, 17, 19, and 23 starting from an initial radius Å. The liquid-vapor interface stays relatively sharp in the process of relaxation but broadens noticeably for smaller radii. At ps the system is completely relaxed to a homogeneous density distribution. The same time scale of bubble collapse has been found in explicit water computer simulations of dewetting in nanometer-sized paraffin plates,Huang et al. (2003) polymers,ten Wolde and Chandler (2002) and atomistically resolved proteins.Zhou et al. (2004); Liu et al. (2005)
We find that the interface profiles can be fitted very well with a functional form , where is a measure of the interface thickness. The interface fits are also shown in Fig. 1 together with the MD data. The experimentally accessible “10-90” thickness of an interface is the thickness over which the density changes from to and is related to the parameter via . While experimental values of for the planar water liquid-vapor interface vary between 4 and 8Å the measured values for SPC/E water in the finite simulation systems are 3 to 4Å.Alejandre et al. (1995) We find a strongly radius-dependent function plotted in the inset to Fig. 1 for initial radii Å and Å. For the thickness increases during the following 5ps from the equilibrium value Å to about Å independent of . While the exact equilibrium thickness at depends on the particular choice of the confining potential (e.g., a softer potential might lead to a broader initial interface) this suggest that 4.5-5Å is the typical interface thickness for a bubble of 1nm size. Regarding the slope of the curve one might speculate that saturates to the thickness of the measured planar interface for . For Å the thickness increases twofold during the relaxation to equilibrium. This broadening might be attributed to increased density fluctuations and the structural change of interfacial water in the system when crossing from large to small length scales which has been shown to happen in equilibrium at 1nm.Chandler (2005); Rajamani et al. (2005)
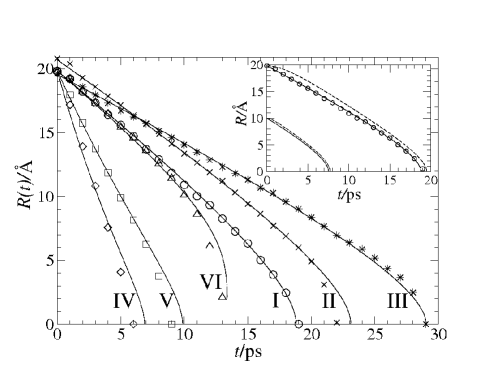
In Fig. 2 we plot the time evolution of the bubble radius for all investigated systems. Let us first focus on the simulation data of system I (circles). As anticipated the bubble radius decreases initially in a linear fashion while for smaller radii (Å) the velocity steadily increases. From the best fit of eq. (4) we find a viscosity Pas and its curvature correction coefficient Å. Although investigating a confined system with large interfaces the viscosity value differs only 20 from the SPC/E bulk value. Furthermore, from our macroscopic point of view the MD data show that high curvature decreases the viscosity and the latter has to be curvature-corrected with a (positive) coefficient larger than the Tolman length . If the surface tension decreased in a stronger fashion with curvature than viscosity the collapse velocity would drop in qualitative disagreement with the simulation. The overall behavior of and the collapse velocity of about 1Å/ps agrees very well with the recent MD data of Lugli and Zerbetto, who simulated the collapse of a 1nm sized bubble in SPC water.Lugli and Zerbetto (2007)
The inset to Fig. 2 shows the solution of eq. (4) including inertial terms [left hand side of (1)] to check the assumption of overdamped dynamics. While inertial effects are indeed small but not completely negligible for an initial radius Å they basically vanish for Å. Interestingly, the inertial effects are not visible in the MD simulation data at all. We attribute this observation to the finite and periodic simulation box which is known to suppress long-ranged inertial (hydrodynamic) effects.Dünweg and Kremer (1993)
In the following we assume to be independent of the other parameters and treat only as adjustable variable. In system II we add 175 salt pairs of sodium chloride (NaCl) into the aqueous solution resulting in a concentration of 1.5M. The ion-SPC/E interaction parameters are those used by Bhatt et al.Bhatt et al. (2004) who measured a linear increase of surface tension with NaCl concentration in agreement with experimental data. While this increment for M is about small 2-3, the viscosity has been measured experimentally to increase by approximately at 298.15K.Hai-Lang and Shi-Jun (1996) Indeed by comparing the simulation data to the theory we find a larger viscosity Pas. A slower collapse velocity has been found also in the MD simulations of Lugli and Zerbetto in concentrated LiCl and CsCL solutions when compared to pure water.Lugli and Zerbetto (2007)
In system III we investigate the effect of lowering the temperature by simulating at K. While only a increase of the water surface tension (SPC/E and real water) is estimated from available data Alejandre et al. (1995) the viscosity depends strongly on temperature: the relative increase has been reported to be between for SPC/E water ( for real water).Smith and van Gunsteren (1993) Inspecting the MD data and considering the surface tension increase we find indeed a large decrease in viscosity of 65 with a best-fit Pas. Both systems, II and III, show that solvent viscosity has a substantial influence on bubble dynamics as quantitatively described by our simple analytical approach. In systems IV and V we return to K but increase the pressure by a factor of 2000 and 1000, respectively. Best fits provide viscosities which are around 10 smaller than at normal conditions in agreement with the very weak pressure dependence of the viscosity found in experiments Bett and Cappi (1965); Sengers and Watson (1986) at T=300K. The major contribution to the faster dynamics comes explicitly from the pressure terms in eq. (4). Although moving away from liquid-vapor coexistence by increasing the pressure up to 2000bar we assume (and verify hereby) that the bubble interface tension can still be described by .
In system VI we investigate the influence of a hydrophilic solute on the bubble interface motion in order to make connection to cavitation close to molecular (protein) surfaces. As a simple measure we fix a divalent ion at the center of the bubble so that we retain spherical symmetry. The ion is modeled by a Lennard-Jones (LJ) potential with point charges and uses the LJ parameters of the SPC/E oxygen-oxygen interaction. As demonstrated recently the LY equation can be modified to include dispersion and electrostatic solute-solvent interactions explicitly,Dzubiella et al. (2006a) which extends (4) to
The last term in (IV) is the Born electrostatic energy density of a central charge in a spherical cavity with radius with low dielectric vapor surrounded by a high dielectric liquid (). The electric field around the ionic charge and the dispersion attracts the surrounding dipolar water what accelerates and eventually completely governs the bubble collapse below a radius Å (ps) as also shown in Fig. 2. The theoretical prediction (IV) agrees very well without any fitting using the viscosity from system I. We find that the acceleration is mainly due to the electrostatic attraction; the dispersion term plays just a minor role while the excluded volume repulsion eventually determines the final (equilibrium) radius of the interface with Å.
V Conclusions
In conclusion, we have presented a simple analytical and quantitative description of the interface motion of a microscopic cavity by modifying the macroscopic RP equation. Based on our MD data we find for the macroscopic description that analogous to the surface tension the viscosity has to be corrected for curvature effects, a prediction compelling to investigate further in detail and probably related to the restructuring of interfacial water for high curvatures (small ). The viscosity correction accelerates collapse dynamics markedly below the equilibrium crossover scale (1nm) in contrast to the pure equilibrium picture where surface tension decreases what slows down the collapse. Further, we find that the dynamics is curvature-driven due to the corrections to surface tension and viscosity, not due surface tension as often postulated.Spohn (1993) As a simple estimate, the interface velocity is typically given by the ratio of surface tension and fluid viscosity, .
A comment has to be made regarding the recent work of Lugli and Zerbetto on MD simulations of nanobubble collapse in ionic solutions. While their MD data of the collapse velocity for a 1nm bubble agree very well with our results their interpretation in terms of the RP equation is different. They fit the ’violent regime’ solution of the RP equation to the data [which is the solution of only the inertial part, left hand side of (1)] and argue that the violent regime still holds on the nm scale. As demonstrated in this work, we arrive to a different conclusion: the collapse is friction dominated, the collapse driving force is mainly capillary pressure, and we suggest that the microscopic viscosity has to be curvature corrected to explain the high curvature collapse behavior in the MD simulations. The good agreement between our modified RP equation and the MD data for different solvent conditions, leading for instance to an altered solvent surface tension or viscosity, support our view.
We finally note that extensions of the LY equation are based on minimizing an appropriate free energy or free energy functional Boruvka and Neumann (1977); Dzubiella et al. (2006a) so that we can write in a more general form . It is highly desirable to generalize this simple dynamics further to arbitrary geometries with which a wide field of potential applications might open up, i.e. an efficient implicit modeling of the water interface dynamics in the nonequilibrium process of hydrophobic nanoassembly, protein docking and folding, and nanofluidics.
Acknowledgements
J. D. thanks Lyderic Bocquet for pointing to the RP equation, Bo Li (Applied Math, UCSD), Roland R. Netz, Rudi Podgornik, and Dominik Horinek for stimulating discussions, and the Deutsche Forschungsgemeinschaft (DFG) for support within the Emmy-Noether-Programme.
References
- Chandler (2005) D. Chandler, Nature 437, 640 (2005).
- Rajamani et al. (2005) S. Rajamani, T. M. Truskett, and S. Garde, PNAS 102, 9475 (2005).
- Poynor et al. (2006) A. Poynor, L. Hong, I. K. Robinson, S. Granick, Z. Zhang, and P. A. Fenter, Phys. Rev. Lett. 97, 266101 (2006).
- Wallquist and Berne (1995) A. Wallquist and B. J. Berne, J. Phys. Chem. 99, 2893 (1995).
- Koishi (2004) T. Koishi, Phys. Rev. Lett. 93, 185701 (2004).
- Giovambattista et al. (2006) N. Giovambattista, P. J. Rossky, and P. D. Debenedetti, Phys. Rev. E 73, 041604 (2006).
- Beckstein and Sansom (2003) O. Beckstein and M. S. P. Sansom, Proc. Nat. Acad. Sci. 100, 7063 (2003).
- Anishkin and Sukharev (2004) A. Anishkin and S. Sukharev, Biophys. J. 86, 2883 (2004).
- Zhou et al. (2004) R. Zhou, X. Huang, C. Margulis, and B. J. Berne, Science 305, 1605 (2004).
- Liu et al. (2005) P. Liu, X. Huang, R. Zhou, and B. J. Berne, Nature 437, 159 (2005).
- ten Wolde and Chandler (2002) P. R. ten Wolde and D. Chandler, Proc. Natl. Acad. Sci. 99, 6539 (2002).
- Huang and Chandler (2000) D. M. Huang and D. Chandler, PNAS 97, 8324 (2000).
- Carambassis et al. (1998) A. Carambassis, L. C. Jonker, P. Attard, and M. W. Rutland, Phys. Rev. Lett. 80, 5357 (1998).
- Helmy et al. (2005) R. Helmy, Y. Kazakevich, C. Ni, and A. Y. Fadeev, J. Am. Chem. Soc. 127, 12446 (2005).
- Jayaraman et al. (2005) K. Jayaraman, K. Okamoto, S. J. Son, C. Luckett, A. H. Gopalani, S. B. Lee, and D. S. English, J. Am. Chem. Soc. 127, 17385 (2005).
- Collins et al. (2005) M. D. Collins, G. Hummer, M. L. Quillin, B. W. Matthews, and S. M. Gruner, PNAS 102, 16668 (2005).
- Huang et al. (2003) X. Huang, C. J. Margulis, and B. J. Berne, PNAS 100, 11953 (2003).
- Dzubiella et al. (2006a) J. Dzubiella, J. M. J. Swanson, and J. A. McCammon, Phys. Rev. Lett. 96, 087802 (2006a).
- Dzubiella et al. (2006b) J. Dzubiella, J. M. J. Swanson, and J. A. McCammon, J. Chem. Phys. 124, 084905 (2006b).
- Brennen (1995) C. E. Brennen, Cavitation and bubble dynamics (Oxford U. Press, New York, 1995).
- Plesset and Prosperetti (1977) M. S. Plesset and A. Prosperetti, Annu. Rev. Fluid. Mech. 25, 577 (1977).
- Spohn (1993) H. Spohn, J. Stat. Phys. 71, 1081 (1993).
- Lugli and Zerbetto (2007) F. Lugli and F. Zerbetto, ChemPhysChem 8, 47 (2007).
- Boruvka and Neumann (1977) L. Boruvka and A. W. Neumann, J. Chem. Phys. 66, 5464 (1977).
- Tolman (1949) R. C. Tolman, J. Chem. Phys. 17, 333 (1949).
- Raviv et al. (2002) U. Raviv, S. Giasson, J. Frey, and J. Klein, J. Phys.: Condens. Matt. 14, 9275 (2002).
- Kuo and Mundy (2004) I. W. Kuo and C. J. Mundy, Science 303, 658 (2004).
- Berendsen et al. (1987) H. J. C. Berendsen, J. R. Grigera, and T. P. Straatsma, J. Phys. Chem. 91, 6269 (1987).
- Alejandre et al. (1995) J. Alejandre, D. J. Tildesley, and G. A. Chapela, J. Chem. Phys. 102, 4574 (1995).
- Huang and Chandler (2002) D. M. Huang and D. Chandler, J. Phys. Chem. B 106, 2047 (2002).
- Hess (2002) B. Hess, J. Chem. Phys. 116, 209 (2002).
- Smith and Forester (1999) W. Smith and T. R. Forester (1999), the DLPOLY_2 User Manual.
- Dünweg and Kremer (1993) B. Dünweg and K. Kremer, J. Chem. Phys. 99, 6983 (1993).
- Bhatt et al. (2004) D. Bhatt, J. Newman, and C. J. Radke, J. Phys. Chem. B 108, 9077 (2004).
- Hai-Lang and Shi-Jun (1996) Z. Hai-Lang and H. Shi-Jun, J. Chem. Eng. Data 41, 516 (1996).
- Smith and van Gunsteren (1993) P. E. Smith and F. van Gunsteren, Chem. Phys. Lett. 215, 315 (1993).
- Bett and Cappi (1965) K. E. Bett and J. B. Cappi, Nature 207, 620 (1965).
- Sengers and Watson (1986) J. V. Sengers and J. T. R. Watson, J. Phys. Chem. Ref. Data 15, 1291 (1986).