Competitive nucleation and the Ostwald rule
in a generalized Potts
model
with multiple metastable phases
Abstract
We introduce a simple nearest-neighbor spin model with multiple metastable phases, the number and decay pathways of which are explicitly controlled by the parameters of the system. With this model we can construct, for example, a system which evolves through an arbitrarily long succession of metastable phases. We also construct systems in which different phases may nucleate competitively from a single initial phase. For such a system, we present a general method to extract from numerical simulations the individual nucleation rates of the nucleating phases. The results show that the Ostwald rule, which predicts which phase will nucleate, must be modified probabilistically when the new phases are almost equally stable. Finally, we show that the nucleation rate of a phase depends, among other things, on the number of other phases accessible from it.
pacs:
64.60.My, 64.60.Qb, 05.10.Ln, 05.50.+qMetastability is a ubiquitous phenomenon in nature. Broadly speaking, it occurs when a system is “trapped” in a phase different from equilibrium. This non-equilibrium phase, the metastable state, can last for extremely long times. Thus, it is not surprising that metastable states play a crucial role in many physical processes and are at the center of much current research. For example, recently an intermediate metastable phase was shown to provide an easier pathway for the growth of crystal nuclei from fluids (nucleation), with implications for the crystallization of proteins Lutsko and Nicolis (2006); ten Wolde and Frenkel (1997). Proteins themselves are known to get stuck in misfolded metastable structures Takada and Wolynes (1997), preventing them from reaching their equilibrium configuration. The phenomenology observed in these and in many other systems can be thought of as arising from a complicated energy landscape, with several local “metastable minima” where the trapping occurs Wales (2003). The extreme situation is that of glasses, in which the energy landscape can have extemely many local minima hindering relaxation of the system to a thermodynamically stable crystal Biroli and Kurchan (2001).
The above systems present at least several metastable states. These states and the transitions between them usually arise from the microscopic interactions in a complicated way. When this is the case, the study of phenomena such as competition between nucleating phases and specific nucleation pathways may be obscured. In view of this, in this work we present a simple spin model with nearest-neighbour interactions, where the number of metastable phases and the decay pathways between them can be explicitly specified by varying the model parameters. It thus serves as a test-bed for theoretical results relating to systems with multiple metastable phases Bovier et al. (2002); Gaveau and Schulman (2006); Larralde et al. (2006), just as the kinetic Ising model, a special case of our model, has been central in the study of systems with a single metastable phase Rikvold et al. (1994). As discussed below, the model also describes the adsorption of multiple chemical species onto a surface, an interesting physical problem in its own right.
After presenting the model, as an illustration of a possible application, we construct a system with arbitrarily long successions of metastable states. We then focus on competition between phases nucleating from a single initial metastable phase. An important question in this context is to understand which phases nucleate under which conditions. The Ostwald rule states that the nucleating phase is the one with the smallest free energy barrier from the initial phase: see Ref. ten Wolde and Frenkel (1999) and references therein. Previous results have supported this prediction Sear (2005).
We show that in general the Ostwald rule must be modified probabilistically when the new phases are of similar stability, using an argument based on individual nucleation rates of each phase. We give a method by which these rates can be measured in simulations or experiments, and show that there is a parameter regime in which any of the new phases may nucleate—only the nucleation probability of each phase can be established, with the outcome in any given run being unpredictable. We finally show that the nucleation probability of a phase depends on the phases accessible from it.
Model details:-
Our model is based on the Potts model, in which each spin has one of states Wu (1982) and each phase has a majority of spins in one state; the Ising model corresponds to . The relative stability of each phase is controlled by external fields, and the interplay of these fields with interactions between different spin states allows us to obtain any desired transition pathways between phases.
Viewing the fields as chemical potentials, we can recast the model as a multi-component lattice gas which describes adsorption on a lattice substrate (e.g., a crystal plane) of multiple chemical species with lateral interactions Rikvold et al. (1988). Much experimental work has been done on the thermodynamics of such systems, but little on the kinetics—see Manzi et al. (2004) and references therein; nonetheless, our results should be testable in that context. A more complicated system where the kinetics has been characterized is a colloid–polymer system Poon et al. (1999); Renth et al. (2001), where possible pathways were found from considerations of the free energy landscape Evans et al. (2001). Our approach is complementary in that specific pathways result from microscopic interactions.
We work on an square lattice with spins and periodic boundary conditions, although the results are qualititavely unaffected by lattice type. Each lattice site has a spin taking values in , and the energy of a configuration is given by the Hamiltonian
| (1) |
Here, is the magnetisation (number of spins) of the spin type ; if , and otherwise. The first term is a sum over nearest-neighbor pairs of spins of a symmetric interaction energy , and the second describes the effect of external fields acting on spin type .
We set the diagonal elements of the interaction matrix to unity ( for all ), so that in the absence of non-diagonal interactions and fields, the model reduces to the standard Potts model Wu (1982). This has symmetrical phases coexisting below a critical temperature ; each phase has a majority of spins in one of the spin states. Including fields breaks the symmetry between phases. If , then the and phases coexist, with a first-order phase transition between them, for ; this is at the origin of metastability. Weak non-diagonal interactions do not qualititavely affect this coexistence.
To evolve the system we choose discrete-time Metropolis dynamics Newman and Barkema (1999): at each time step, a spin and its new value are chosen at random, the increment of the Hamiltonian (1) for this change is calculated, and the update is accepted with probability , where is the inverse temperature. This gives a Markov chain on the space of all possible configurations.
This Markov chain has a unique equilibrium distribution, concentrated on the phase(s) with the largest . The other phases are metastable, that is, when started in such a phase , the system stays there for some time, before a transition to a more stable phase is nucleated by the appearance of a critical droplet of the phase. At sufficiently low temperatures, the relative stability is determined by . The reverse transition is exponentially unlikely.
In the standard Potts model, the equilibrium phase (almost) always nucleates. To obtain non-trivial transition pathways, nucleation of other phases must be promoted. This we achieve using non-diagonal interactions between distinct spin types : setting favors nucleation of droplets inside the phase by lowering the surface tension between and regions, and hence decreasing the droplet free energy of formation (nucleation barrier), whereas formation of droplets in the phase is suppressed if .
We can now construct models whose phases obey arbitrary metastable transition graphs. These are directed graphs with the restriction that no loops returning to a previously visited phase are allowed. Each vertex corresponds to one phase, labeled by its dominant spin state, and each arrow to a desired transition: means that phase can nucleate directly from phase . Fig. 1 shows example transition graphs.
To construct a model corresponding to a given transition graph, we proceed as follows. The number of spin types, , is the number of vertices in the graph. To each spin type we assign a field , with if is below in the graph. The off-diagonal interactions are given by (attractive) if , and (repulsive) otherwise. must be large enough to inhibit immediate formation of non-adjacent phases with large fields.

As an illustration, we construct a model exhibiting a linear succession of metastable phases with transition graph . We impose fields and attractive interactions between neighbouring states, and set all other non-diagonal interactions to . With suitable, moderately robust, parameters, we observe the desired behavior, shown for in Fig. 2.
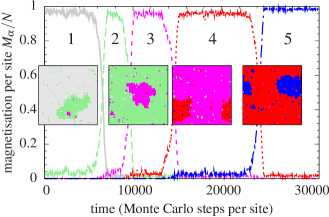
A three-phase succession was previously observed in a kinetic Blume–Capel model Cirillo and Olivieri (1996); Fiig et al. (1994), corresponding to a special case of our model with Sanders et al. . The physical reason for the observed transitions is, however, much more transparent with the Hamiltonian in the form (1), with its intuitive interpretation in terms of attractive and repulsive interactions.
Competitive nucleation:-
We now turn to the decay of one metastable phase into two competing phases (Fig. 1(c)). Sear studied competitive heterogeneous nucleation (occurring on impurities) in the -state standard Potts model Sear (2005). In contrast, all behaviors discussed in this work are endogenous: observed transitions are not caused by external influences, but rather arise spontaneously from within the system itself.
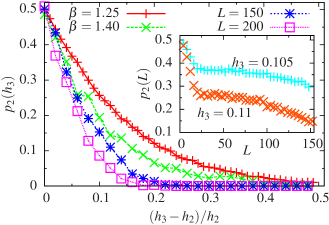
We fix , and . Let be the field difference between the new phases, and . When , these phases are symmetrical, each nucleating half of the time, while for , we expect the – free energy barrier to be lower than the – one, so that according to the Ostwald rule, only phase should nucleate. To test this, we perform simulations starting from phase for each , in of which phase nucleates before phase . The ratio is then an estimate of the probability that phase nucleates first. For efficiency, we use a rejection-free version of the Metropolis method Novotny (1995); Sanders et al. .
Fig. 3 plots as a function of a non-dimensionalised . For sufficiently close to , phase can still nucleate first, contrary to the simple Ostwald rule. The probability that it does so rapidly decreases for larger , until a point beyond which phase effectively always nucleates.
To explain these results in a general context, we assume, as in classical nucleation theory Debenedetti (1996), that there are well-defined nucleation rates of phases , giving the number of critical nuclei which form per unit time in a system of size . The nucleation rates per site are .
A nucleation rate is the inverse of a mean nucleation time, which can be measured in experiments or simulations by averaging over many nucleation events in independent runs. In the case of competitive nucleation, however, we can only measure the mean time for the first phase to nucleate, after which this phase invades the entire system. The rate of this first nucleation is , since the total number of nucleation events per unit time is the sum of those for each type, so that . For convenience, in simulations is taken to be the time until the new phase occupies half the system.
Under the same assumptions, the probability that phase nucleates first is , where , the time for phase to nucleate, is an exponentially distributed random variable with mean . This gives .
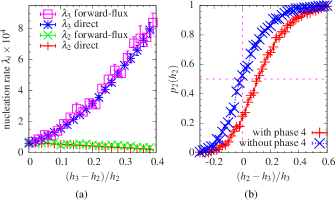
Individual nucleation rates of the two phases, which cannot be obtained directly, can now be calculated as: and . This generalizes to competing phases, where the measurable quantities are the mean nucleation time and the nucleation probabilities of each phase . The nucleation rate of phase is then .
Figure 4(a) shows and calculated in this way. To confirm the validity of such calculations, we use the “forward-flux sampling” method Allen et al. (2005, 2006), which directly calculates the transition rate between two phases in a stochastic system. This has previously been used to study nucleation rates in the Ising model Sear (2006); Page and Sear (2006). In our case, the possibility of escape to an additional new phase must be taken into account Sanders et al. . Figure 4(a) shows that the results indeed coincide with those of the direct method, within statistical errors. We remark that we are unaware of any analytical prediction giving the observed variation of nucleation rates.
The above considerations used “in reverse” confirm that the Ostwald rule must in general be modified when the new phases have similar stabilities, as follows. Consider phases which are equally stable for given parameter values. We expect nucleation barriers, and hence nucleation rates, to vary continuously with the parameters, so that the nucleation probabilities also vary continuously. Hence there is a region, where the phases have similar stabilities, in which all nucleation probabilities are non-zero—only the probability of each phase nucleating is well-defined, with the outcome in any given run being stochastic, as in Fig. 3. The definite prediction given by the Ostwald rule is thus invalid in this region.
To see how our results depend on system size , we note that in a broad region of , the per-site nucleation rates , and hence also the , are independent of , as confirmed by the plateaus in the inset of Fig. 3. This is valid when the nucleation process is mediated by growth of a single droplet Rikvold et al. (1994). Note that this regime may be of relevance for macroscopically large systems Rikvold et al. (1994).
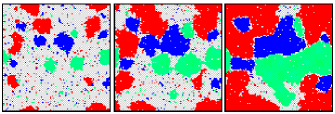
Above a certain system size, however, droplets of different phases may nucleate before any dominates the system (the ‘multidroplet’ regime) Rikvold et al. (1994). This results in coarsening, as shown in Fig. 5 for three competing phases of equal stability. Even if a phase- droplet nucleates first, droplets of a more-stable phase may then nucleate and grow to dominate the system before the phase can do so, thus reducing , as seen in Fig. 3.
Finally, a generic non-symmetric case can be obtained by adding a new phase, , and a decay path, , as in Fig. 1(d). Even when , phase now nucleates more often, as shown by the horizontally displaced nucleation probability curve in Fig. 4(b): the presence of phase reduces by roughly half. This is due to an entropic effect: there are more -dominated critical droplets than -dominated ones, since spins of type also appear in the former droplets, resulting in nucleation of a binary mixture Debenedetti (1996); a similar effect is visible in Fig. 1. There is thus a lower free energy barrier to form phase , and yet nucleation of both phases and is still observed, again at odds with the simple Ostwald rule.
In summary, we have introduced a generalized Potts model which can easily be tuned to have any given number of metastable phases and arbitrary transitions between them. We have shown generally that individual nucleation rates of competitively nucleating phases can be calculated from experimentally measurable quantities, and that the Ostwald rule must be modified when the nucleating phases have comparable stabilities. In future work Sanders et al. , we will study the model in detail and compare its properties with theoretical results Larralde et al. (2006) on systems with multiple metastable phases.
DPS thanks A. Huerta for useful discussions and the Universidad Nacional Autónoma de México for financial support. The financial support of DGAPA-UNAM project PAPIIT IN112307 is also acknowledged.
References
- Lutsko and Nicolis (2006) J. F. Lutsko and G. Nicolis, Phys. Rev. Lett. 96, 046102 (2006).
- ten Wolde and Frenkel (1997) P. R. ten Wolde and D. Frenkel, Science 277, 1975 (1997).
- Takada and Wolynes (1997) S. Takada and P. G. Wolynes, Phys. Rev. E 55, 4562 (1997).
- Wales (2003) D. Wales, Energy Landscapes (Cambridge University Press, Cambridge, 2003).
- Biroli and Kurchan (2001) G. Biroli and J. Kurchan, Phys. Rev. E 64, 016101 (2001).
- Bovier et al. (2002) A. Bovier, M. Eckhoff, V. Gayrard, and M. Klein, Comm. Math. Phys. 228, 219 (2002).
- Gaveau and Schulman (2006) B. Gaveau and L. S. Schulman, Phys. Rev. E 73, 036124 (2006).
- Larralde et al. (2006) H. Larralde, F. Leyvraz, and D. P. Sanders, J. Stat. Mech. 2006, P08013 (2006).
- Rikvold et al. (1994) P. A. Rikvold, H. Tomita, S. Miyashita, and S. W. Sides, Phys. Rev. E 49, 5080 (1994).
- ten Wolde and Frenkel (1999) P. R. ten Wolde and D. Frenkel, Phys. Chem. Chem. Phys. 1, 2191 (1999).
- Sear (2005) R. P. Sear, J. Phys. Cond. Matt. 17, 3997 (2005).
- Wu (1982) F. Y. Wu, Rev. Mod. Phys. 54, 235 (1982).
- Rikvold et al. (1988) P. Rikvold, J. Collins, G. Hansen, and J. Gunton, Surf. Sci. 203 (1988).
- Manzi et al. (2004) S. Manzi, W. Mas, R. Belardinelli, and V. Pereyra, Langmuir 20, 499 (2004).
- Poon et al. (1999) W. C. K. Poon, F. Renth, R. M. L. Evans, D. J. Fairhurst, M. E. Cates, and P. N. Pusey, Phys. Rev. Lett. 83, 1239 (1999).
- Renth et al. (2001) F. Renth, W. C. K. Poon, and R. M. L. Evans, Phys. Rev. E 64, 031402 (2001).
- Evans et al. (2001) R. M. L. Evans, W. C. K. Poon, and F. Renth, Phys. Rev. E 64, 031403 (2001).
- Newman and Barkema (1999) M. E. J. Newman and G. T. Barkema, Monte Carlo Methods in Statistical Physics (Oxford University Press, New York, 1999).
- Cirillo and Olivieri (1996) E. N. M. Cirillo and E. Olivieri, J. Stat. Phys. 83, 473 (1996).
- Fiig et al. (1994) T. Fiig, B. M. Gorman, P. A. Rikvold, and M. A. Novotny, Phys. Rev. E 50, 1930 (1994).
- (21) D. P. Sanders, H. Larralde, and F. Leyvraz, (in preparation).
- Novotny (1995) M. A. Novotny, Phys. Rev. Lett. 74, 1 (1995).
- Debenedetti (1996) P. G. Debenedetti, Metastable Liquids (Princeton University Press, Princeton, 1996).
- Allen et al. (2005) R. J. Allen, P. B. Warren, and P. R. ten Wolde, Phys. Rev. Lett. 94, 018104 (2005).
- Allen et al. (2006) R. J. Allen, D. Frenkel, and P. R. ten Wolde, J. Chem. Phys. 124, 024102 (2006).
- Sear (2006) R. P. Sear, J. Phys. Chem. B 110, 4985 (2006).
- Page and Sear (2006) A. J. Page and R. P. Sear, Phys. Rev. Lett. 97, 065701 (2006).