Smooth and Starburst Tidal Tails in the GEMS and GOODS Fields
Abstract
GEMS and GOODS fields were examined to 1.4 for galaxy interactions and mergers. The basic morphologies are familiar: antennae with long tidal tails, tidal dwarfs, and merged cores; M51-type galaxies with disk spirals and tidal arm companions; early-type galaxies with diffuse plumes; equal-mass grazing-collisions; and thick J-shaped tails beaded with star formation and double cores. One type is not common locally and is apparently a loose assemblage of smaller galaxies. Photometric measurements were made of the tails and clumps, and physical sizes were determined assuming photometric redshifts. Antennae tails are a factor of smaller in GEMS and GOODS systems compared to local antennae; their disks are a factor of smaller than locally. Collisions among early type galaxies generally show no fine structure in their tails, indicating that stellar debris is usually not unstable. One exception has a M⊙ smooth red clump that could be a pure stellar condensation. Most tidal dwarfs are blue and probably form by gravitational instabilities in the gas. One tidal dwarf looks like it existed previously and was incorporated into the arm tip by tidal forces. The star-forming regions in tidal arms are to times more massive than star complexes in local galaxies, although their separations are about the same. If they all form by gravitational instabilities, then the gaseous velocity dispersions in interacting galaxies have to be larger than in local galaxies by a factor of or more; the gas column densities have to be larger by the square of this factor.
1 Introduction
Galaxy interactions and mergers are observed at all redshifts and play a key role in galaxy evolution. Two percent of local galaxies are interacting or merging (Athanassoula & Bosma 1985; Patton et al. 1997), and this fraction is larger at high redshift (e.g., Abraham et al. 1996b; Neuschaefer et al. 1997 ; Conselice et al. 2003; Lavery et al. 2004; Straughn et al. 2006; Lotz et al. 2006, and others). Conselice (2006a) estimates that massive galaxies have undergone about 4 major mergers by redshift 1. Toomre (1977) described a sequence of merger activity ranging from separated galaxies with tails and a bridge between them, to double nuclei in a common envelope with tails, to merged nuclei with tails. Ground-based (Hibbard & van Gorkom 1996) and space-based (Laine et al. 2003; Smith et al. 2007) observations of this sequence show optical, infrared, and radio activity in the tails and nuclei.
High resolution images and numerical simulations of nearby interactions demonstrate how star formation and morphology are affected. General reviews of interaction simulations are given by Barnes & Hernquist (1992) and Struck (1999). The initial galaxy properties, such as mass, rotational velocity, gas content and dark matter content, and their initial separations and velocity vectors, all play a role in generating structure. The viewing angle also affects the morphology. Early-type galaxies with little gas are expected to display smooth plumes and shells, while spiral interactions and mergers should exhibit clumpy star formation along tidal tails, and condensations of material at the tail ends. Equal mass companions may show bridges between them. A prominent example of a tidal interaction is the Antennae (NGC4038/9), a merging pair of disk galaxies with rampant star formation in the central regions, including young globular clusters (Whitmore et al. 2005). Its interaction was first modeled by Toomre & Toomre (1972). The Cartwheel galaxy is a collisional ring system rimmed with star formation from a head-on collision (Struck et al. 1996). Sometimes polar-ring or spindle galaxies are the result of perpendicular collisions (Struck 1999). The Mice (NGC 4676) has a long narrow straight tail and a curved tidal arm (Vorontsov-Velyaminov 1957; Burbidge & Burbidge 1959); numerical simulations reproduce both features well in a model with a halo:(disk+bulge) mass ratio of 5 (Barnes 2004). The Superantennae (IRAS 19254-7245) is a pair of infrared-luminous merging giant galaxies having Seyfert and starburst nuclei and kpc tails with a tidal tail dwarf (Mirabel, Lutz, & Maza, 1991). The Leo Triplet includes NGC 3628 with an 80 kpc stellar tail containing star-forming complexes with masses up to M⊙ (Chromey et al. 1998). The Tadpole galaxy UGC10214 (Tran et al. 2003; de Grijs et al. 2003; Jarrett et al. 2006), the IC2163/NGC2207 pair (Elmegreen et al. 2001, 2006), and Arp 107 (Smith et al. 2005) are all interacting systems observed with HST and SST and modeled in simulations. Many local mergers have intense nuclear activity, such as the Seyfert galaxy NGC 5548, which also has an 80 kpc long, low surface brightness (V=27-28 mag arcsec-2) tidal tail and a 1-arm diffuse spiral (Tyson et al. 1998).
The GEMS (Galaxy Evolution from Morphology and SEDs; Rix et al. 2004), GOODS (Great Observatories Origins Deep Survey; Giavalisco et al. 2004), and UDF (Ultra Deep Field; Beckwith et al. 2006) surveys done with the HST ACS (Hubble Space Telescope Advanced Camera for Surveys) have enabled high resolution studies of the morphology of intermediate and high redshift galaxies. Light distribution parameters such as the Gini coefficient (Lotz et al. 2006) and concentration index, asymmetry, and clumpiness (CAS; Conselice 2006) have been applied to galaxies in these fields to study possible merger systems. For GEMS and GOODS, John Caldwell of the GEMS team has posted images (archive.stsci.edu/prepds/gems/datalist.html) of several galaxies from each field, including peculiar and interacting systems with tails and bridges. Here we examine the entire GEMS and GOODS fields systematically for such galaxies and study their tails, bridges, and star-forming regions. Their properties are useful for understanding interactions and interaction-triggered star formation, and for probing the relative dark matter content (e.g., Dubinski, Mihos, & Hernquist 1999).
2 The Sample of Interactions and Mergers
The GOODS and GEMS images from the public archive were used for this study. They include exposures in 4 filters for GOODS: F435W (B435), F606W (V606), F775W (i775), and F850LP (z850); and 2 filters (V606 and z850) for GEMS. The public images were drizzled to produce final archival images with a scale of 0.03 arcsec per px. GEMS, which incorporates the southern GOODS survey (Chandra Deep Field South, CDF-S) in the central quarter of its field, covers 28 arcmin x 28 arcmin; there are 63 GEMS and 18 GOODS images that make up the whole field. The GOODS images have a limiting AB mag of V606= 27.5 for an extended object, or about two mags fainter than the GEMS images. There are over 25,000 galaxies catalogued in the COMBO-17 survey (Classifying Objects by Medium-Band Observations, a spectrophotometric 17-filter survey; Wolf et al. 2003), and 8565 that are cross-correlated with the GEMS survey (Caldwell et al. 2005).
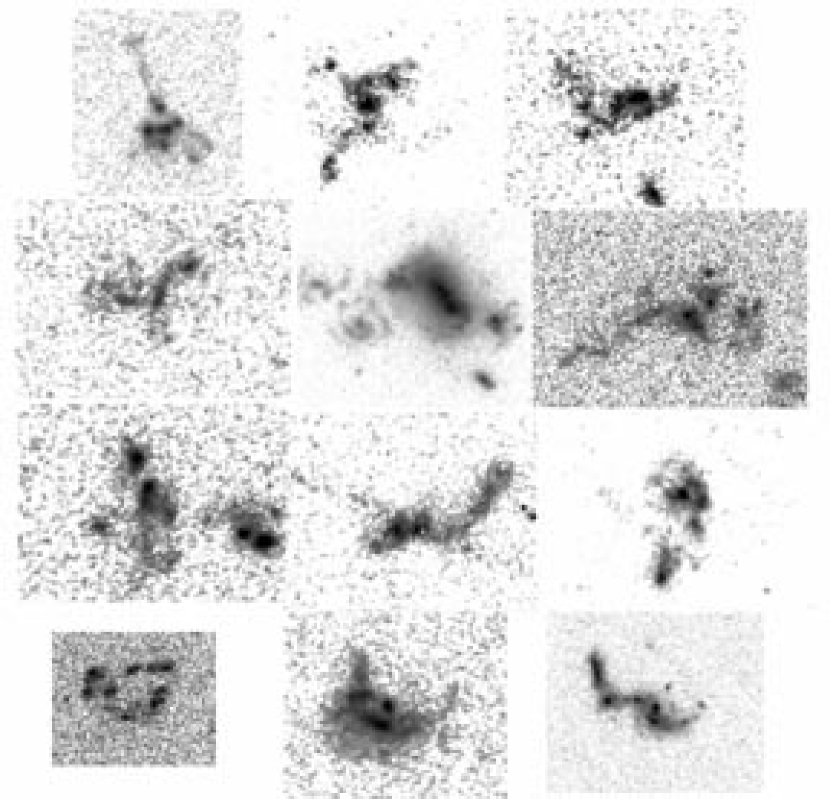
Interacting galaxies with tails, bridges, diffuse plumes and other features were identified by eye on the online Skywalker images and examined on high resolution fits images. The lower limit to the length of detectable tails is about 20 pixels. Snapshots of several different morphologies for interacting galaxies are shown in Figures 1-6. Out of an initial list of about 300 galaxies, a total of 100 best cases are included in our sample: 14 diffuse types, 18 antennae types, 22 M51 types, 19 shrimp types, 15 equal mass interactions, and 12 assemblies, as we describe below.
GEMS and GOODS galaxy redshifts were obtained from the COMBO-17 list (Wolf et al. 2003). Our sample ranges from redshift to 1.4 in an area of square arcsec. The linear diameters of the central objects were determined from their angular diameters and redshifts using the appropriate conversion for a CDM cosmology (Carroll et al., 1992; Spergel et al., 2003). The range is to 33 kpc. Projected tail lengths were measured in a straight line from the galaxy center to the 2 noise limit (25.0 mag arcsec-2) in the outer tail.
Photometry was done on the whole galaxies, on each prominent star-forming clump, and on the tails using the IRAF task imexam. A box of variable size was defined around each feature; the outer limits of the boxes were chosen to be where the clump brightness is about 3 times the surrounding region. Sky subtraction was not done because the background is negligible. The photometric errors are 0.1-0.2 mag for individual clumps. The V606 surface brightnesses of the tidal tails were determined using imagej (Rasband 1997) to trace freehand contours around the tails, so that they could be better defined than with rectangular or circular apertures.
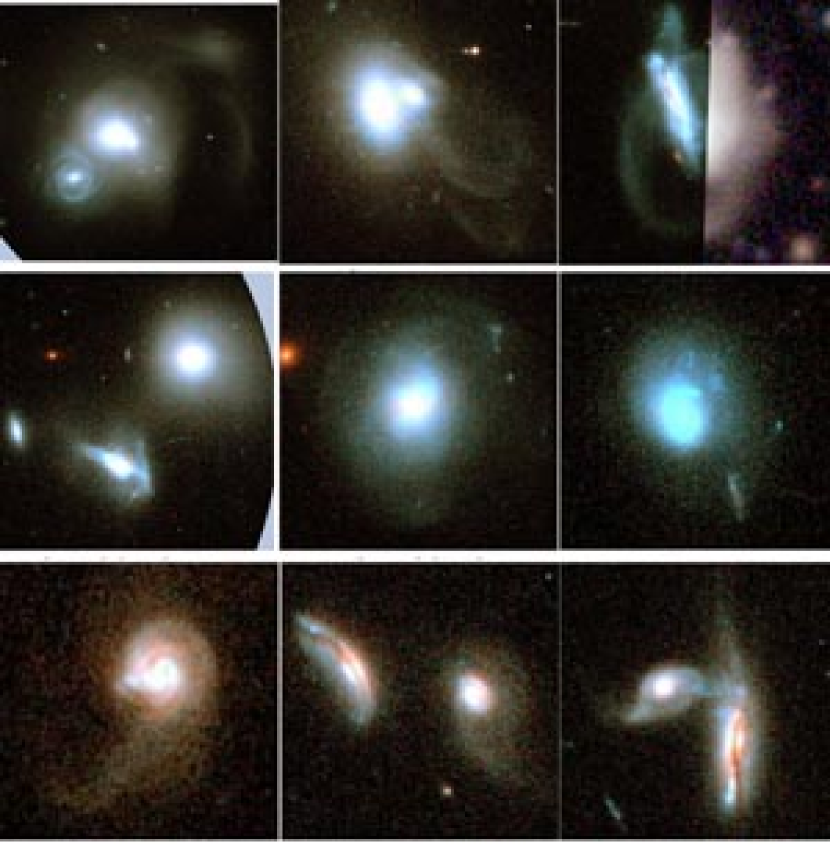
Figure 1 shows galaxies with diffuse plumes and either no blue star formation patches or only a few tiny patches (e.g., galaxies number 5 and 6); we refer to these interactions as diffuse types. The colors of the plumes match the colors of the outer parts of the central galaxies, indicating the plumes are tidally shorn stars with little gas. There is structure in most of the plumes consisting of arcs or sharp edges. This is presumably tidal debris from early type galaxies with little or no gas (e.g. Larson & Tinsley 1978; Malin & Carter 1980; Schombert et al. 1990). This type of interaction is relatively rare in the GEMS and GOODS images, perhaps because the tidal debris is faint. The best cases are shown here and they all have relatively small redshifts compared to the other interaction types (the average is 0.23 and the maximum is 0.69).
The image in the top left panel of Figure 1 (galaxy 1) has a giant diffuse clump in the upper right corner. This could be a condensation in the tidal arm, or it could be another galaxy. In either case, it has the same color as the rest of the tidal arm nearby. That is, for the clump and also in six places along the tail; the color is essentially the same, , in the core of the galaxy. The absolute magnitude of the clump is for redshift . The mass is M⊙ (Sect. 3.2). If this clump is a condensation in the tail, then it could be a rare case where a pure stellar arc has collapsed gravitationally into a gas-free tidal dwarf. The final result could be a dwarf elliptical. Usually tidal dwarfs form by gaseous condensations in tidal arms (Wetzstein, Naab, & Burkert 2007).
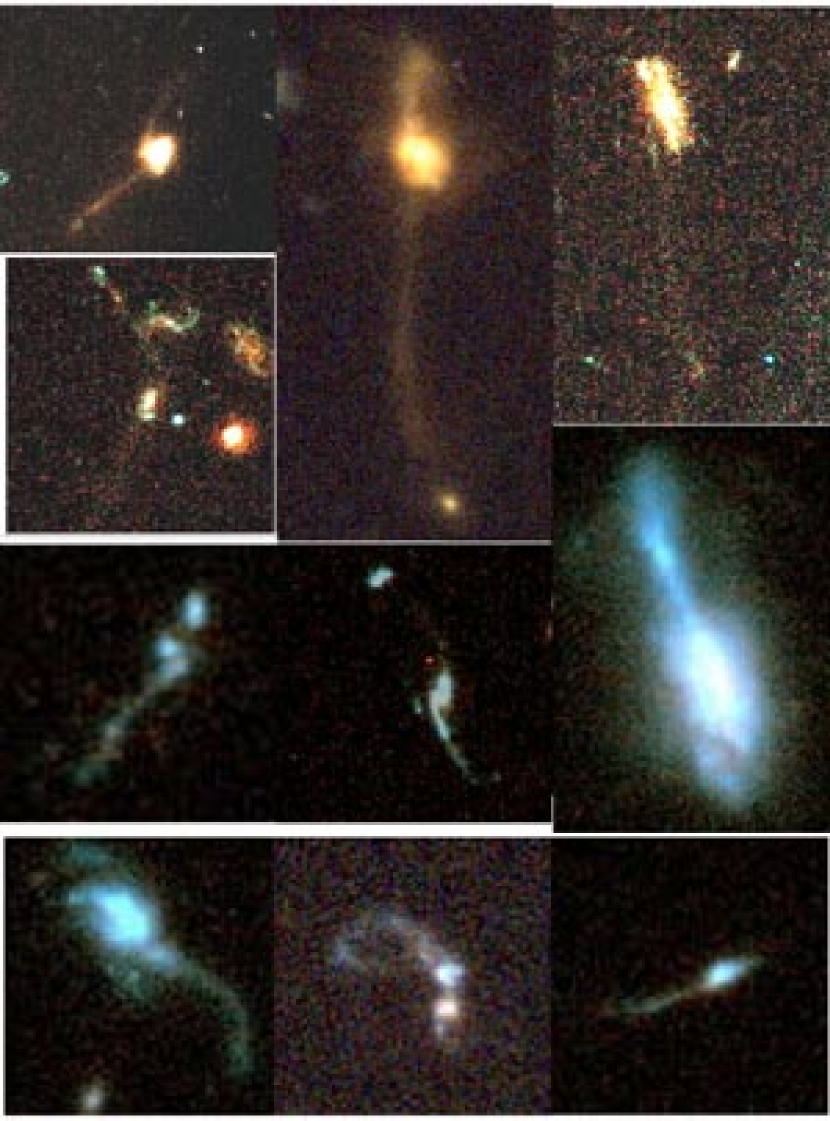
Figure 2 shows interactions that resemble the local Antennae pair, so we refer to them as antennae types. These types have long tidal tails and double nuclei or highly distorted centers that appear to be mergers of disk galaxies. Note that antennae are not the same as “tadpole” galaxies (Elmegreen et al. 2005a; de Mello et al. 2006; Straughn et al. 2006), which have one main clump and a sometimes wiggly tail that may contain smaller clumps. Some antennae have giant clumps near the ends of the tails which could have formed there (galaxies 16 and 17) and are analogous to the clump at the end of the Superantennae (Mirabel et al. 1991). Galaxy 18 is in a crowded field with at least two long tidal arms; here we consider only the tail system in the north, which is in the upper part of the figure. These long-tail systems are relatively rare and all the best cases are shown in the figure; their average redshift, 0.70, is typical for GEMS and GOODS fields. Galaxy 24 is somewhat like a tadpole galaxy, but its very narrow tail and protrusion on the anti-tail side of the main clump are unlike structures seen in tadpoles of the Ultra Deep Field.
For the antennae galaxies in Figure 2, the tails have an average (V-z) color that is negligibly bluer, 0.100.25 mag, than the central disks. In a study of tidal features in local Arp atlas galaxies, Schombert et al. (1990) also found that the tail colors are uniform and similar to those of the outer disks. They noted that the most sharply-defined tails are with spiral systems and the diffuses plumes are with ellipticals. This correlation may be true here also, but it is difficult to tell from Figure 1 whether the smooth distorted systems are intrinsically disk-like.
Galaxy 20 in Figure 2 is an interesting case. It has an elliptical clump at the end of its tail that could be one of the collision partners. There are two central galaxy cores, however, and their interaction may have formed the tidal arms without this companion. Furthermore, the clump at the tip is aligned perpendicular to the tail, which is unusual for a tidal dwarf. Thus it is possible that the clump was a pre-existing galaxy lying in the orbital plane of one of the larger galaxies now at the center. Presumably this former host is the galaxy currently connected to the dwarf by the tidal arm. The interaction could have swung it around to its current position at the tip. A similar case occurs for the local IC 2163/NGC 2207 pair, which has a spheroidal dwarf galaxy at the tip of its tidal arm (Elmegreen et al. 2001). Such swing-around dwarfs should have the same dynamical origin as the large pools of gas and star formation that are at the tips of superantenna-type galaxies; i.e. the whole outer disk moves to this position during the interaction (Elmegreen et al. 1993; Duc et al. 1997).
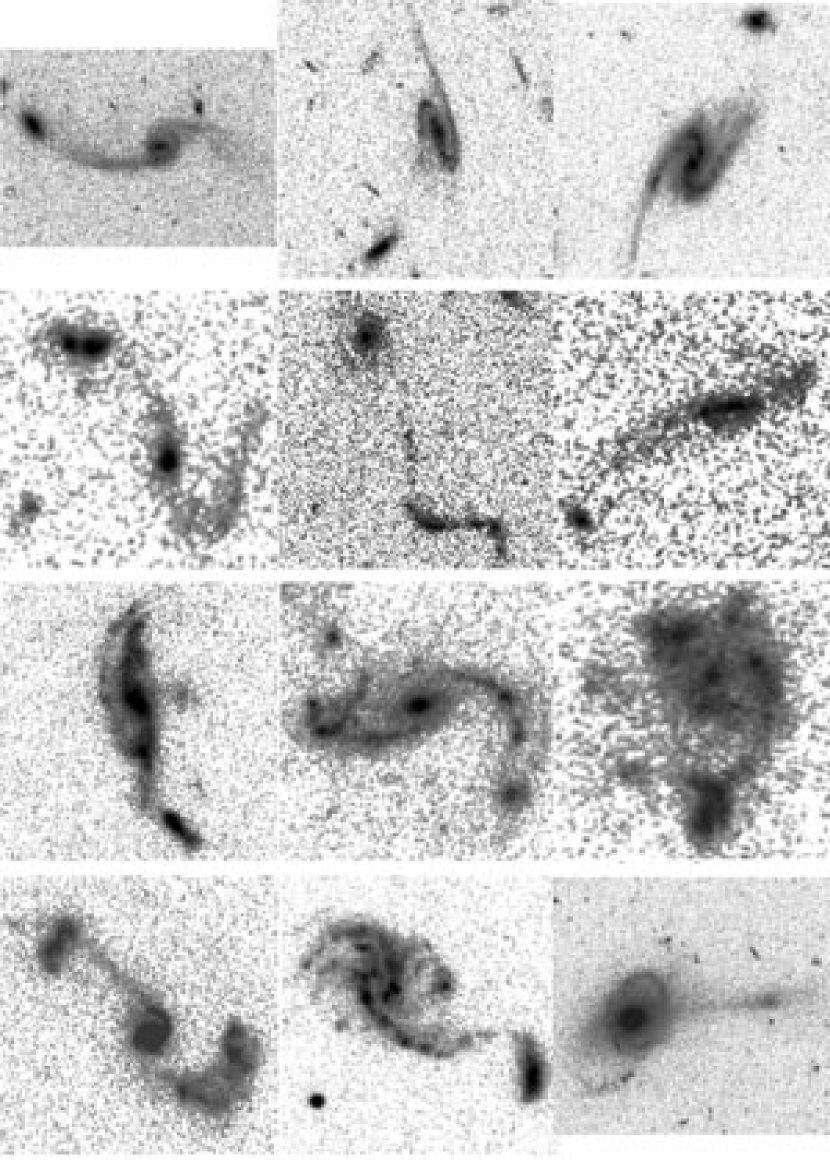
Figure 3 shows examples of interactions that we refer to as M51-type galaxies, where the tidal arms can be bridges that connect the main disk galaxy to the companion (galaxy 33), or tails on the opposite side of the companion (e.g., galaxies 34 and 35), or both (galaxy 36). In galaxy 44, the tidal arm looks like the debris path of a pre-existing galaxy that lies at the right; the orbit path apparently curves around on the left. The M51-types usually have strong spirals in the main disk. In the top row, the tails and bridges are thin and diffuse. The galaxy on the left in the lower row (galaxy 42) has a thick, fan-shaped tail opposite the companion. Some bridges have star formation clumps (galaxy 40) and others appear smooth (galaxy 33). Interactions like this, especially those with small companions, are more common than the previous two types and only a few best cases are shown in Figure 3 and discussed in the rest of this paper.
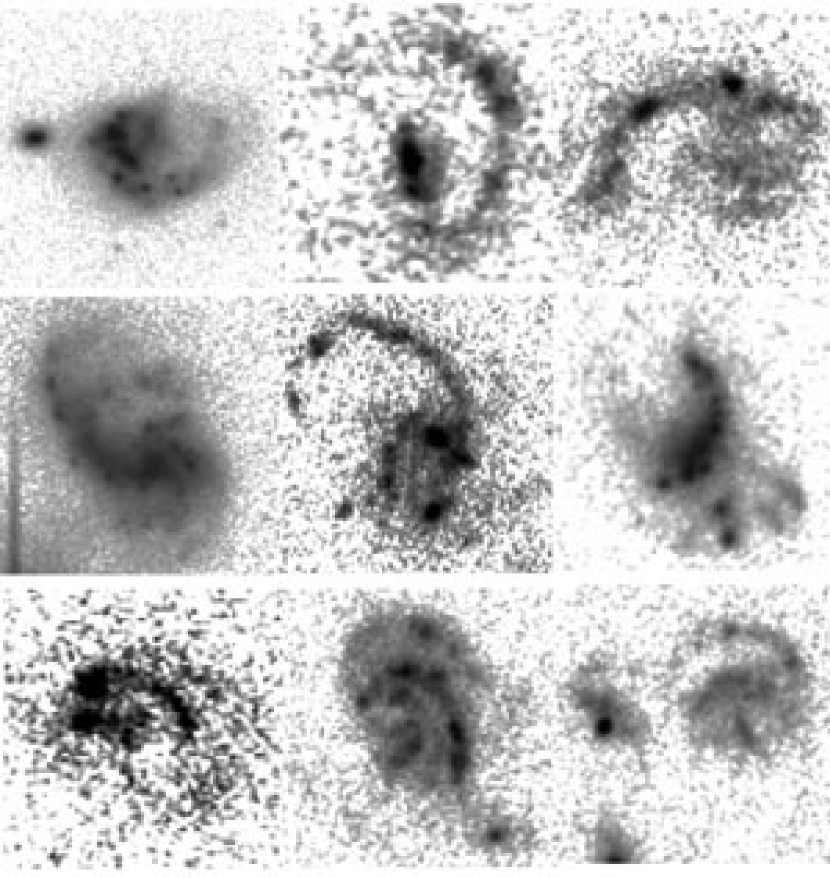
Figure 4 shows examples of galaxies dominated by one highly curved, dominant arm and large, regularly-spaced clumps of star formation. We call these “shrimp” galaxies because of their resemblance to the tail of a shrimp. Although their star formation indicates they contain gas and therefore are disk systems, there are no well-defined spirals (except for the prominent arm), merging cores, or obvious central nuclei. The clumps resemble the beads-on-a-string star formation in spiral density waves and probably have the same origin, a gravitational instability (Elmegreen & Elmegreen 1983; Kim & Ostriker 2006; Bournaud, Duc, & Masset 2003). The J-shaped morphology is reminiscent of the 90 kpc gas tail of M51 (Rots et al. 1990) and the 48 kpc gas tail observed in NGC 2535 (Kaufman et al. 1997). Rots el al. point out that the M51 gas tail is much broader (10 kpc) than the narrow tails seen in merging systems like the Antennae. The broad tail in galaxy 42 (Fig. 3) is similar to the M51 tail. Sometimes there is a bright tail with no obvious companion (galaxies 56, 57, and 60); one of these, galaxy 56, was in our ring galaxy study (Elmegreen & Elmegreen 2006). Asymmetric, strong arm galaxies like this are not common in GEMS and GOODS; this figure shows the best cases.
Figure 5 has a selection of irregular galaxies that appear to be interactions. Most of them suggest an assembly of small pieces, so we refer to them as assembly types. If they were slightly more round in overall shape, with more obvious interclump emission, then we would classify them as clump-clusters, as we did in the UDF (Elmegreen et al. 2005a). The galaxy in the lower left (galaxy 83) is like this. The resemblance of these types to clump-clusters suggests that some of the clumps are accreted from outside the disk and others form from gravitational instabilities in a pre-existing gas disk, as suggested previously (Elmegreen & Elmegreen 2005). The system in the lower right (galaxy 85) could be interacting spirals, or a triple system, or a bent chain (as studied in Elmegreen & Elmegreen 2006). There are many examples of highly irregular galaxies like these in the GEMS and GOODS fields; indeed most galaxies at are peculiar in this sense (Conselice 2005). In what follows, we discuss only these 12 galaxies.
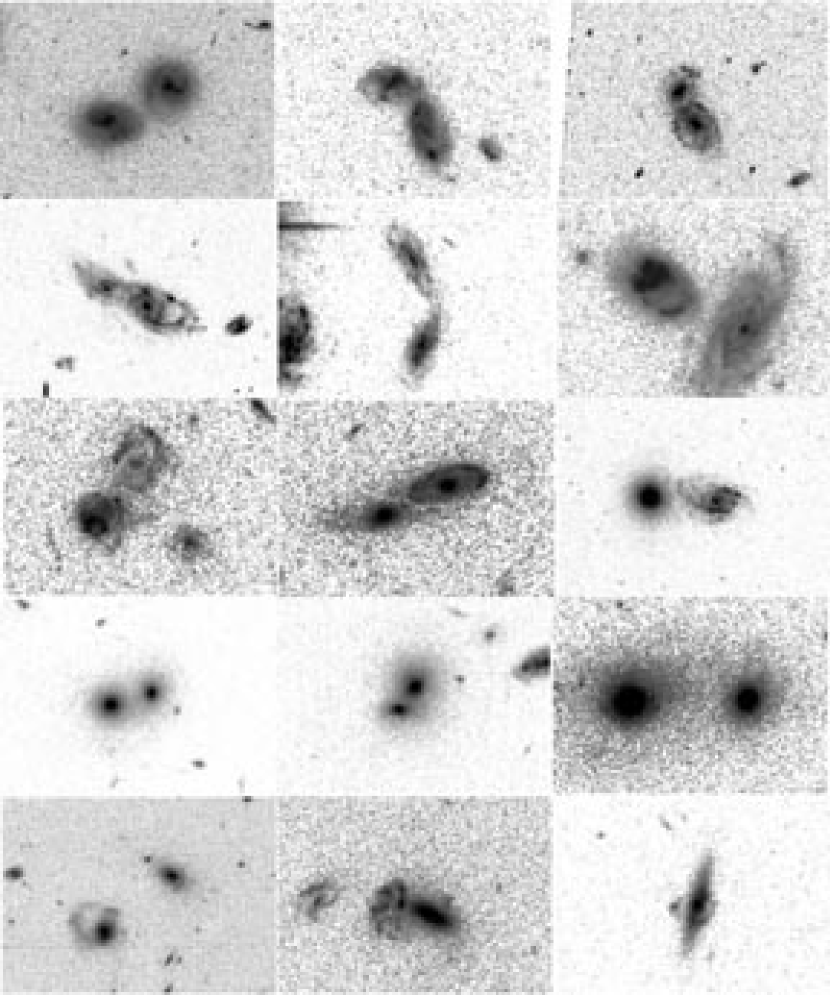
Figure 6 has samples of grazing or close interactions, with spirals at the top of the page (numbers 86-93), ellipticals lower down (numbers 95-97) and two polar-ring galaxies (numbers 99 and 100) in the lowest row at the middle and right bottom. We refer to these paired systems as “equals” because their distinguishing feature is that the two galaxies have comparable size. The pair number 89 has a bright oval in the smaller galaxy, which is characteristic of recent tidal forces for an in-plane, prograde encounter such as IC2163/NGC2207 (Sundin 1993; Elmegreen et al. 1995 ). There is a spiral-elliptical pair on the right in the middle row (galaxy 94). Double ellipticals in the UDF were studied previously (Elmegreen et al. 2005a, Coe et al. 2006). Near neighbors like this have been studied previously in the GEMS field; 6 double systems out of 379 red sequence galaxies were identified as being dry merger candidates, as reproduced in simulations (Bell et al. 2006). The models of mergers of early-type systems by Naab et al. (2006) apparently account for kinematic and isophotal properties of ellipticals better than the formation of ellipticals through late-type mergers alone. For the pairs in our figure, both components have the same COMBO17 redshift. There are many other examples of close galaxy groups and near interactions in the GEMS and GOODS surveys. In what follows we discuss only the properties of those shown in Figure 6.
The interacting types shown in the figures are meant to be as distinct as possible. These and other good cases are listed in Table 1 by running number, along with their COMBO-17 catalog number, redshift, and R magnitude. There is occasionally some ambiguity and overlap in the interaction types, particularly between M51-types and shrimps when the M51-types have small or uncertain companions at the ends of their prominent tails. Projection effects can lead to uncertainties in the classifications as well, particularly for antennae whose tails may be foreshortened. Nevertheless, these divisions serve as a useful attempt to sort out the most prominent features among interacting galaxies. There are numerous other galaxies in GEMS and GOODS that are apparently interacting, but most of them are too highly distorted to indicate the particular physical properties of interest here, namely, disk-to-halo mass ratio and star formation scale.
3 Photometric Results
3.1 Global galaxy properties
The integrated Johnson restframe (U-B) and (B-V) colors from COMBO-17 for the observed galaxies with measured redshifts are shown in a color-color diagram in Figure 7. The crosses in the diagram are Johnson colors for standard Hubble types (Fukugita et al. 1995). Our sample of galaxies spans the range of colors from early to late Hubble types, although the bluest are bluer than standard irregular galaxies (a typical Im has U-B, B-V). The reddest galaxies tend to be the diffuse types, thought to originate with ellipticals involved in interactions. The two reddest galaxies in our sample are the diffuse types number 1 and 2 in Figure 1. The bluest tend to be the assemblies, consistent with their having formed recently.
Figure 8 shows a restframe color-magnitude diagram. Early and late type galaxies usually separate into a “red sequence” and a “blue cloud” on such a diagram (Baldry et al. 2004; Faber et al. 2005). The solid line indicates the boundary between these two regions from a study of 22,000 nearby galaxies (Conselice 2006b). The short-dashed lines are the limits of the Conselice (2006) survey; local galaxies are brighter than the vertical short-dashed line and their colors lie between the horizontal short-dashed lines. The long-dashed lines approximately outline the bright limit for the local blue cloud galaxies. Our galaxies fall in both the red sequence and the blue cloud. The restframe colors in Figure 8 are consistent with their morphological appearances. The red sequence galaxies in the figure usually appear smooth (the diffuse types) or lack obvious huge star formation clumps (the equal mass mergers), while the blue cloud galaxies usually have patches of star formation (the M51-types, shrimps, assemblies, and many antennae). We see now why the redshifts of the diffuse galaxies ( are much lower than the others: this is a selection effect for the ACS camera. These tails comprise old stellar populations without star-forming clumps, and their intrinsic redness makes them difficult to see at high redshifts. Also, they tend to have intrinsically low surface brightnesses because of a lack of star formation, and cosmological dimming makes them too faint to see at high redshift. Hibbard & Vacca (1997) note that it is difficult to detect tidal arms beyond .
3.2 Clump properties
Prominent star-forming clumps are apparent in many of the interacting galaxies. Their sizes and magnitudes were measured using rectangular apertures. The observed magnitudes were converted to restframe B magnitudes whenever possible, using linear interpolations between the ACS bands. For example, GEMS observations are at two filters, and . GEMS galaxies with redshifts between 0.39 () and 0.95 () were assumed to have restframe blue luminosities given by . The restframe B magnitude is then . For GOODS galaxies, the conversions were divided into 3 redshift bins to make use of the 4 available filters, and a linear interpolation was again applied to get restframe clump magnitudes. For the GOODS galaxies, the restframe magnitudes determined by interpolation between the nearest 2 filters among the 4 filters are within 0.2 mag of the restframe magnitudes determined from only the V and z filters. Thus, the GEMS interpolations are accurate to this level. (We do not include corrections for intergalactic absorption in these colors, because we are comparing them directly with their parent galaxy properties. Below, when we convert the colors and magnitudes to masses and ages, absorption corrections are taken into account.)
The apparent restframe B magnitudes of the clumps were converted to absolute restframe B magnitudes using photometric redshifts and the distance modulus for a CDM cosmology. These absolute clump magnitudes are shown as a function of absolute galaxy magnitude in Figure 9. The clump absolute B magnitudes scale linearly with the galaxy magnitudes. The clumps are typically a kpc in size ( to 8 pixels across), comparable to star-forming complexes in local galaxies (Efremov 1995), which also scale with galaxy magnitude (Elmegreen et al. 1996; Elmegreen & Salzer 1999).
Clump ages and masses were estimated by comparing observed clump colors, magnitudes, and redshifts with evolutionary models that account for bandshifting and intergalactic absorption and that assume an exponential star formation rate decay (see Elmegreen & Elmegreen 2005). Internal dust extinction as a function of redshift is taken from Rowan-Robinson (2003). The GEMS galaxy clumps only have (V606-z850) colors, so the ages are not well constrained. For the GOODS galaxies, the additional B and I filters help place better limits on the ages, although there is still a wide range of possible fits.
Figure 10 shows sample model results for redshift . The different lines in each panel correspond to different decay times for the star formation rate, in years: , , , , and , and the sixth line represents a constant rate. Generally the shorter the decay time, the redder the color and higher the mass for a given duration of star formation. This correspondence between color and mass gives a degeneracy to plots of mass versus color at a fixed apparent magnitude (top left) and apparent magnitude versus color at a fixed mass (top right). Thus the masses of clumps can be derived approximately from their colors and magnitudes, without needing to know their ages or star formation histories.
Figure 11 shows observations and models in the color-magnitude plane for 6 redshift intervals spanning our galaxies. Each curve represents a wide range of star formation durations that vary along the curve as in the top right panel of Fig. 10; each curve in a set of curves is a different decay time. The different sets of curves, shifted vertically in the plots, correspond to different clump masses, as indicated by the adjacent numbers, which are in M⊙. Each different point is a different clump; many galaxies have several points. Only clumps with both and magnitudes above the 2 noise limit are plotted in Figure 11. The clump () colors range from 0 to 1.5. The magnitudes tend to be about constant for each redshift because of a selection effect (brighter magnitudes are rare and fainter magnitudes are not observed).
Figure 11 indicates that the masses of the observable clumps are between and M⊙ for all redshifts, with higher masses selected for the higher redshifts. The masses for all of the clumps are plotted in Figure 12 versus the galaxy type (types 1 through 6 are in order of Figs. 1 through 6 above). The masses are obtained from the observed values of and using the method indicated in Figure 11. The different mass evaluations for the six decay times are averaged together in the log to give the log of the mass plotted as a dot in Figure 12. The rms values of log-mass among these six evaluations are shown in Figure 12 as plus-symbols, using the right-hand axes. These rms deviations are less than 0.2, so the uncertainties in star formation decay times and clump ages do not lead to significant uncertainties in the clump mass. (Systematic uncertainties involving extinctions, stellar evolution models, photometric redshifts, and so on, would be larger.)
The clump ages cannot be determined independently from the star formation decay times with only the few passbands available at high angular resolution. Figure 13 shows model results that help estimate the clump ages. As in the other figures, each line is a different exponential decay time for the star formation rate. If we consider the two extreme decay times in this figure (continuous star formation for the bottom lines in each panel and years for the top lines), then we can estimate the age range for each decay time from the observed color range. For colors in the range from 0 to 0.5 at low (cf. Fig 11), the clump ages range from to yr with continuous star formation and from to yr with a decay time of yrs. For colors in the range from 0 to 1.5 at higher redshifts, the age ranges are about the same in each case. For intermediate decay times, the typical clump ages are between years for the bluest clumps and years for the reddest clumps. These are reasonable ages for star formation regions, and consistent with model tail lifetimes.
The star-forming complexes in the GEMS and GOODS interacting galaxies are 10 to 1000 times more massive than the local analogs seen in non-interacting late-type galaxies (Elmegreen & Salzer 1999), but the low mass end in the present sample is similar to the high mass end of the complexes measured in local interacting galaxies. For example, the Tadpole galaxy, UGC 10214, contains M⊙ complexes along the tidal arm (Tran et al. 2003; Jarrett et al. 2006). The interacting galaxy NGC 6872 has tidal tails with M⊙ HI condensations (Horellou & Koribalski 2007), but the star clusters have masses only up to M⊙ (Bastian et al. 2005). The most massive complexes in the tidal tail of NGC 3628 in the Leo Triplet are also M⊙ (Chromey et al. 1998). The NGC 6872 clusters differ qualitatively from those in our sample in being spread out along a narrow arm; ours are big round clumps spaced somewhat evenly along the arm. Small star clusters are also scattered along the tidal arms the Tadpole and Mice systems; they typically contain less than M⊙ (de Grijs et al. 2003). The NGC 3628 clusters are also faint with surface brightnesses less than 27 mag arcsec-2; they would not stand out at high redshift.
It is reasonable to consider whether the observed increase of complex mass with increasing redshift is a selection effect. Our clumps are several pixels in size, corresponding to a scale of kpc. Individual clusters are not resolved and we only sample the most massive conglomerates. These kpc sizes are comparable to the complex sizes in local galaxies, but the high redshift complexes are much brighter and more massive. They would be observed easily in local galaxies. The massive complexes in our sample are more similar to those measured generally in UDF galaxies (Elmegreen & Elmegreen 2005).
Clump separations were measured for clumps along the long arms in the shrimp galaxies of Figure 4. They average kpc for 49 separations. This is about the same separation as that for the largest complexes in the spiral arms of local spiral galaxies (Elmegreen & Elmegreen 1983, 1987), and comparable to the spacing between groups of dust-feathers studied by La Vigne et al. (2006). Yet the clumps in shrimp galaxies and others studied here are much more massive than the complexes in local spiral arms, which are typically M⊙ in stars and M⊙ in gas. This elevated mass can be explained by a heightened turbulent speed for the gas, combined with an elevated gas density. Considering that the separation is about equal to the two-dimensional Jeans length, for velocity dispersion and mass column density , and that the mass is the Jeans mass, , the mass scales with the square of the velocity dispersion, for fixed length and . The mass column density also scales with the square of the dispersion, to keep constant. Thus the interacting tidal arm clumps are massive because the velocity dispersions and column densities are high. Another way to derive this is to note that for regular spiral arm instabilities, is about unity at the instability threshold, where is the mass/length along the arm (Elmegreen 1994). Thus cloud mass scales with for constant cloud separation. High velocity dispersions for neutral hydrogen, km s-1, are also observed in local interacting galaxies (Elmegreen et al. 1993; Irwin 1994; Elmegreen et al. 1995; Kaufman et al. 1997; Kaufman et al. 1999; Kaufman et al. 2002). Presumably the interaction agitates the interstellar medium to make the large velocity dispersions. The orbital motions are forced to be non-circular and then the gaseous orbits cross, converting orbital energy into turbulent energy and shocks. Similar evidence for high velocity dispersions was found in the masses and spacings of star forming complexes in clump cluster galaxies (Elmegreen & Elmegreen 2005) and in spectral line widths (Genzel et al. 2006; Weiner et al. 2006).
3.3 Tail Properties
Figure 14 shows the average tail surface brightness as a function of for galaxies in Figures 1-4. Some systems have more than one tail. Cosmological dimming causes a fixed surface brightness to get fainter as , so there should be an inverse correlation in this diagram. Clearly, the tails are brighter for the more nearby galaxies, and they decrease out to , where they are fairly constant. This constant limit is at the 2 detection limit of 25 mag arcsec-2. Antennae galaxies with average tail surface brightnesses fainter than this limit have patchy tails with no apparent emission between the patches. Only the brightest high redshift tails can be observed in this survey.
Simulations by Mihos (1995) suggested that tidal tails are observable for a brief time in the early stages of a merger, corresponding to Myr at a redshift and 350 Myr at . The difference is the result of surface brightness dimming as tails disperse. A nearby galaxy merger, Arp 299, has a 180 kpc long tail encompassing 2 to 4% of the total galaxy luminosity, with an interaction age of 750 Myr, but its low surface brightness of 28.5 mag arcsec-2 (Hibbard & Yun 1999) would be below the GOODS/GEMS detection limit.
The ratio of the luminosity of the combined tails and bridges to the luminosity of the disk (the luminosity fraction) is shown in Figure 15. The luminosity fraction in the tidal debris ranges from 10 to 80, averaging about 30 regardless of redshift. This range is consistent with that of local galaxies in the Arp atlas and Toomre sequence (e.g., Schombert, Wallin, & Struck-Marcell 1990; Hibbard & van Gorkom 1996).
Interaction models with curled tails, as in our shrimp galaxies, were made by Bournaud et al. (2003). Their models had dark matter halos with masses times the disk mass and extents less than 12 disk scale lengths. Some of our shrimp galaxies have one prominent curved arm that is pulled out from the main disk but not very far, resulting in a lopsided galaxy. Simulations indicate that such lopsidedness may be the result of a recent minor merger (Bournaud et al. 2005). In some of our cases, a nearby companion is obvious.
The linear sizes of the tidal tails in our sample are shown in Figure 16. They range from 2 to 60 kpc, and are typically a few times the disk diameter, as shown in Figure 17, which plots this ratio versus redshift. The average tail to diameter ratio is for diffuse tails, for antennae, for M51-types and for shrimps, so the shrimps are about 60% as extended as the antennae types. There is no apparent dependence of these ratios on redshift in Figure 17. Projection effects make these apparent ratios smaller than the intrinsic ratios.
For comparison, the ratio of tail length to disk diameter versus the tail length for local galaxies is shown in Figure 18 based on measurements of antennae-type systems in the Arp atlas (1966) and the Vorontsov-Velyaminov atlas (1959). Our galaxies are also shown. The average tail length for the local galaxies in this figure is kpc, while the average tail length for the GEMS and GOODS antennae is 37% as much, kpc. The diameters for these two groups are kpc and kpc, and the ratios of tail length to diameter are and , respectively. Thus the local antennae mergers are larger in diameter by a factor of 2 than the GEMS and GOODS antennae, and the tails for the locals are larger by a factor of 2.7. These results for the diameters are consistent with other indicators that galaxies are smaller at higher redshift, although usually this change does not show up until (see observations and literature review in Elmegreen et al. 2007).
3.4 Tidal dwarf galaxy candidates
Three antennae galaxies at the top of Figure 2, numbers 15, 16, and 18, have long straight tidal arms with large star-forming regions at the ends. These clumps are possibly tidal dwarf galaxies. The clump diameters and restframe B magnitudes are listed in Table 2, along with the clump in diffuse galaxy number 1 discussed in Sect. 2. Listed are their and magnitudes and associated masses, calculated as in Sect. 3.2. The masses range from to M⊙ for the star-forming dwarfs, but for the stellar condensation in the diffuse-tail galaxy 1 (Fig. 1), the mass is M⊙. The star-forming dwarf masses are similar to or larger than those found for the tidal object at the end of the Superantennae (Mirabel et al. 1991) as well as the tidal object at the end of the tidal arm in the IC 2163/NGC 2207 interaction (Elmegreen et al. 2001) and at the end of the Antennae tail (Mirabel et al. 1992). The HI dynamical masses for these local tidal dwarfs are M⊙.
Simulations of interacting galaxies that form tidal dwarf galaxies require long tails and a dark matter halo that extends a factor of 10 beyond the optical disk (Bournaud et al. 2003). If one or both galaxies contain an extended gas disk before the interaction, then more massive, M⊙ stellar objects can form at the tips of the tidal arms from the accumulated pool of outer disk material (Elmegreen et al. 1993; Bournaud et al. 2003). Observations of nearby interactions show clumpy regions of tidal condensations with masses of M⊙ (Bournaud et al. 2004; Weilbacher et al. 2002, 2003; Knierman et al. 2003; Iglesias-Paramo & Vilchez 2001), like what is observed in our high redshift tidal dwarfs.
No well-resolved models have yet formed tidal dwarfs from stellar debris. Wetzstein, Naab, & Burkert (2007) considered this possibility and found collapsing gas more likely. Yet the condensed object in the tail of galaxy 1 could have formed there and it is interesting to consider whether the Jeans mass in such an environment is comparable to the observed mass. If, for example, the tidal arm surface density corresponds to a value typical for the outer parts of disks, M⊙ pc-2, and the stellar velocity dispersion is comparable to that required in Sect. 3.2 for the gas to give the giant star forming regions, km s-1, then the Jeans mass is M⊙. This is not far from the value we observe, M⊙, so the diffuse clump could have formed by self-gravitational collapse of tidal tail stars. The timescale for the collapse would be Myr, which is not unreasonable considering that the orbit time at this galactocentric radius is at least this large.
4 Dark Matter Halo Constraints
Models of interacting galaxies have been used to place constraints on dark halo potentials. Springel & White (1999) and Dubinski, Mihos, & Hernquist (1999) found that tidal tail lengths can be long compared to the disk if the ratio of escape speed to rotation speed at 2 disk scale lengths is small, , and the rotation curve is falling in the outer disk. In a series of models, Dubinski et al. showed that this condition may result from either disk-dominated rotation curves where the halo is extended and has a low concentration, or halo-dominated rotation curves where the halo is compact and low mass. Dubinski et al. point out that the latter possibility is inconsistent with observed flat or rising disk rotation curves, but the first is compatible if the disk is massive and dominant in the inner regions. The first case also gives prominent bridges. In addition, Springel & White (1999) found that CDM halo models with embedded disks allow long tidal tails, but Dubinski et al. noted that most of those which do are essentially low surface brightness disks in massive halos, and not normal bright galaxies. Galaxies without dark matter halos are not capable of generating long tidal tails (Barnes 1988). In all cases, longer tails develop in prograde interactions.
The smooth diffuse types and antenna types in Figures 1 and 2 have relatively long tails, so the progenitors were presumably disks of early and late types, respectively, with falling rotation curves in their outer parts. These long-tail cases are relatively rare, comprising only about 8% and 9%, respectively, of our original (300 galaxy) interacting sample from GEMS and GOODS. The more compact M51 types and shrimps represent 9% and 12% of the sample. Short tail interactions could be younger, less favorably projected, or have a more steeply rising rotation curve than long tail interactions. The M51 types have clear companions, so the prominent features are bridges. According to Dubinski et al. (1999), bridging requires a prograde interaction with a maximum-disk galaxy, that is, one with a low-mass, extended halo.
5 Conclusions
Mergers and interactions out to redshift have tails, bridges, and plumes that are analogous to features in local interacting galaxies. Some interactions have only smooth and red features, indicative of gas-free progenitors, while others have giant blue star-formation clumps. The tail luminosity fraction has a wide range, comparable to that found locally. A striking difference arises regarding the tail lengths, however. The tails in our antenna sample, at an average redshift of 0.7, are only one-third as long as the tails in local antenna mergers, and the disk diameters are about half the local merger diameters. This difference is consistent with the observations that high redshift galaxies are smaller than local galaxies, although such a drop in size has not yet been seen for galaxies at redshifts this low. The implication is that dark matter halos have not built up to their full sizes for typical galaxies in GEMS and GOODS.
Star formation is strongly triggered by the interactions observed here, as it is locally. The star-forming clumps tend to be much more massive than their local analogs, however, with masses between M⊙ and a few M⊙, increasing with redshift. This is not merely a selection effect, since the massive clumps seen at high redshift would show up at lower redshift, although of course smaller clumps would not be resolved at high redshift. The clump spacings were measured along the tidal arms of the most prominent one-arm type of interaction, the shrimp-type, and found to be , which is typical for the spacing between beads on a string of star formation in local spiral arms. If both types of arms form clumps by gravitational instabilities, then the turbulent speed of the interstellar medium in the GEMS and GOODS sample has to be larger than it is locally by a factor of or more; the gas mass column density has to be larger by this factor squared.
Some interactions have tidal dwarf galaxies at the ends of their tidal arms, similar to those found in the Superantennae galaxy and other local mergers. One diffuse interaction with red stellar tidal debris has a large stellar clump that may have formed by gravitational collapse in a stellar tidal arm; the clump mass is M⊙. Long-arm interactions are relatively rare, comprising only % of our total sample of interacting systems (only a fraction of which were discussed here). For those with long arms, numerical models suggest the dark matter halos must be extended, so that the rotation curves are falling in the outer disks. Most interactions are not like this, however, so the rotation curves are probably still rising in their outer disks, like most galaxies locally.
We gratefully acknowledge summer student support for B.M. and T.F. through an REU grant for the Keck Northeast Astronomy Consortium from the National Science Foundation (AST-0353997) and from the Vassar URSI (Undergraduate Research Summer Institute) program. D.M.E. thanks Vassar for publication support through a Research Grant. We thank the referee for useful comments. This research has made use of the NASA/IPAC Extragalactic Database (NED) which is operated by the Jet Propulsion Laboratory, California Institute of Technology, under contract with the National Aeronautics and Space Administration.
References
- (1) Abraham, R., Tanvir, N., Santiago, B., Ellis, R., Glazebrook, K., & van den Bergh, S. 1996, MNRAS, 279, L47
- (2) Arp, H.J. 1966, Atlas of Peculiar Galaxies (Pasadena: CalTech)
- (3) Athanassoula, E., & Bosma, A. 1985, ARAA, 23, 147
- (4) Baldry, I. K. et al. 2004, ApJ, 600, 681
- (5) Barnes, J.E. 1988, ApJ, 331, 699
- (6) Barnes, J.E. 2004, MNRAS, 350, 798
- (7) Barnes, J., & Hernquist, L. 1992, ARAA, 30, 705
- (8) Bastian, N., Hempel, M., Kissler-Patig, M., Homeier, N., & Trancho, G. 2005, A&A, 435, 65
- (9) Beckwith, S.V.W., et al. 2006, AJ, 132, 1729
- (10) Bell, E.F., et al. 2006, ApJ, 640, 241
- (11) Bournaud, F., Combes, F., Jog, C., & Puerari, I. 2005, A&A, 438, 507
- (12) Bournard, F., Duc, P.-A., Amram, P., Combes, F., & Gach, J.-L. 2004, A&A, 425, 813
- (13) Bournaud, F., Duc., P.A.-, & Masset, F. 2003, A&A, 411, L469
- (14) Burbidge, E.M., & Burbidge, G.R. 1959, ApJ, 130, 23
- (15) Caldwell, J. et al., 2005, astro-ph/0510782
- (16) Carroll, S. M., Press, W. H., & Turner, E. L. 1992, ARAA, 30, 499
- (17) Chromey, F. R., Elmegreen, D. M., Mandell, A., & McDermott, J. 1998, AJ, 115, 2331
- (18) Conselice, C.J. 2005, in Multiwavelength mapping of galaxy formation and evolution, ESO Workshop, ed. A. Renzini & R. Bender (Berlin: Springer), 163
- (19) Conselice, C.J. 2006b, MNRAS, 373, 1389
- (20) Conselice, C.J. 2006a, ApJ, 638, 686
- (21) Conselice, C., Bershady, M., Dickinson, M., & Papovich, C. 2003, AJ, 126, 1183
- (22) Coe, D., Benitez, N., Sanchez, S., Jee, M., Bouwens, R., & Ford, H. 2006, AJ, 132, 926
- (23) de Grijs, R., Lee, J., Mora Herrera, M., Fritze-v. Alvensleben, U., & Anders, P. 2003, NewA, 8, 155
- (24) de Mello, D., Wadadekar, Y., Dahlen, T., Casertano, S., & Gardner, J.P. 2006, AJ, 131, 216
- (25) Dubinski, J., Mihos, J., & Hernquist, L. 1999, ApJ, 526, 607
- (26) Duc, P.-A., et al., 1997, A&A, 326, 537
- (27) Efremov, Y.N. 1995, AJ, 110, 2757
- (28) Elmegreen, B.G. 1994, ApJ, 433, 39
- (29) Elmegreen, B.G., & Elmegreen, D.M. 1983, MNRAS, 203, 31
- (30) Elmegreen, B.G., & Elmegreen, D.M. 1987, ApJ, 320, 182
- (31) Elmegreen, B.G., & Elmegreen, D.M. 2005, ApJ, 627, 632
- (32) Elmegreen, B., Elmegreen, D., Salzer, J., & Mann, H. 1996, ApJ, 467, 579
- (33) Elmegreen, B., Kaufman, M., & Thomasson, M. 1993, ApJ, 412, 90
- (34) Elmegreen, D.M., & Elmegreen, B.G. 2006, ApJ, 651, 676
- (35) Elmegreen, D.M., Kaufman, M., Elmegreen, B.G., Brinks, E., Struck, C., Klaric, M., & Thomasson, M. 2001, AJ, 121, 182
- (36) Elmegreen, D.M., Elmegreen, B.G., Ravindranath, S., & Coe, D. 2007, astroph/0701121
- (37) Elmegreen, D.M., Elmegreen, B.G., Rubin, D.S., & Schaffer, M.A. 2005, ApJ, 631, 85
- (38) Elmegreen, D., Kaufman, M., Brinks, E., Elmegreen, B., & Sundin, M. 1995, ApJ, 453, 100
- (39) Elmegreen, D., & Salzer, J. 1999, AJ, 117, 764
- (40) Faber, S. et al. 2005, astro-ph/0506044
- (41) Fukugita, M., Shimasaku, K., & Ichikawa, T. 1995, PASP, 107, 945
- (42) Genzel, R. et al. 2006, Nature, 442, 786
- (43) Giavalisco, M., et al. 2004, ApJ, 600, L103
- (44) Hibbard, J.E., & Vacca, W. D. 1997, AJ, 114, 1741
- (45) Hibbard, J., & van Gorkom, J. 1996, AJ, 111, 655
- (46) Hibbard, J.E., & Yun, M.S. 1999, AJ, 118, 162
- (47) Horellou, C., & Koribalski, B. 2007, A&A, 464, 155
- (48) Iglesias-Paramo, J., & Vilchez, J.M. 2001, ApJ, 550, 204
- (49) Irwin, J.A. 1994, ApJ, 429, 618
- (50) Jarrett, T.H., et al. 2006, AJ, 131, 261
- (51) Kaufman, M., Brinks, E., Elmegreen, D., Thomasson, M., Elmegreen, B., Struck, C., & Klaric, M. 1997, AJ, 114, 2323
- (52) Kaufman, M., Brinks, E., Elmegreen, B.G., Elmegreen, D.M., Klaric, M., Struck, C., Thomasson, M., & Vogel, S., 1999, AJ, 118, 1577
- (53) Kaufman, M., Sheth, K., Struck, C., Elmegreen, B G., Thomasson, M., Elmegreen, D.M., Brinks, E. 2002, AJ, 123, 702
- (54) Kim, W.-T. & Ostriker, E.C. 2006, ApJ, 646, 213
- (55) Knierman, K., et al. 2003, AJ, 126, 1227
- (56) Laine, S., van der Marel, R., Rossa, J., Hibbard, J., Mihos, J., Boker, T., & Zabludoff, A. 2003, AJ, 126, 2717
- (57) Larson, R. B., & Tinsley, B. M. 1978, ApJ, 219, 46
- (58) Lavery, R., Remijan, A., Charmandaris, V., Hayes, R., & Ring, A. 2004, ApJ, 612, 679
- (59) La Vigne, M.A., Vogel, S.N., & Ostriker, E.C. 2006, ApJ, 650, 818
- (60) Lotz, J. M., Madau, P., Giavalisco, M., Primack, J., & Ferguson, H. 2006, ApJ, 636, 592
- (61) Malin, D.F., & Carter, D. 1980, Nature, 285, 643
- (62) Mihos, C. 1995, ApJ, 438, L75
- (63) Mirabel, I., Dottori, H., & Lutz, D. 1992, A&A, 256, L19
- (64) Mirabel, I., Lutz, D., & Maza, J. 1991, A&A, 243, 367
- (65) Naab, T., Khochfar, S., & Burkert, A. 2006, ApJ, 636, L81
- (66) Neuschaefer, L., Im, M., Ratnatunga, U., Griffiths, R., & Casertano, S. 1997, ApJ, 480, 59
- (67) Patton, D., Pritchet, C., Yee, H., Ellingson, E., & Carlberg, R. 1997, ApJ, 475, 29
- (68) Rasband, W.S., 1997, ImageJ, U.S. National Institutes of Health, Bethesda, MD, http://rsb.info.nih.gov/ij/
- (69) Rix, H.W., et al. 2004, ApJS, 152, 163
- (70) Rots, A., Bosma, A., van der Hulst, J., Athanassoula, E., & Crane, P. 1990, AJ, 100, 387
- (71) Rowan-Robinson, M. 2003, MNRAS, 345, 819
- (72) Schombert, J., Wallin, J., & Struck-Marcell, C. 1990, AJ, 99, 497
- (73) Smith, B.J., Struck, C., Appleton, P.N., Charmandaris, V., Reach, W., & Eitter, J.J. 2005, AJ, 130, 2117
- (74) Smith, B.J., Struck, C., Hancock, M., Appleton, P.N., Charmandaris, V., & Reach, W.T. 2007, AJ, 133, 791
- (75) Spergel, D. N., et al. 2003, ApJS, 148, 175
- (76) Springel, V. & White, S. 1999, MNRAS, 307, 162
- (77) Sundin, M. 1993, Ph.D. thesis, Chalmers Univ. of Technology
- (78) Straughn, A. N., Cohen, S. H., Ryan, R. E., Hathi, N. P., Windhorst, R. A., & Jansen, R. A. 2006, ApJ, 639, 724
- (79) Struck, C. 1999, Physics Reports, 321, 1
- (80) Struck, C., Appleton, P., Borne, K., & Lucas, R. 1996, AJ, 112, 1868
- (81) Toomre, A. 1977, in “The Evolution of Galaxies and Stellar Populations,” eds. W. Becker and G. Contopoulos (Reidel: Dordrecht), 401
- (82) Toomre, A., & Toomre, J. 1972, ApJ, 431, L9
- (83) Tran, H.D., et al. 2003, ApJ, 585, 750
- (84) Trujillo, I., et al. 2006, MNRAS, 373, L36
- (85) Tyson, J. A., Fischer, P., Guhathakurta, P., McIlroy, P., Wenk, R., Huchra, J., Macri, L., Neuschaefer, L., Sarajedini, V., Glazebrook, K., Ratnatunga, K., & Griffiths, R. 1998, AJ, 116, 102
- (86) Vorontsov-Velyaminov, B.A. 1957, Astr. Circ., USSR, 178, 19
- (87) Vorontsov-Velyaminov, B.A. 1959, Atlas and Catalog of Interacting Galaxies, (Moscow: Sternberg Institute)
- (88) Weilbacher, P., Duc, P.-A., & Fritze-v. Alvensleben, U. 2003, A&A, 397, 545
- (89) Weilbacher, P., Fritze-v. Alvensleben, U., Duc, P.-A., & Fricke, K.J. 2002, ApJ, 579, L79
- (90) Weiner, B.J, Willmer, C. N. A., Faber, S. M., Melbourne, J., Kassin, S.A., Phillips, A.C., Harker, J., Metevier, A. J., Vogt, N. P., & Koo, D. C. 2006, ApJ, 653, 1027
- (91) Wetzstein, M., Naab, T., & Burkert, A. 2007, MNRAS, 375, 805
- (92) Whitmore, B., et al. 2005, AJ, 130, 2104
- (93) Wolf, C., Meisenheimer, K., Rix, H.-W., Borch, A., Dye, S., & Kleinheinrich, M. 2003, A&A, 401, 73
| Type, Figure | Number | COMBO 17 | z | R mag. |
|---|---|---|---|---|
| Diffuse (Fig. 1) | 1 | 6423 | 0.15 | 16.572 |
| 2 | 12639 | 0.154 | 16.678 | |
| 3 | 11538 | 0.134 | 17.713 | |
| 4 | 53129 | 0.171 | 16.968 | |
| 5 | 57881 | 0.118 | 17.552 | |
| 6 | 28509 | 0.093 | 18.79 | |
| 7 | 17207 | 0.69 | 19.742 | |
| 8 | 30824 | 0.341 | 19.755 | |
| 9 | 25874 | 0.262 | 19.757 | |
| Diffuse (other) | 10 | 22588 | 0.684 | 21.263 |
| 11 | 21990 | 0.429 | 21.243 | |
| 12 | 46898 | 0.617 | 20.794 | |
| 13 | 49709 | 0.302 | 20.23 | |
| 14 | 15233 | 0.304 | 18.857 | |
| Antennae (Fig. 2) | 15 | 61546 | 0.552 | 20.41 |
| 16 | 45115 | 0.579 | 21.275 | |
| 17 | 20280 | 0.555 | 21.653 | |
| 18 | 41907 | 0.702 | 22.66 | |
| 19 | 35611 | 1.256 | 22.655 | |
| 20 | 10548 | 0.698 | 22.43 | |
| 21 | 33650 | 0.169 | 18.86 | |
| 22 | 42890 | 0.421 | 20.68 | |
| 23 | 49860 | 1.169 | 23.632 | |
| 24 | 34926 | 0.779 | -19.69 | |
| Antennae (other) | 25 | 14829 | 0.219 | 21.429 |
| 26 | 18588 | 0.814 | 22.748 | |
| 27 | 46738 | 1.204 | 20.65 | |
| 28 | 7551 | 1.162 | 25.926 | |
| 29 | 20034 | 1.326 | 21.932 | |
| 30 | 33267 | 0.067 | 23.112 | |
| 31 | 38651 | 0.988 | 23.89 | |
| 32 | 55495 | 1.00 | 24.261 | |
| M51-type (Fig. 3) | 33 | 5640 | 0.204 | 19.477 |
| 34 | 9415 | 0.523 | 21.16 | |
| 35 | 40901 | 0.193 | 19.751 | |
| 36 | 17522 | 0.82 | 23.103 | |
| 37 | 6209 | 1.187 | 22.723 | |
| 38 | 23667 | 1.151 | 23.514 | |
| 39 | 37293 | 0.274 | 20.533 | |
| 40 | 39805 | 0.557 | 20.089 | |
| 41 | 53243 | 0.698 | 21.683 | |
| 42 | 15599 | 0.56 | 21.381 | |
| 43 | 25783 | 0.663 | 20.732 | |
| 44 | 39228 | 0.117 | 18.031 | |
| M51-type (other) | 45 | 1984 | 0.762 | 22.855 |
| 46 | 2760 | 1.281 | 23.202 | |
| 47 | 15040 | 0.667 | 22.392 | |
| 48 | 18502 | 0.228 | 21.942 | |
| 49 | 14959 | 0.306 | 19.581 | |
| 50 | 16023 | 0.668 | 21.887 | |
| 51 | 30226 | 0.509 | 22.689 | |
| 52 | 40744 | 0.292 | 21.119 | |
| 53 | 45102 | 0.857 | 22.514 | |
| 54 | 60582 | 0.946 | 22.54 | |
| Shrimp (Fig. 4) | 55 | 40198 | 0.201 | 20.55 |
| 56 | 14373 | 0.795 | 23.183 | |
| 57 | 12222 | 1.004 | 22.417 | |
| 58 | 28344 | 0.257 | 19.509 | |
| 59 | 56284 | 0.657 | 21.667 | |
| 60 | 2385 | 0.283 | 21.334 | |
| 61 | 54335 | 0.892 | 22.824 | |
| 62 | 28841 | 0.673 | 20.971 | |
| 63 | 6955 | 0.983 | 22.24 | |
| Shrimp (other) | 64 | 34244 | 0.999 | 22.504 |
| 65 | 48298 | 0.429 | 21.663 | |
| 66 | 37809 | 0.357 | 20.667 | |
| 67 | 25316 | 0.985 | 23.717 | |
| 68 | 49595 | 0.663 | 21.939 | |
| 69 | 59467 | 0.487 | 21.568 | |
| 70 | 9062 | 0.854 | 23.82 | |
| 71 | 30076 | 0.832 | 22.672 | |
| 72 | 2760 | 1.281 | 23.202 | |
| 73 | 54335 | 0.892 | 22.824 | |
| Assembly (Fig. 5) | 74 | 28751 | 0.093 | 23.506 |
| 75 | 4728 | 0.702 | 22.799 | |
| 76 | 23187 | 1.183 | 23.565 | |
| 77 | 45309 | 1.061 | 22.916 | |
| 78 | 41835 | 0.098 | 19.134 | |
| 79 | 61945 | 1.309 | 21.813 | |
| 80 | 62605 | 1.011 | 23.143 | |
| 81 | 44956 | 0.506 | 22.494 | |
| 82 | 4546 | 0.809 | 22.163 | |
| 83 | 23000 | 0.132 | 22.951 | |
| 84 | 63112 | 0.499 | 22.273 | |
| 85 | 43975 | 1.059 | 22.878 | |
| Equal (Fig. 6) | 86 | 40813 | 0.182 | 19.983 |
| 87 | 8496 | 0.354 | 22.415 | |
| 88 | 13836 | 0.661 | 21.054 | |
| 89 | 11164 | 0.464 | 19.351 | |
| 90 | 39877 | 0.493 | 22.142 | |
| 91 | 40598 | 0.263 | 20.128 | |
| 92 | 51021 | 0.743 | 20.96 | |
| 93 | 35317 | 0.671 | 20.755 | |
| 94 | 56256 | 0.502 | 20.309 | |
| 95 | 47568 | 0.649 | 20.206 | |
| 96 | 40766 | 0.46 | 19.997 | |
| 97 | 24927 | 0.524 | 19.647 | |
| 98 | 15233 | 0.304 | 18.857 | |
| 99 | 18663 | 1.048 | 24.011 | |
| 100 | 43242 | 0.657 | 21.177 |
| Galaxy | z | Galaxy | Diam. | Dwarf | Clump Mass | ||
|---|---|---|---|---|---|---|---|
| (COMBO17 #) | (mag) | (kpc) | (mag) | mag | mag | x108 M⊙ | |
| 1 (6423) | 0.15 | -20.64 | 13.9 | -17.55 | 20.83 | 0.90 | 50 |
| 15 (61546) | 0.552 | -20.77 | 5.5 | -16.67 | 26.12 | 0.78 | 1.2 |
| 16 (45115) | 0.579 | -20.17 | 4.7 | -17.72 | 25.42 | 1.1 | 4.6 |
| 18 (41907) | 0.702 | -19.21 | 1.9 | -16.03 | 27.45 | 0.55 | 0.24 |
| 17 (20280) | 0.555 | -19.56 | 6.2 | -17.06 | 25.77 | 0.73 | 1.4 |