Phenomenological theory of spin excitations in La- and Y-based cuprates
Abstract
Motivated by recent inelastic neutron scattering (INS) experiments on La-based cuprates and based on the fermiology theories, we study the spin susceptibility for La-based (e.g., La2-xSrxCuO4) and Y-based (e.g., YBa2Cu3Oy) cuprates, respectively. The spin excitation in YBa2Cu3Oy is dominated by a sharp resonance peak at the frequency 40 meV in the superconducting state. Below and above the resonance frequency, the incommensurate (IC) peaks develop and the intensity of the peaks decreases dramatically. In the normal state, the resonant excitation does not occur and the IC peaks are merged into commensurate ones. The spin excitation of La2-xSrxCuO4 is significantly different from that of Y-based ones, namely, the resonance peak does not exist due to the decreasing of the superconducting gap and the presence of the possible spin-stripe order. The spectra are only enhanced at the expected resonance frequency (about 18 meV) while it is still incommensurate. On the other hand, another frequency scale at the frequency 55 meV is also revealed, namely the spectra are commensurate and local maximum at this frequency. We elaborate all the results based on the Fermi surface topology and the -wave superconductivity, and suggest that the spin-stripe order be also important in determining the spin excitation of La-based cuprates. A coherent picture for the spin excitations is presented for Y-based and La-based cuprates.
pacs:
74.25.Ha, 74.20.MnI introduction
Spin excitations in high- superconductors have been intensively studied by the inelastic neutron scattering (INS) experiments in the past decade. Most of the INS experiments are performed on YBa2Cu3Oy (YBCO) and La2-xSrxCuO4 (LSCO) samples. One of the most important results revealed by the experiments in YBCO is the resonant spin excitation ros ; fon ; moo ; fon1 ; dai ; sto , which is centered at the momentum and the intensity decreases dramatically as the momentum deviates from . As the frequencies are below and above the resonance frequency, the spin excitations are incommensurate (IC) and the peaks disperse towards the momentum as the frequencies are close to the resonance frequency hay ; ara ; bou . Above the superconducting transition temperature or possibly above the pseudogap temperature, the resonant excitation disappears and the spectrum are commensurate at all the frequencies ara ; bou ; dai1 . Besides YBCO, the resonance peak is also observed in Bi2Sr2CaCu2O8+x fong ; roso , Tl2Ba2CuO6+x he , and electron-doped samples Pr0.88LaCe0.12CuO4-x step , with the resonance frequencies scaling approximately with superconducting transition temperature in different systems step ; roso as well as in the same system with different doping densities moo ; fon1 ; dai .
Recent experiments revealed that the dispersion of the IC peaks in La-based ones is similar to that of the Y-based ones, namely the spin excitation is commensurate at the frequency meV, where a downward dispersion and an upward dispersion are seen below and above , respectively tra ; chr . On the other hand, the spin excitation of La-based ones is significantly different from that of Y-based ones. Firstly, the peak approaches to only when the frequency is close to and the dispersion is weakly dependent on the frequency at low frequencies tra ; chr . Secondly, the IC spin excitation is observed even when the temperature is well above the superconducting transition temperature thu ; mas ; aep ; fuj . More importantly, the spin resonance peak, which is expected to occur at the frequency around meV (scaled with ) in optimal doped LSCO, has not been observed experimentally. The intensity of the commensurate peak at the frequency is not strongest compared to the IC ones, which is also different from that of the spin resonance peak in Y-based systems. As the temperature crosses the transition temperature , the intensity is not enhanced suddenly either tra ; chr . Thus the commensurate spin excitation is also significantly different from the resonant excitation. In addition, very recently, the experiment on LSCO sample revealed two frequency scales in the superconducting state vig , i.e., at low frequencies, the intensity of the IC peak increases as the frequency increases and reaches the maximum value at the frequency around meV; while the spin excitation exhibits a broad hump with the commensurate spin excitation occurring at meV and the intensity reaches the local maximum value at this frequency. Interestingly, the low frequency scale is just the expected resonance frequency in LSCO, which also suggests that there should be a coherent picture for the spin excitations of YBCO and LSCO.
Theoretically, there have been two possible explanations for the spin excitations observed in the INS experiments. One is based on the fermiology theories si ; tana ; tana1 ; liu ; bri ; morr ; kao1 ; norman ; jxli ; li ; jxl ; zhou ; ere ; kao ; schn ; hir ; dahm ; mans ; zhou1 , namely, the resonance peak is a collective spin excitation mode, and the IC excitation is caused by the nested Fermi surface. This scenario is rather popular in describing spin excitations of YBCO materials. For La-based samples, it was proposed that the disappearance of the resonance is due to the different shape of the Fermi surface, namely, the Fermi surface is suggested to be centered at rather than for La-based cases, which is caused by the decrease of the nearest neighbor hoping constant si ; tana ; tana1 ; liu . However, angel resolved photoemission spectroscopy (ARPES) experiments have shown that the Fermi surface of LSCO looks similar to that of Y-based ones, i.e., it is also centered at , and the nearest neighbor hoping constant in LSCO samples is about t, which does not cause a qualitative change of the shape of the Fermi surface ino ; ino1 ; yos . To be consistent with the resent ARPES experiments, a picture based on a distorted Fermi surface, i.e., the Fermi surface expands along the axis and shrinks along the axis, is proposed to explain some of the characteristic of the magnetic excitation of LSCO yam . Based on this scenario and the random phase approximation (RPA), the spin resonance is possibly very weak, depending on the choice of the RPA factor. While the quasi-resonance peak at still exists even if the RPA renormalized factor [Ref. yam ] is much smaller than Y-based ones. So, particularly for La-based samples, an explanation that suggests the presence of the dynamic stripes with a kind of 4-lattice constant charge order and 8-lattice constant spin order to be the origin of the IC peaks, has attracted much interest kru ; car ; voj ; uhr ; uhr1 ; and ; sei ; sei1 ; yao . This picture offers a natural explanation for the observation of a charge order signal whose wave vector is just twice of the IC magnetic wave vector tra1 ; ich ; fuj1 .
The IC spin fluctuations associated with a stripe phase are expected to be one dimensional, i.e., the IC peaks appear either at or direction, while most INS experiments are in fact performed on twinned samples, thus along a given or directions, the domains with lattice spacing or exist in equal proportion. So, all asymmetries between the and direction will be covered up. The anisotropic IC spin excitation was first reported by Mook . in partly detwinned YBa2Cu3O6.6 and was seen as a strong support for the stripe phase picture mook . While later INS experiments on fully untwinned YBCO samples revealed that the IC peaks are actually two dimensional although a clear anisotropy exists hin . Thus an alternative explanation for the anisotropy in YBCO samples is based on the nested fermi surface scenario, i.e., by taking into account the role of the CuO chain or distorted fermi surface zhou ; ere ; kao ; schn ; hir . The anisotropic IC spin excitation was also reported in La-based systems recently. This anisotropic feature is remarkably different from that of the YBCO and is actually one-dimensional, so that it supports strongly the presence of the spin-stripe order in this system chri .
In this paper, motivated by the above observations on La-based samples, we study the spin excitation of Y-based and La-based cuprates based on the fermiology theories. We attempt to understand the features of the spin excitation in LSCO by comparing the similarities and differences of magnetic excitations between YBCO and LSCO. Apart from the topology of the Fermi surface, the spin-stripe order seems to play an important role in the spin excitation of La-based cuprates. Thus for La-based cases, we phenomenologically take into account a possible 1/8-lattice spin order by using an IC wave vector in the vertex of the RPA factor. Since this picture can also explain the spin dynamics of the bilayer samples zhou1 and the electron-doped ones jxl , we here give a coherent picture of the spin dynamics of the high- superconductors.
The article is organized as follows. In Sec. II, we introduce the model and work out the formalism. In Sec. III, we present numerical results of the spin susceptibility for La-based and Y-based cases, respectively. In Sec. IV, we interpret the results. Finally, we give a brief summary in Sec. V.
II Model and formalism
We start with a BCS bare spin susceptibility in a one-layer superconducting system,
| (1) | |||||
where is the Fermi distribution function, with and the electron band dispersion and superconducting gap function, respectively.
For different materials, different maximum gaps () are chosen, i.e., at the optimal doping, the superconducting gap magnitude () of the different systems at the zero temperature limit scales linearly with the corresponding transition temperature sato ; sato1 ; feng , expressed by . The bare normal state spin susceptibility is obtained by setting and . The band dispersion is used by fitting qualitatively the Fermi surface as measured by ARPES norm , written as , with , , , , , (meV), and , , , , , . The superconducting gap function is taken as -wave symmetry with and being obtained by the corresponding .
Taking into account the electron-electron interaction, the renormalized spin susceptibility is given by a RPA form,
| (2) |
with is the spin-spin response function and expressed by,
| (3) |
where is fixed at 210 meV in the following calculations. The wave vector represents the effect of the spin order. For type model and probably suitable for most families of cuprates, , thus , which tends to suppress the incommensurability since it is largest at the commensurate wave vector . While for the La-based samples, we use , by taking into account the possible 1/8-spin order ( depends on whether is greater than to ensure the spectra is symmetric along the line ), so that is largest at the IC wave vector .
III results
III.1 Evolution of the spin resonance for different systems

The renormalized spin susceptibility as a function of the frequency for different superconducting transition temperatures () in the superconducting state with is plotted in Fig. 1. As is seen, the resonance frequency decreases as decreases. Moreover, as seen in the inset of Fig. 1, is in fact proportional to , i.e., , qualitatively consistent with the experimental results step . As reported by earlier experiments fon1 ; roso ; dai and theoretical calculations dahm ; mans ; zhou1 , this linear relation also holds as the level doping decreases from the optimal doping. Thus in cuprates, the relation for the resonance frequency and is in fact independent on the systems or doping densities. On the other hand, we can see clearly from Fig. 1 that the intensity of the resonance peak decreases as decreases. Note that, for the samples with K, only quasi-resonance occurs with a much weaker intensity. Therefore the resonance signals are not so clear for LSCO as for YBCO even if the stripe order and the band difference are neglected. As we will see below, the resonance in LSCO is suppressed further by the 1/8-spin order and becomes incommensurate at the expected resonance or quasi-resonance frequency.
III.2 Spin susceptibility of LSCO
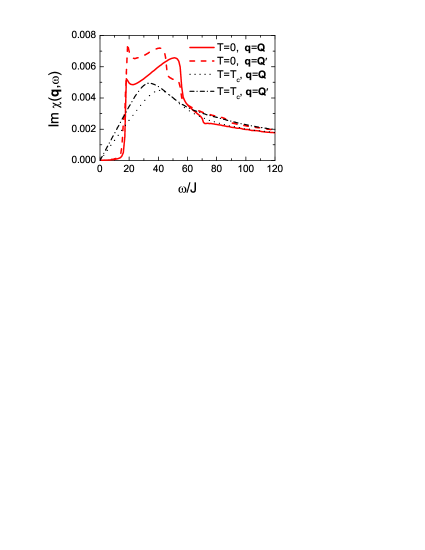
Now let us look into the spin susceptibility of LSCO with K and . The imaginary parts of the spin susceptibilities at the wave vector and IC wave vector in the normal and superconducting states are plotted in Fig. 2, respectively. As seen, the spectra show a peak-dip-hump structure with two local maximums at about 18 meV and 55 meV in the superconducting state. The spin excitation at the frequency 55 meV may be commensurate because the intensity decreases as the momentum shifts from to . The peak intensity at this frequency is slightly weaker than that of the IC one at 18 meV. This two component feature is well consistent with a very recent experiment vig . In the normal state, the intensity at the frequency 18 meV decreases, and only one maximum at the frequency 50 meV exists, while many features are still similar to that of the superconducting state, namely the spin excitation is incommensurate at low and high frequency and the incommensurability is very small at the frequency 50 meV.
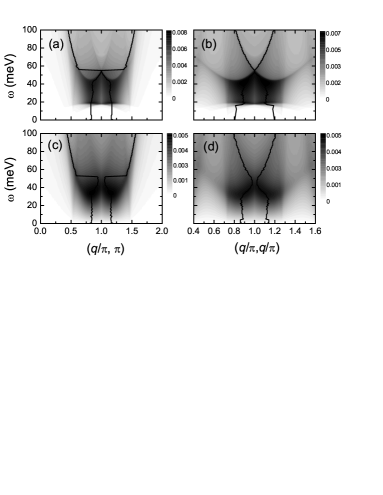
The intensity plots of the imaginary parts of the spin susceptibilities as functions of the momentum and frequency in the superconducting and normal states are plotted in Figs. 3(a-d), respectively. At low frequencies, the spin excitation is along the diagonal direction. A clear spin gap exists along the parallel direction [Fig. 3(a)]. When the frequency increases, the spin excitation along parallel direction is available and dominates over that along diagonal direction for the frequency above 10 meV. As the frequency reaches about 18 meV, the IC spin excitation reaches the maximum intensity. Then the intensity decreases as the frequency increases. Note that the incommensurability depends weakly on the frequency when the frequency is less than 40 meV. As the frequency increases further the intensity of the peak increases again and the peak position approaches to quickly. At the frequency 55 meV, the spin excitation is commensurate and the intensity reaches the local maximum. As the frequency is above 55 meV, the IC peaks reappear and are dispersing with a upward curvature. The dispersion does not change much and has also a hourglass shape in the normal state, as seen in Figs. 3(c-d). Meanwhile the spin gap is absent in the normal state. These results agree well with experimental results in La-based ones thu ; mas ; aep ; fuj ; tra ; chr .
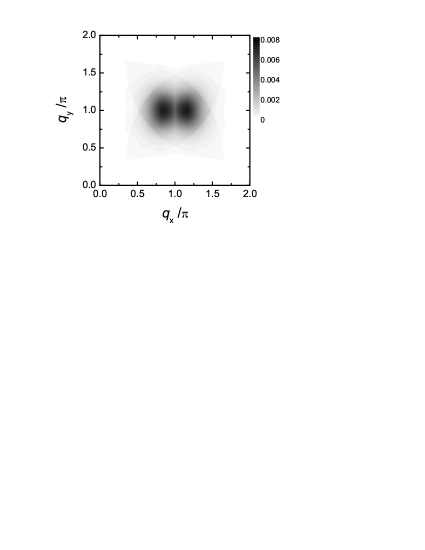
We turn to address a possible anisotropy caused by the 1/8-spin order. The intensity plot of the imaginary part of the spin susceptibility as a function of the momentum is shown in Fig. 4. The one dimensional IC peaks along direction are seen clearly, and the spin excitation is commensurate along direction. The direction of the IC excitation is determined by the wave vector . This anisotropy caused by the spin order is significantly different from that observed in untwinned YBCO samples hin , namely in untwinned YBCO samples, the spin excitation is actually two dimensional although the IC peak along direction is stronger. In La-based cuprates, such one-dimensional spin excitation spectra are reported recently chri . Interestingly, the present phenomenological picture can reproduce some of the experimental results, particularly the one-dimensional spin excitation. In fact, the observation of the one-dimensional IC spin excitation supports strongly the presence of the stripe order and suggest that it should play an important role in determining the spin excitation spectra in La-based systems.
III.3 Spin susceptibility of YBCO
For the case of YBCO samples with K and , the imaginary parts of the spin susceptibilities Im as a function of the frequency in the superconducting and normal states are plotted in Fig. 5, respectively. In the superconducting state, Im is dominated by a sharp resonance at the frequency 40 meV. In the normal state, the intensity decreases dramatically while it still has a broad peak at the frequency 30 meV. This result is significantly different from that of La-based ones. Besides, there is only one frequency scale in the superconducting state in YBCO, i.e., the resonance frequency. Below and above the resonance frequency the intensity decreases dramatically.

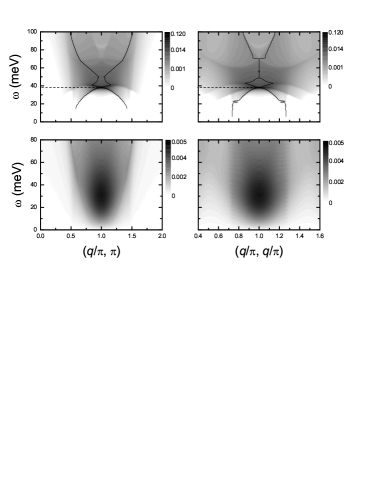
The intensity plots for imaginary parts of the spin susceptibilities as functions of the momentum and frequency in the superconducting and normal states are shown in Figs. 6(a-d), respectively. As seen, the spin susceptibility is peaked at the momentum at 40 meV in the superconducting state. Below the resonance frequency, dominant IC peaks at the momentum and a subdominant structure along the diagonal lines occur. As the frequency is low enough, the IC peaks rotate to the diagonal direction due to the spin gap along the parallel direction. The peaks are dispersing with a downward curvature. Above the resonance frequency the IC peaks reappear and disperse with an upward curvature. Above the frequency 70 meV, the IC peaks along the diagonal direction occur and dominate over the IC peaks along the parallel direction. This hourglass dispersion is similar to that of the LSCO. While the incommensurability depends strongly on the frequency, different from that of the La-based cases, mainly due to the the different wave vector . The maximum intensity of the spin susceptibility is around the frequency 30-40 meV in the normal state. A pronounced distinction between the YBCO’s and LSCO’s spectra in the normal state is the peak dispersion, namely, for YBCO’s cases, the spin susceptibility is commensurate at all the frequencies considered.
IV discussions

At this stage, we attempt to elaborate the origin of the above features based on the topology of the Fermi surface. The renormalized spin susceptibility [Eq.(2)] consists of two components, i.e., the bare spin susceptibility and the RPA factor []. The imaginary and real parts of the bare spin susceptibilities for K and K are plotted in Fig. 7(a) and 7(b), respectively. At low frequencies, the imaginary part of the bare spin susceptibility at the momentum approaches to zero due to the presence of the superconducting gap, as seen in Fig. 7. Thus the renormalized spin susceptibility also approaches to zero. It has a step-like rise as the frequency approaches to due to the flat band near . As a result, the real part of the bare spin susceptibility Re develops a sharp structure and reaches the maximum at this frequency. For the samples with K, a pole occurs, namely, the real part of the RPA factor Re equals to zero at the frequency , as seen in Fig. 7(a). In fact, the RPA factor plays a major role and the imaginary part of the renormalized spin susceptibility equals to Re/Im at this frequency. As the imaginary part of the spin susceptibility is small due to the spin gap, this suggests the formation of a spin collective mode, ascribed to be the spin resonance. The resonance peak is very sharp so that the peak intensity decreases dramatically as the frequency increases, as seen in Fig. 5. For the case of K, the maximum of the real part of the bare spin susceptibility is much smaller than that of the K’s sample due to the decrease of the superconducting gap. So the pole condition cannot be satisfied even if the stripe order is absent. Furthermore, decreases as becomes , as seen in Fig. 7(b). Thus the existence of the spin-stripe order suppresses further the peak intensity at the expected resonance frequency and the IC peaks are developed at this frequency. While the peak intensity at the frequency is still enhanced by the RPA factor. On the other hand, we can see from Fig. 7(b) that the imaginary part of the bare spin susceptibility has a maximum intensity at the frequency . Because the peak intensity of the renormalized spin susceptibility at the frequency is not as strong and sharp as that of the resonance peak in YBCO samples, the higher frequency component caused by the bare spin susceptibility can still be seen (Fig. 2 and Fig. 3). Thus the spin excitation of LSCO shows a clear feature of two frequency components, with the maximum intensity being at following a broad peak at the frequency . In fact, it is the competition between the bare spin susceptibility and the RPA factor that determines the feature of the renormalized spin susceptibility in LSCO. The role of RPA becomes smaller and smaller as decreases, and is suppressed further by the spin-stripe order. For LBCO samples, the transition temperature is merely K so that the maximum of the real part of the spin susceptibility is even smaller. Meanwhile at some doping the superconductivity is suppressed completely, and thus a strong stripe order may emerge in this sample mood ; vall ; therefore the RPA factor is not important even near the frequency , such that the lower frequency compound is suppressed and only the higher frequency component with the commensurate spin excitation at the frequency 50 meV is observed tra .
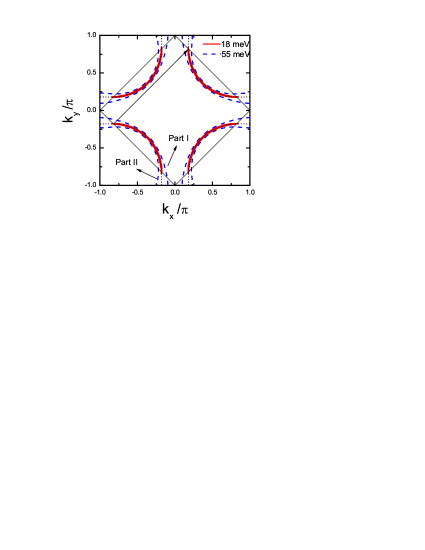
These features of the spin excitation in LSCO can be traced further to the evolution of the Fermi surface. The normal state Fermi surface and the quasiparticle energy contours are plotted in Fig. 8. The energy contour is closed and has a banana shape at low frequencies, with the tips being just at the normal state Fermi surface. The contribution to spin susceptibility comes mainly from the node-to-node excitations as the frequencies are close to zero. Thus the IC peaks are along diagonal direction, and a clear spin gap appears at the parallel direction. As the frequency increases, the spin excitation along parallel direction is present. When the frequency approaches to about 18 meV, the tip of the energy contour reaches the hot spots (the crossing points of the Fermi surface with the magnetic Brillouin zone boundary), as seen in Fig. 8. Thus the bare spin susceptibility has a step-like rise at the momentum , leading to the quasi-resonance at this frequency. The superconducting gap plays a minor role as the frequency increases further, and the energy contour is not closed and contains two parts: (I) and (II), as depicted in Fig. 8. The shapes of the both parts resemble the normal state fermi surface. Part I is just like the underdoped fermi surface, while the part II resembles the overdoped one. As we know, the spin excitation tends to be commensurate and the intensity increases as the doping decreases to near the half-filled case jxli . Therefore, the spin excitation from part I I also tends to be commensurate as the frequency increases, with the intensity being larger than the excitation from part II II, leading to the commensurate spin excitation occurring at the frequency 55 meV. While spin excitation from part II to II also contributes to the spectra, and the peak at this frequency is broader than the lower frequency IC peak at 18 meV.
V summary
Based on the fermiology theories, we have examined the evolution of the spin susceptibility for different systems near the optimal doping. The spin excitation is dominated by a resonance peak in the superconducting state as is high enough, with the resonance frequency being proportional to . The peak intensity becomes weaker as is lower and only quasi-resonance occurs as decreases to 40 K. For LSCO samples, the presence of the spin-stripe order suppresses the resonance further, and the IC peaks develop at the expected resonance frequency (about 18 meV), with the intensity being still enhanced by the renormalized effect of the RPA factor. The intensity of the IC peaks decreases as the frequency increases from 18 meV, then it increases again and reaches the local maximum at the frequency 55 meV, with the spin excitation being commensurate at this frequency. This two-frequency component is originated from the competition between the RPA factor and the bare spin susceptibility. The dispersion of the spin excitation behaves a hourglass shape in both the superconducting and normal states. We also note that the spin excitation may be one dimensional due to the one-dimension spin-stripe order. For YBCO samples, the spin excitation is significantly different from that of LSCO, namely, a clear resonance peak with a large intensity appears at about 40 meV. The higher frequency tail observed in LSCO is not seen in YBCO. On the other hand, the dispersion in the superconducting state is similar to that of LSCO, while it is different in the normal state, namely, the spin excitation is commensurate in the normal state for all the frequencies considered. The present results are consistent with the experiments. We have elaborated all the results based on the topology of the Fermi surface.
Acknowledgements.
This work was supported by the RGC grants of Hong Kong (HKU 7050/03P and HKU-3/05C), the NSFC (10429401), and the 973 project of China (2006CB601002).References
- (1) J. Rossat-Mignod, L. P. Regnault, C. Vettier, P. Bourges, P. Burlet, J. Bossy, J. Y. Henry, and G. Lapertot, Physica C 185-189, 86 (1991).
- (2) H. F. Fong, P. Bourges, Y. Sidis, L. P. Regnault, J. Bossy, A. Ivanov, D. L. Milius, I. A. Aksay, and B. Keimer, Phys. Rev. B 61, 14773 (2000).
- (3) H. A. Mook, M. Yethiraj, G. Aeppli, T. E. Mason, and T. Armstrong, Phys. Rev. Lett. 70, 3490 (1993).
- (4) H. F. Fong, B. Keimer, D. L. Milius, and I. A. Aksay, Phys. Rev. Lett. 78, 713 (1997).
- (5) P. Dai., H. A. Mook, R. D. Hunt, and F. Doan, Phys. Rev. B 63, 054525 (2001).
- (6) C. Stock, W. J. L. Buyers, R. Liang, D. Peets, Z. Tun, D. Bonn, W. N. Hardy, and R. J. Birgeneau, Phys. Rev. B 69, 014502 (2004).
- (7) S. M. Hayden, H. A. Mook, P. Dai, T. G. Perring, and F. Doan, Nature (London) 429, 531 (2004).
- (8) M. Arai, T. Nishijima, Y. Endoh, T. Egami, S. Tajima, K. Tomimoto, Y. Shiohara, M. Takahashi, A. Garrett, and S. M. Bennington, Phys. Rev. Lett. 83, 608 (1999).
- (9) P. Bourges, Y. Sidis, H. F. Fong, L. P. Regnault, J. Bossy, A. Ivanov, B. Keimer, Science 288, 1234 (2000).
- (10) P. Dai, H. A. Mook, and F. Doan, Phys. Rev. Lett. 80, 1738 (1998).
- (11) H. F. Fong, P. Bourges, Y. Sidis, L. P. Regnault, A. Ivanov, G. D. Gu, N. Koshizuka, and B. Keimer, Nature (London) 398, 588 (1999).
- (12) H. He, Y. Sidis, P. Bourges, G. D. Gu, A. Ivanov, N. Koshizuka, B. Liang, C. T. Lin, L. P. Regnault, E. Schoenherr, and B. Keimer, Phys. Rev. Lett. 86, 1610 (2001).
- (13) H. He, P. Bourges, Y. Sidis, C. Ulrich, L. P. Regnault, S. Pailh s, N. S. Berzigiarova, N. N. Kolesnikov, and B. Keimer, Science 295, 1045 (2002).
- (14) S. D. Wilson, P. Dai, Shiliang Li, Songxue Chi, H. J. Kang, and J. W. Lynn, Nature (London) 422, 59 (2006).
- (15) J. M. Tranquada, H. Woo, T. G. Perring, H. Goka, G. D. Gu, G. Xu, M. Fujita, and K. Yamada, Nature (London) 429, 534 (2004).
- (16) N. B. Christensen, D. F. McMorrow, H. M. Rnnow, B. Lake, S. M. Hayden, G. Aeppli, T. G. Perring, M. Mangkorntong, N. Nohara, and H. Takagi, Phys. Rev. Lett. 93, 147002 (2004).
- (17) T. R. Thurston, R. J. Birgeneau, M. A. Kastner, N. W. Preyer, G. Shirane, Y. Fujii, K. Yamada, Y. Endoh, K. Kakurai, M. Matsuda, Y. Hidaka, and T. Murakami, Phys. Rev. B 40, 4585 (1989).
- (18) T. E. Mason, G. Aeppli, and H. A. Mook, Phys. Rev. Lett. 68, 1414 (1992).
- (19) G. Aeppli, T. E. Mason, S. M. Hayden, H. A. Mook, and J. Kulda, Science 278, 1432 (1997).
- (20) M. Fujita, H. Goka, K. Yamada, J. M. Tranquada, and L. P. Regnault, Phys. Rev. B 70, 104517 (2004).
- (21) B. Vignolle, S.M. Hayden, D.F. McMorrow, H. M. Rnnow, B. Lake, C. D. Frost, and T.G. Perring, cond-mat/0701151.
- (22) Q. Si, Y. Zha, K. Levin, and J. P. Lu, Phys. Rev. B 47, 9055 (1993).
- (23) T. Tanamoto, H. Kohno, and H. Fukuyama, J. Phys. Soc. Jpn. 62, 717 (1993).
- (24) T. Tanamoto, H. Kohno, and H. Fukuyama, J. Phys. Soc. Jpn. 63, 2739 (1994).
- (25) D. Z. Liu, Y. Zha, and K. Levin, Phys. Rev. Lett. 75, 4130 (1995).
- (26) J. Brinckmann and P. A. Lee, Phys. Rev. Lett. 82, 2915 (1999).
- (27) D. K. Morr and D. Pines, Phys. Rev. B 61, 6483 (2000).
- (28) Y. J. Kao, Q. Si, and K. Levin, Phys. Rev. B 61, 11898 (2000).
- (29) M. R. Norman, Phys. Rev. B 61, 14751 (2000).
- (30) J. X. Li and C. D. Gong, Phys. Rev. B 66, 014506 (2002).
- (31) J. X. Li, C. Y. Mou, and T. K. Lee, Phys. Rev. B 62, 640 (2000).
- (32) J. X. Li, J. Zhang, and J. Luo, Phys. Rev. B 68, 224503 (2003).
- (33) T. Zhou and J. X. Li, Phys. Rev. B 69, 224514 (2004).
- (34) I. Eremin and D. Manske, Phys. Rev. Lett. 94, 067006 (2005).
- (35) Ying-Jer Kao and Hae-Young Kee, Phys. Rev. B 72, 024502 (2005).
- (36) A. P. Schnyder, D. Manske, C. Mudry, and M. Sigrist, Phys. Rev. B 73, 224523 (2006)
- (37) Hiroyuki Yamase and Walter Metzner, Phys. Rev. B 73, 214517 (2006).
- (38) T. Dahm, D. Manske, and L. Tewordt, Phys. Rev. B 58, 12454 (1998).
- (39) D. Manske, I. Eremin, and K. H. Bennemann, Phys. Rev. B 63, 054517 (2001).
- (40) T. Zhou, Z. D. Wang, and J. X. Li, Phys. Rev. B 75, 024516 (2007).
- (41) A. Ino, C. Kim, T. Mizokawa, Z.-X. Shen, A. Fujimori, M. Takaba, K. Tamasaku, H. Eisaki, and S. Uchida, J. Phys. Soc. Jpn. 68, 1496 (1999).
- (42) A. Ino, C. Kim, M. Nakamura, T. Yoshida, T. Mizokawa, A. Fujimori, Z.-X. Shen, T. Kakeshita, H. Eisaki, and S. Uchida, Phys. Rev. B 65, 094504 (2002).
- (43) T. Yoshida, X. J. Zhou, D. H. Lu, Seiki Komiya, Yoichi Ando, H. Eisaki, T. Kakeshita, S. Uchida, Z. Hussain, Z.-X. Shen and A. Fujimori, cond-mat/0610759.
- (44) Hiroyuki Yamase, Phys. Rev. B 75, 014514 (2007).
- (45) F. Kruger and S. Scheidl, Phys. Rev. B 67, 134512 (2003).
- (46) E. W. Carlson, D. X. Yao, and D. K. Campbell, Phys. Rev. B 70, 064505 (2004).
- (47) M. Vojta and T. Ulbricht, Phys. Rev. Lett. 93, 127002 (2004).
- (48) G. S. Uhrig, K. P. Schmidt, and M. Gruninger, Phys. Rev. Lett. 93, 267003 (2004).
- (49) G. S. Uhrig, K. P. Schmidt, and M. Gruninger, J. Phys. Soc. Jpn. 74, 86 (2005).
- (50) B. M. Andersen and P. Hedegard, Phys. Rev. Lett. 95, 037002 (2005).
- (51) G. Seibold and J. Lorenzana, Phys. Rev. Lett. 94, 107006 (2005).
- (52) G. Seibold and J. Lorenzana, Phys. Rev. B 73, 144515 (2006).
- (53) D. X. Yao, E. W. Carlson, and D. K. Campbell, Phys. Rev. B 73, 224525 (2006).
- (54) J. M. Tranquada, B. J. Sternlieb, J. D. Axe, Y. Nakamura, and S. Uchida, Nature (London) 375, 561 (1995).
- (55) N. Ichikawa, S. Uchida, J. M. Tranquada, T. Niemoller, P. M. Gehring, S.-H. Lee, and J. R. Schneider, Phys. Rev. Lett. 85, 1738 (2000).
- (56) M. Fujita, H. Goka, K. Yamada, and M. Matsuda, Phys. Rev. Lett. 88, 167008 (2002).
- (57) H. A. Mook, P. Dai, F. Doan, and R. D. Hunt, Nature (London) 404, 729 (2000).
- (58) V. Hinkov, S. Pailhes, P. Bourges, Y. Sisis, A. Ivanov, A. Kulakov, C. T. Lin, D. P. Chen, C. Bernhard, and B. Keimer, Nature (London) 430, 650 (2004).
- (59) N. B. Christensen, H. M. Ronnow, J. Mesot, R. A. Ewings, N. Momono, M. Oda, M. Ido, M. Enderle, D. F. McMorrow, and A. T. Boothroyd, cond-mat/0608204.
- (60) T. Sato, T. Kamiyama, Y. Naitoh, T. Takahashi, I. Chong, T. Terashima, and M. Takano, Phys. Rev. B 63, 132502 (2001).
- (61) T. Sato, H. Matsui, S. Nishina, T. Takahashi, T. Fujii, T. Watanabe, and A. Matsuda, Phys. Rev. Lett. 89, 067005 (2002).
- (62) D. L. Feng, A. Damascelli, K. M. Shen, N. Motoyama, D. H. Lu, H. Eisaki, K. Shimizu, J. Shimoyama, K. Kishio, N. Kaneko, M. Greven, G. D. Gu, X. J. Zhou, C. Kim, F. Ronning, N. P. Armitage, and Z.-X Shen, Phys. Rev. Lett. 88, 107001 (2002).
- (63) M.R. Norman, M. Randeria, H. Ding, and J. C. Campuzano, Phys. Rev. B 52, 615 (1995).
- (64) A. R. Moodenbaugh, Youwen Xu, M. Suenaga, T. J. Folkerts, and R. N. Shelton, Phys. Rev. B 38, 4596 (1988)
- (65) T. Valla, A. V. Fedorov, Jinho Lee, J. C. Davis, G. D. Gu, Science 314, 1914 (2006).