Infrared High-Resolution Spectroscopy of
Post-AGB Circumstellar Disks.
I. HR 4049 – The Winnowing Flow Observed?
Abstract
High-resolution infrared spectroscopy in the 2.3-4.6 m region is reported for the peculiar A supergiant, single-lined spectroscopic binary HR 4049. Lines from the CO fundamental and first overtone, OH fundamental, and several H2O vibration-rotation transitions have been observed in the near-infrared spectrum. The spectrum of HR 4049 appears principally in emission through the 3 and 4.6 m region and in absorption in the 2 m region. The 4.6 m spectrum shows a rich ‘forest’ of emission lines. All the spectral lines observed in the 2.3-4.6 m spectrum are shown to be circumbinary in origin. The presence of OH and H2O lines confirm the oxygen-rich nature of the circumbinary gas which is in contrast to the previously detected carbon-rich material. The emission and absorption line profiles show that the circumbinary gas is located in a thin, rotating layer near the dust disk. The properties of the dust and gas circumbinary disk and the spectroscopic orbit yield masses for the individual stars, M0.58 M⊙ and M0.34 M⊙. Gas in the disk also has an outward flow with a velocity of 1 km s-1. The severe depletion of refractory elements but near-solar abundances of volatile elements observed in HR 4049 results from abundance winnowing. The separation of the volatiles from the grains in the disk and the subsequent accretion by the star are discussed. Contrary to prior reports, the HR 4049 carbon and oxygen isotopic abundances are typical AGB values: 12C/13C=6 and 16O/17O200.
1 Introduction
HR 4049 is the prototype for a class of peculiar, post-AGB, single-lined, long-period, spectroscopic binaries (van Winckel et al., 1995). The primary star of these binaries is an early-type supergiant with very peculiar abundances. Most objects in this class exhibit strong infrared excesses of circumstellar origin with carbon-rich circumstellar dust typically present. The combination of carbon-rich material, high luminosity, and location out of the galactic plane forms the basis for the post-AGB designation. The peculiar designation stems from a photospheric abundance pattern characterized by a severe deficiency of refractory (high dust condensation temperature) elements and a near-solar abundance for volatile (low dust condensation temperature) elements. The abundance anomalies indicate that the present photosphere contains material from which refractory elements have been very largely removed, i.e., a winnowing of dust from gas has occurred.
The basic characteristics of the prototype object HR 4049 are well known. The photosphere has an effective temperature of about 7500 K and shows extreme abundance differences between refractory and volatile elements: for example, HR 4049 has [Fe/H]-4.8 but [S/H]-0.2 (Waelkens et al., 1991b; Takada-Hidai, 1990). The orbital period of HR 4049 is 430 days (Waelkens et al., 1991a), leading to a minimum separation between the two stars of 190 R⊙. Bakker et al. (1998) pointed out that the orbit requires a phase of common envelope evolution when the primary was at the tip of the AGB and had a radius of 250 R⊙. This phase altered the masses and abundances of the components.
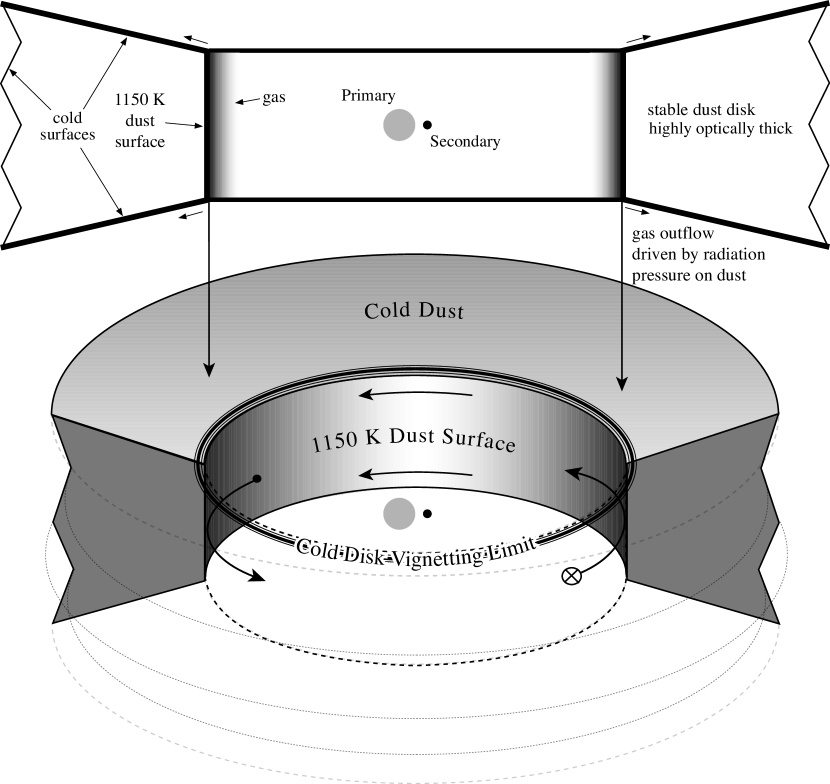
The HR 4049 infrared excess is pronounced redward of 1 m and is very well fit by a single blackbody at a temperature of about 1150 K and attributed to radiation from the tall inner walls of an optically thick circumbinary disk (Dominik et al., 2003). A circumbinary Keplerian rotating disk appears a common feature of the HR 4049 class of post-AGB binaries (De Ruyter et al., 2006). The inner walls of the HR 4049 circumbinary disk are 10 AU from the binary or 50 times the radius of the supergiant. Our line of sight to the binary nearly grazes the edge of the disk; the angle of inclination of the line of sight to the normal to the disk is about 60∘. A cartoon of the system is shown in Figure 1.
Superimposed on the infrared dust continuum are emission features. Waters et al. (1989) detected features due to polycyclic aromatic hydrocarbons (PAHs). This result was confirmed by the ISO/SWS spectrum of Beintema et al. (1996). Geballe et al. (1989) confirmed a C-rich circumstellar environment by detecting 3.43 and 3.53 m emission features later identified with hydrogen-terminated crystalline facets of diamond (Guillois et al., 1999). Remarkably, Dominik et al. (2003) report that the gas molecular species seen in the infrared (ISO) spectrum are those expected of an O-rich mixture, suggesting that the HR 4049 circumbinary environment is a blend of C-rich dust and O-rich gas.
Optical spectroscopy offers some information on the disk’s gas. Bakker et al. (1998) report changes in the H line profile with orbital phase. Bakker et al. (1998) and Bakker et al. (1996) detected a broad (15 km s-1) stationary emission component in the Na I D2 and [O I] 6300 Å lines which they attributed to the circumbinary disk. However, the infrared offers much more readily interpreted signatures of gas in and around the binary. Lambert et al. (1988) detected the 12C16O first overtone spectrum in absorption with an excitation temperature of about 300 K. Cami & Yamamura (2001) on analyzing an ISO/SWS spectrum of CO2 emission bands found strong contributions from isotopomers containing 17O and 18O which they interpreted as 16O/17O = 8.3 2.3 and 16O/18O = 6.90.9.
The origins of the HR 4049 class of chemically peculiar supergiants and the structure of their circumbinary/circumstellar material remain ill-understood. New observational attacks appear to be essential. In this paper we report on a detailed look at several regions of the 2-5 m infrared spectrum of HR 4049.
2 Observations & Data Reduction
The spectrum HR 4049 was observed at high resolution at a number of near-infrared wavelengths in the 2.3 to 4.6 m region using the 8 m Gemini South telescope and the NOAO high-resolution near-infrared Phoenix spectrometer (Hinkle et al., 1998, 2000, 2003). Phoenix is a cryogenically cooled echelle spectrograph that uses order separating filters to isolate sections of individual echelle orders. The detector is a 10241024 InSb Aladdin II array. Phoenix is not cross dispersed and the size of the detector in the dispersion direction limits the wavelength coverage in a single exposure to about 0.5%, i.e. 1550 km s-1, which is 0.012 m at 2.3 m (22 cm-1 at 4300 cm-1) and 0.024 m at 4.6 m (11 cm-1 at 2100 cm-1). One edge of the detector is blemished so the wavelength coverage is typically trimmed a few percent to avoid this area. Wavelength coverage is limited overall to 0.9-5.5 m by the InSb detector material. All the spectra discussed here were observed with the widest (0.35 arcsecond) slit resulting in a spectral resolution of R=/= 50,000. The central wavelengths of the regions observed are listed in Table 1.
The thermal brilliance of the sky makes observations longward of 4 m much more difficult than in the non-thermal 1-2.4m region. However, for a bright star like HR 4049 this only slightly increases the already short integration time. Thermal infrared observations were done using standard infrared observing techniques (Joyce, 1992). Each observation consists of multiple integrations at several different positions along the slit, typically separated by 4″ on the sky. At thermal infrared wavelengths the telluric lines are in emission. In order not to saturate the telluric emission lines the limiting exposure time is about 30 seconds at 4.6 m. For longer integration times, multiple exposures can be coadded in the array controller to make up a single exposure. However, HR 4049 is so bright that total exposure times of only 10 to 20 seconds were required. The delivered image FWHM at the spectrograph varied from 0.25″– 0.80″during the nights that spectra were taken. With the positions along the slit separated by several arcseconds the resulting spectral images were well separated on the detector.
An average flat observation minus an average dark observation was divided into each frame observed and frames with the star at different places along the slit were then differenced and the spectrum extracted using standard IRAF111The IRAF software is distributed by the National Optical Astronomy Observatories under contract with the National Science Foundation. routines. A hot star, with no intrinsic spectral lines in the regions observed, was also observed at each wavelength setting. The hot star was observed at airmass near that of HR 4049 and the HR 4049 spectrum was later divided by the hot star spectrum to ratio the telluric spectrum from the HR 4049 star spectrum. Wavelength calibrations were computed by using a set of telluric wavelengths obtained from the hot star spectra. The wavelength calibration yielded residuals of typically 0.25 km s-1.
Observations of HR 4049 were taken in the 2 and 3 m region as well as the 4.6 m region. For a bright star the stellar signal is much stronger than background radiation in these spectral regions and as a result the observations are much less challenging than 4.6 m observations. The Phoenix observing technique for this spectral region has previously been described in Smith et al. (2002).
3 Analysis of the Spectra
Observations of the 2.3, 3.0, and 4.6 m regions reveal lines from just three molecular species: CO, OH, and H2O. As discussed in §1, HR 4049 has a carbon-rich circumstellar envelope but we did not identify any molecules associated with conditions where CO. In the 4.6 m region we searched for C3 and CN which should be prominent if CO. Rather, we report on the new detection of a rich 4.6 m forest of CO fundamental and H2O lines. The 4.6 m region atomic hydrogen lines Pfund and Humphreys , if present, are blended with H2O lines. The 4.6 m HR 4049 emission line spectrum is very rich making the identification of occasional atomic features problematic. The circumstellar continuum at 4.6 m is approximately 25 times more intense than the continuum of the supergiant (Dominik et al., 2003) so features of stellar origin will be highly veiled. At 3 m we make a first detection of the OH fundamental vibration-rotation lines in HR 4049. Before exploring the emission line spectrum, we revisit in §3.1 the 2.3 m CO first overtone spectrum detected previously by Lambert et al. (1988).
All velocities in this paper are heliocentric. In order to compare heliocentric velocities of HR 4049 with microwave observations add -11.6 km s-1 to convert to the local standard of rest.
3.1 CO First Overtone
Our observations confirm and extend the discovery of first-overtone (v=2) vibration-rotation CO lines in absorption (Lambert et al., 1988). At the 2.3 m wavelength of the CO first overtone, the continuum from the dust is about four times that of the supergiant. Thus, the CO absorption lines should be formed along the lines of sight to the circumbinary disk. By inspection (Figure 2), it is apparent that the rotational and vibrational temperatures are low; high rotational lines of the 2-0 band are absent and the 3-1 (and higher) bands are weak or absent relative to the low rotational lines of the 2-0 band. All of the prominent lines are attributable to the most common isotopic variant, 12C16O, but weak 2-0 13CO lines are detectable222We follow the convention of omitting the superscript mass number for the most common isotope. Hence 12C16O appears as CO, etc..
The first set of observations from February 2002 show the CO lines at a radial velocity of -330.5 km s-1. The lines reach maximum strength at J”7, suggesting a rotational excitation temperature of 300 K. At J”=7, the R branch lines are about 17% deep and are resolved with a FWHM of 16 km s-1 compared to the instrumental resolution of 6 km s-1. Weak 13CO lines are detected with depths for the R18 to R23 lines of about 4%. Comparing lines of similar excitation suggests that 12C/13C10. The observed regions cover the strongest predicted C17O lines (2-0 lines near J” 7) but these lines can not be convincingly identified in the spectra (Figure 2) demanding C16O/C17O 100. A yet more stringent limit can be applied (§4) by modeling.
After the original observations, additional data were collected to extend the excitation range of the lines. For instance, observations made in December 2002 included higher J lines than observed previously. Observations in December 2005 covered the low J P branch required for curve-of-growth analysis. Some wavelength intervals were reobserved over the 2002 – 2005 interval to check for variability. The radial velocity was in all cases unchanged from the -33 km s-1 measured in the original data set. This velocity is nearly equal to the -32.09 0.13 km s-1 systemic velocity of the spectroscopic binary (Bakker et al., 1998).
The CO first overtone line profiles are symmetrical with no hint of an emission component. The line strengths showed no temporal variability. In fact, the line intensities are quite similar to those reported by Lambert et al. (1988). Similarly, the velocity is identical to the earlier reported value. The profile of the lowest excitation line, 2-0 R0, differs from others in that it possibly has a weak blue-shifted component. However, the 2-0 R0 line lies in a region with a complex telluric spectrum which is difficult to ratio out of the HR 4049 spectrum. In the February 2003 spectrum, the 2-0 R0 line appears to have components at -23.6 and -32.9 km s-1. On other dates, the blue-shifted component is less clearly resolved suggesting that it is either of variable velocity, affected by overlying emission of variable intensity and/or velocity, or a relic of the reduction process. If this blue-shifted component exists, it must originate in very cold gas (T 5 K) because the component is not detectable in the 2-0 R1 line.
3.2 CO Fundamental
In sharp contrast to the spectrum at 2.3 m where a sparse collection of weak absorption lines are found, the spectrum near 4.6 m is rich in emission lines (Figure 3). Emission lines were identified from four isotopic variants: CO, 13CO, C17O, and C18O with roughly equal intensities for all variants. The rarer isotopic variants 13C17O, 13C18O, and 14CO were searched for but are not present. Absorption below the local continuum is also seen in the profiles of the lowest excitation 1-0 CO lines in this interval. The observed spectral interval provides lines mostly from the 1-0 and 2-1 CO bands but a few R branch lines of the 3-2 CO band are clearly present. The maximum observable rotational level, J”30, is similar to that seen in the CO first overtone. Table 2 lists the detected fundamental lines of the four CO isotopic forms.
Blending with other lines of different CO isotopes, vibration-rotation transitions, or H2O lines is common and results in an apparent variety of profiles. All unblended emission lines are double-peaked – see Figures 4 – 8. For all but the lowest excitation lines the blue and red peaks are of similar intensity, but characteristically with the blue peak slightly weaker than the red, and occur at velocities of -38.9 0.4 and -28.4 0.5 km s-1, respectively. The central valley of the emission profile has a velocity of -33.7 0.3 km s-1. Velocities are not dependent on the isotopic species. The observed, i.e. uncorrected for instrumental profile, full-width at zero intensity (FWZI) of the emission profile for the weaker lines is 27 km s-1, with stronger lines having FWZI up to 35 km s-1. Due to the high line density, the FWZI is a difficult parameter to measure and our values carry an uncertainty of several km s-1. The observed full-width at half maximum (FWHM) similarly depends on the line strength but much less dramatically than the FWZI. Typical FWHM values are 19 km s-1.
At the observed resolution of /=50000, the instrument profile has a significant impact on the observed line profiles and FWZI. Assuming a Gaussian instrumental profile equal to the 6 km s-1 FWHM spectral resolution, deconvolution of this instrumental profile from the observed line profile gives a true FWZI of 18 km s-1. The line profiles are strongly smoothed by the instrumental profile. The observations show blue and red sides of the CO lines rising 20% above the body of typical CO emission lines with the peak at each edge having a FWHM of 4 km s-1. For more strongly saturated lines, e.g. low excitation 13CO lines the FWHM of the blue and red emission spikes are 8 km s-1. The intrinsic profile clearly has much stronger emission peaks.
The combined absorption-emission profile for the 1-0 CO lines is shown best by the R2 and R5 lines (Figure 9). After allowance for similar blends, the profiles of the CO R1, 2, 3, and 4 lines can be judged very similar to that of the R5 line. The profile of the R0 line is possibly of the same type but blending is more severe. The R5 profile is almost a P Cygni profile: blue absorption accompanied by red emission. However, the absorption component is not strongly blue shifted but has a velocity very similar to that of the absorption lines in the other fundamental lines and to that of the 2-0 lines.
Absorption below the continuum is seen only in the 1-0 P and R branch CO lines (Figure 3 – 8). The observed interval includes the P1, P2, P3 and R0, R1, R2, R3, R4, and R5 lines with definite absorption below the local continuum seen in all these lines except P1 and R0. The strength of the absorption at R5 suggests absorption below the local continuum should be detectable to higher J lines of the R branch. Due to the isotopic shifts, the low J 1-0 lines of the isotopic variants are not in the observed interval. The lowest member of the R branch in our spectra is J” = 9 for 13CO, J” = 10 for C18O, and J” = 3 for C17O. All the 1-0 lines regardless of isotopic species have a stronger central valley than the vibrationally excited transitions. The valley almost reaches the local continuum for the 1-0 13CO lines (note 13CO 1-0 R10 and R11 in Figure 7).
The central valley in the line profiles becomes asymmetric for the stronger lines. Self-absorption of the blue emission is obvious when comparing the strength of the blue and red emission in profiles of the 1-0 CO lines (Figure 9). The 1-0 CO line central absorptions are on average 76% broader on the blue side than the red side. The weaker 13CO 1-0 central absorptions are 20% broader on the blue side. The central absorption is systemically blue shifted relative to the velocity of the binary (Bakker et al., 1998) for the very lowest excitation lines. The shift increases with decreasing J”, with a shift of 1 km s-1 for R5 and 3.5 km s-1 for R2 (Figure 10).
The intensities of the emission lines of CO, 13CO, C17O, and
C18O are remarkably similar and quite different from the
abundance ratios estimated from the 2-0 lines. Peak intensities of the
following representative unblended lines illustrate this point:
CO: 1-0 R2 28%, 2-1 R11 27%, 3-2 R11 11%
13CO: 1-0 R12 24%, 2-1 R17 14%
C17O: 1-0 R11 9%, 2-1 R17 14%
C18O: 1-0 R14 14%
In contrast to the ratio CO/13CO 10 from the 2-0 lines, the CO/13CO intensity ratio from 1-0 and 2-1 lines of similar J is about 1.5. Even more striking is the appearance of fundamental lines of C17O and C18O with intensities about one-half that of similar lines of CO. Yet, CO/C17O 100 from the first-overtone lines. The simplest interpretation of these contrasting ratios is that emitting regions are optically thick in all the observed fundamental lines. As is well known, the first-overtone transitions are much weaker than the fundamental lines. Optically thin emission in fundamental and first-overtone lines from a common upper state in the second vibrational level will differ by a factor of about 100 in flux. In the case of absorption from a common state in the ground vibrational level, the absorption coefficient of the 1-0 line is similarly about factor of 100 stronger than the 2-0 line.
The strengthening of the central absorption for the lowest energy vibrational transition, the asymmetric absorption, and absorption below the continuum require the presence of an absorbing gas cooler than the emitting gas. This absorbing gas has a velocity shifted to the blue of the system barycentric velocity (-32.1 km s-1) by 1 to 3.5 km s-1. The emitting gas covers a 18 km s-1 range of velocity but is also shifted by -1.5 km s-1 relative to the barycentric velocity.
3.3 OH Fundamental
The lowest excitation OH vibration-rotation 1-0 lines are in a region of considerable telluric obscuration. J”=4.5 is the lowest OH level accessible under typical water vapor conditions (a few mm of precipitable H2O) at Gemini South. However, a suitable order sorting filter was not available for the J”=4.5 wavelength. An observation was made of the P branch line region for J”=5.5. The OH ground state results in -doubled rotational levels, so each rotational line is divided into four components. As a result, in spite of the large rotational line spacing for OH, several OH lines can appear in a Phoenix spectrum taken with a single grating setting. The 3.0 m 1-0 P2f5.5 and P2e5.5 lines were detected in the spectrum of HR 4049 (Fig. 11). This spectral region has considerable telluric absorption. The removal of this absorption results in variable noise in the ratioed spectrum.
The OH lines are, as are the CO lines, seen in emission. The profiles are similar to those of CO with double peaked profiles of observed FWZI 26 km s-1 centered at -35 km s-1. The two OH lines observed are just 5% above the continuum. These were the only lines that were detected in the 3.0 m spectral region observed.
3.4 H2O Vibration-Rotation Lines
The asymmetric top molecule H2O is known for the complexity, apparent lack of rotational structure, and richness of its spectrum. As a result H2O lines are much more challenging to identify than vibration-rotation lines of simple diatomic molecules (Hinkle & Barnes, 1979). Emission lines are clearly present in the 4.6 m HR 4049 spectrum from three vibration-rotation bands: , , and . With the above caveats on the H2O spectrum and based on the tentative identification of four lines, the vibrationally excited band possibly also contributes to the 4.6 m spectrum. The strongest observed H2O transitions are from the band. A number of lines identified with this band have intensities 20% above continuum. Typical H2O lines are weaker than typical CO lines, with many of the H2O lines identified having intensity 10% above continuum.
Table 3 presents a list of the H2O lines tentatively identified in the HR 4049 spectrum. In Figures 4 - 9 these lines are labeled on the spectrum of HR 4049. Many lines (e.g. Figure 9) are unblended and clearly present. However, a fairly large number are blended with CO or other H2O lines. Due to the overlapping H2O energy levels, the line strengths of H2O lines can vary significantly between adjacent vibration-rotational transitions and, hence, the contribution of a H2O line to a blend is uncertain.
The band strength, , is a factor of five lower for the band than the band. However, the band strength for the band is more than 106 higher than that of either of these bands (McClatchey et al., 1973). The origin of the band is 1.5 m red of the region observed. While it would be of interest to observe the lowest excitation lines, for ground based observers the telluric lines are very strong and prevent observations in 6 m region. The band has similar band strength to the and combination bands but, unlike these bands which have origins in the regions observed, has an origin near that of . This adds to our suspicion of the identifications.
Like CO and OH lines the 4.6 m H2O lines have a double peaked profile with emission peaks at -38.6 and -29.2 km s-1 and absorption at -33.6 km s-1. The observed FWZI of the weaker H2O lines is 25 km s-1, perhaps slightly more narrow than the CO lines.
In addition to the observed 4.6 m transitions, H2O also has low excitation transitions in the 3.0 and 2.3 m regions. In particular the band crosses the 3 m region and has a band strength similar to that of the . The band is also present in the 3 m region and, while weaker than or , is a much stronger transition than the combination bands seen at 4.6 m. Our 3.0 m observation has an uneven continuum perhaps as a result of weak emission features. We undertook a detailed search for H2O lines but failed to identify any 3.0 m H2O lines. Future searches of this region for H2O lines using higher signal-to-noise data and wider wavelength coverage are justified. On the other hand, our spectra in the 2.3 m region are of very high quality with broad wavelength coverage and this region is clearly devoid of any contribution from H2O.
3.5 Line Profile Overview
In summary of the above subsections, CO vibration-rotation fundamental lines of four differently isotopically substituted species and H2O vibration-rotation lines populate the 4.6 m region. These lines all have double peaked emission profiles of total (including both peaks) FWHM 19 km s-1. There is little difference of intensity between lines of different isotopes. The lowest excitation lines, which are only seen in 12C16O in the wavelength range observed, have a central absorption as much as 20% below the local continuum. This central absorption overwhelms the bluest of the double peaks in the emission profile but the extreme bluest edge of the emission remains. Examples of observed CO fundamental and H2O line profiles are given in Fig. 9. OH lines from the fundamental vibration-rotation transition were seen in the 3 m region. The OH lines are in emission with double peaked profiles similar to those seen in the CO fundamental and H2O lines. The CO vibration-rotation first-overtone transition appears in absorption in the 2.3 m region. The absorption lines are nearly as broad as the CO emission lines, FWHM 16 km s-1, but have simple Gaussian profiles and exhibit a range of line depths suggesting the lines are optically thin. 12CO dominates but weaker 13CO is detectable. The oxygen isotopes are not present. All spectral lines in the 2-5 m region have a small ( 1 km s-1) shift blue of the systemic velocity.
4 Modeling the Molecular Probes
The fundamental spectrum presents a difficult analysis task. The CO is seen in both emission and, for the very lowest excitation CO lines, absorption. The small change in intensity for emission lines over the full range of isotopes and over a large range of excitation energy (rotational levels J”=0 to 30 and vibrational transitions 1-0 to 3-2) clearly indicates that the emission lines are very saturated. A detailed investigation of these strongly saturated lines would require detailed radiative transfer and disk modeling beyond the scope of this paper.
However, analysis of the CO first overtone lines, which are seen in absorption, is a much more tractable problem. The observations cover nearly all 12C16O 2-0 R branch lines from J”=0 through the highest detectable R branch line at J”=35. The largest interval of the 2-0 R branch not observed is R24 through R28. The 2-0 P branch was observed from P1 through P8. The 3-1 R branch from J” 4 also lies in the observed region. Equivalent widths of the first overtone CO line profiles were measured from the fully processed, normalized spectra. The lines were measured both by summing the absorption area and second by Gaussian fits to the line profiles. Uncertainties were estimated from the mean deviations from the Gaussian fits and by the formal uncertainty in the fitted continuum level.
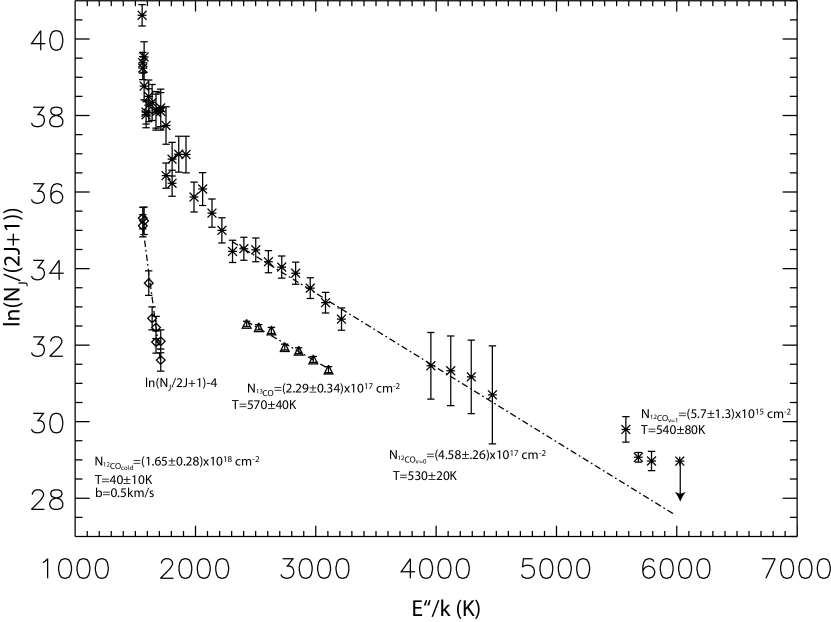
Equivalent width data was used to produce an excitation plot (Figure 12). The log-linear increase of line strength with excitation level demonstrates that the high-J v=2-0 lines (J15) are optically thin (i.e. 0.7). A least squares fit to the excitation plot of these data requires a temperature of 550 K. However, the fit to these lines underestimates the column density of the low-J lines. To infer the temperature and optical depth of the low-J lines, we extrapolated the column density of the hot gas (inferred from the high-J lines) and subtracted that from the measured column density.
In order to correct for the effects of saturation, column densities and level populations were determined from a curve of growth (COG) analysis (c.f. Spitzer, 1978; Brittain et al., 2005), which relates the measured equivalent widths to column densities by taking into account the effects of opacity on a Gaussian line profile. The derived column density for a measured equivalent width only depends upon one parameter, the Doppler broadening of the line, = /1.665, where is the RMS linewidth. To find the value of , we apply two complementary methods: comparison of the P and R branch lines and the linearization of the excitation plot. A key assumption is that the small scale line broadening results entirely from thermal broadening. The resolved line profiles which are seen in the spectra indicate an additional large scale broadening mechanism which will be discussed in §5.1.
CO exhibits absorption lines in both P (J”=J’+1) and R (J”=J’-1) branches, which have different oscillator strengths yet probe the same energy levels, e.g., the P1 absorption line originates from the same J=1 level as the R1 absorption line. Any differences in the column density derived from lines that share a common level must be due to optical depth, which is related to . The line width, , can be used to determine the optical depth and adjusted so that the derived level populations from the two branches agree as closely as possible.
The (v=0, low-J) transitions are thermalized at densities as low as nH 103-4 cm-3, and at even lower densities due to radiative trapping in the rotational lines with high opacity. Therefore, the low-J lines are the ones most likely to exhibit a thermal population distribution. The line width that best linearizes a plot of the level populations to a common temperature in an excitation diagram is used.
Subject to the above constraints, the best fitting value in the COG analysis for HR 4049 is 0.50.1 km s-1. The consistency of all data to this common velocity dispersion is depicted in the excitation plot of Figure 12. With a measurement of , equivalent widths can be directly related to column density. The column density from fitting the 2-0 ‘high-J’ lines is 4.60.31017 cm-2 at a temperature of 53020 K. The column density of the ‘low-J’ lines is 1.60.21018 cm-2 at a temperature of 4010 K. Uncertainty in the hot N(12CO) from the overtone lines, estimated from the measurement of unsaturated lines, is small and dominated by measurement errors in the equivalent widths of the lines. The uncertainty in the cold gas is dominated by the uncertainty in . Assuming that the 0.5 km s-1 b value for the cold gas applies to all the spectral lines, the opacity of the most optically thick line is 1.5. Increasing the b value for the hot gas lowers the optical thickness of the higher excitation lines.
The detection of weak 3-1 lines allows a check on vibrational LTE in the gas. The column of CO in the v=1 state (from the v=3-1 lines) is (5.71.3)1015 and the temperature is 54080K. This is consistent with the temperature for the hot component of the v=0 12CO and 13CO branches (53020 and 57040 respectively). The combined 2-0 and 3-1 data give a rotational temperature of 62020K. The vibrational temperature is 70050K. This is consistent with a slight overpopulation of the v=1 state although the relative rotational populations are consistent. The vibrational temperature is more uncertain than the other temperatures and evidence for non-LTE populations is weak.
Using the best fitting value, the column density can be determined for other isotopic lines in the spectrum. The corresponding column density of 13CO is 2.30.31017 cm-2 at a temperature of 57040 K. Comparing lines of similar excitation, 12C/13C ratio is 6. First overtone C17O lines could not be detected. The strongest lines, assuming a 550 K excitation temperature, that are clear of both major telluric features and blending CO lines are R5 and R8 (Fig. 2). A firm upper limit on the equivalent width of these lines is 1.7 mÅ which translates to a column density of 61014 cm-2. At a temperature of 550 K, this corresponds to a total column density of C17O of less than 11016 cm-2. Allowing for the temperature uncertainty a 3 limit for 16O/17O is 200.
5 Discussion
The basic characteristics of the HR 4049 system are well understood. At the heart of HR 4049 is a single-lined spectroscopic binary (Bakker et al., 1998). The visible early A/late B supergiant is a low mass, perhaps white-dwarf mass, post-AGB star. The unseen companion is an M dwarf or white dwarf of lower mass than the supergiant. The infrared prominent feature of the HR 4049 system is the circumbinary shell. Antoniucci et al. (2005) review the various geometries proposed for the circumbinary material. Considerable evidence now points to a thick disk geometry. Detailed arguments are presented by Dominik et al. (2003).
In the following discussion we adopt the Dominik et al. (2003) disk model (Figure 1) with the following key points. The disk is optically thick with a height-to-radius ratio 1/3. The dust on the interior disk surface facing the star is approximately isothermal at 1150 K. The temperature of the dust wall implies a distance between the star and dust of 10 AU. The variability of HR 4049 and the hydrostatic scale height suggests that the inclination of the disk is 60∘ (i.e. the plane of the disk is tipped 30∘ from the line of sight). The optical depth of the dust, the height of the disk, and the inclination result in only the far side of the disk being observable (Figure 1).
5.1 Circumbinary Flow
Previous observations of the CO first overtone are reported by Lambert et al. (1988). Based on an excitation temperature of 300 100 K and a non-stellar velocity Lambert et al. (1988) conclude the CO is circumstellar. The much higher resolution and S/N data analyzed above refine the excitation temperature to 520 20 K for the higher excitation lines and 4010 K for the low excitation lines. The velocities reported here and those reported by Lambert et al. (1988) show no change over nearly 20 years, as expected for lines of circumbinary origin. Although of the current data is of higher precision, both data sets are consistent with an outflow velocity of 1 km s-1. The column densities reveal that about four times more cool gas, 21018 cm-2, is present than hot gas, 51017 cm-2.
The observations demonstrate that the gas is in rotational LTE and near or in vibrational LTE. For vibrational equilibrium the critical density is n 1010 cm-3 (Najita et al., 1996). Taking this density and a CO column density of 21018 cm-2, the thickness of the CO absorption line forming region is 41011 cm. So the gas is restricted to a zone radially 6 R⊙ from the disk inner dust wall. The CO appears to depart slightly from vibrational LTE, so the density is likely slightly lower than the critical density. In any case, the thickness of the gas layer is certainly thin compared to the 2150 R⊙ spacing between the binary and dust wall.
If the gas layer is located radially just on the star side of the dust wall, adopting the Dominik et al. (2003) geometry permits the total gas mass to be calculated. Taking the radius to be 10 AU and the height of the disk to be 1/3 the radius, the surface area of the cylindrical wall follows. The column density then gives the total number of CO molecules. Since the gas is oxygen rich, the number of CO molecules is limited by the carbon abundance. Taking [C/H] for HR 4049 from Waelkens et al. (1996) and the solar carbon abundance of Grevesse et al. (1991), the mass of the gas disk is 6 1026 gm, i.e. 0.1 M⊕. A total disk mass of a 33 M⊕ was suggested by Dominik et al. (2003), so the mass estimates are in accord with a thin gas zone at the edge of a more massive dust disk.
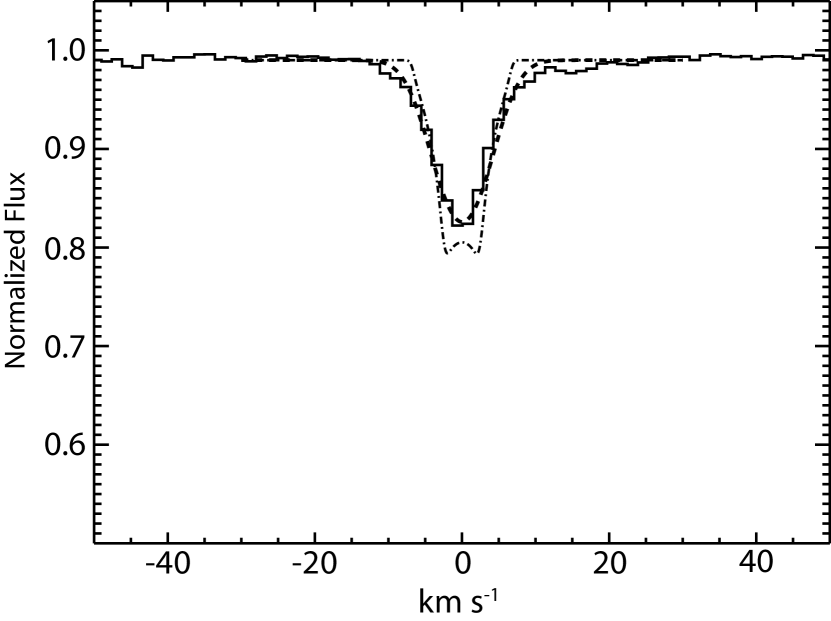
The CO first overtone lines are symmetric and 16 km s-1 across. In contrast, a line width 20 times smaller, 0.5 km s-1, is required to model the curve of growth. A 0.5 km s-1 width is consistent with thermal broadening. We suggest that the broadening to 16 km s-1 is due to a systemic flow of gas in the circumstellar shell. As noted above, our view of the dust disk continuum is limited to the side opposite from the star (Figure 1), so many kinds of axisymmetric flows could result in the observed line broadening. We consider the line shapes to constrain further our understanding of the flow.
All the unblended 4.6 m emission line profiles, including those for weaker lines, are double peaked. Since the lines are double peaked, we discount self-absorption as the principal cause for this line shape. Double peaked lines suggest an origin in a rotating ring or disk. The observation of CO fundamental band absorption demands a P-Cygni type geometry, i.e., an emitting area extended relative to the continuum forming area. While emission is very dominant in the 4.6 m HR 4049 spectrum, there is a hint of underlying and offset absorption in all the lines with the emission line profiles having a lower peak on the blue side than on the red side. The spectrum is dominated by saturated lines 10-20% above the continuum. However, some lines are stronger and we assume these stronger lines result as optical thick transitions cover larger areas. At 3 m radiation from a 550 K blackbody is about half that at 4.6 m and, indeed, the 3 m OH v=1 lines are 5% above continuum. Ultimately saturation combined with the physical extent of the line forming region demands a limited range of emission line strengths. The strongest lines in the 4.6 m CO spectrum of HR 4049 are 40% above the dust continuum.
The simple model of a rotating disk can be applied to the existing disk model (Figure 1) and tested by producing model profiles of the lines. The CO first overtone lines suggest that most of the CO occurs in a relatively thin layer. An absorption line was modeled by assuming a continuum source of 10 AU radius. The layer of absorbing gas was divided into zones of 0.1 AU along the circumference. The line RMS was assumed to be 0.5 km s-1 and the gas was assumed to be rotating in a Keplerian orbit. The resulting profile is a double peaked absorption line. This profile was then convolved with a Gaussian instrumental profile with 6 km s-1 FWHM. The resulting synthetic profile, which is an excellent match to observations, is shown in Figure 13.
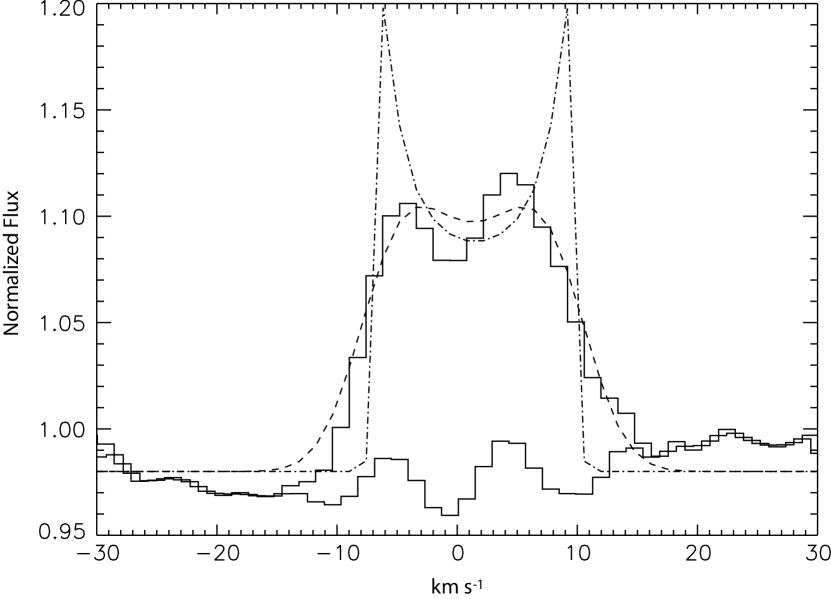
Is this model also consistent with the 4.6 m emission line shapes? To investigate this question five assumptions were made: (1) The emissivity of the gas is constant over the entire region modeled. (2) The gas is in Keplerian orbits. (3) Line broadening is limited to the thermal b value, 0.5 km s-1 discussed above and the broadening from the Keplerian motion. (4) Absorption is insignificant. (5) The gas originates at 10 AU and extends to larger radii. Since the dust disk is opaque this extension is along the top of the disk (Figure 1). An extension to larger radii was included since there is no requirement for a background continuum source for the emission line spectrum. To fit the profiles with this model we found a maximum radius of 14 AU. As for the overtone model, the disk was divided into zones, the profile from each zone shifted and weighted by the viewing aspect, and then summed into velocity bins of 0.1 km s-1. The resultant double-peaked profile of the emission line is seen in Figure 14. Convolution with a Gaussian instrumental profile of FWHM = 6 km s-1 produced a good match to a typical emission line.
While consistency between the modeled and observed profiles is satisfying, the fundamental transitions clearly require much more refined modeling to address a number of details. For instance, there is a large difference between the 550 K CO and 1150 K dust temperatures. If, as is commonly assumed (see e.g. Glassgold et al., 2004), the gas and dust temperatures are in equilibrium within the disk then the 1150 K dust temperature applies only to a surface layer. Radiative cooling from CO fundamental emission (Ayres & Wiedemann, 1989) is largely disabled by the large optical depth of the CO lines (Glassgold et al., 2004). It is plausible that the gas undergoes heating on exiting the disk.
In an isothermal model optically thick CO self-absorption occurs for the fundamental transitions; the opacity in the low J 1-0 is 400. The fundamental lines are seen in emission because the the 550 K temperature of the CO makes optically thick CO lines brighter at 4.6 m than the 1150 K continuum. At the resolution of the observations, 6 km s-1, narrow self-absorption lines of 0.5 km s-1 width are largely smeared out. Additionally, the gas is certainly not isothermal. If, for instance, the gas is heated as it leaves the disk, the temperature profile could increase toward the observer. Depending on the details of the spatial filling, optical depth, and temperature profile absorption is not a requirement.
Two temperatures were measured in the CO first overtone, 40 and 550 K but no velocity differences were measured between the 40 K and 550 K regions, suggesting that these temperature regions are physically close together. Both the 40 K and 550 K CO are seen in absorption against the 1150 K continuum. H2O, on the other hand, is seen only in emission. Emission lines are not spatially limited to the 1150 K continuum forming region. If the absence of H2O absorption results from H2O existing only in the disk edge region and not in the disk mid-plane, the gas is differentiated vertically as well as horizontally relative to the plane of the disk.
The measured decrease in the column density in between the v=0 and v=1 levels implies that there is ample population to produce the observed optically thick 2-1 lines. However, the observation of optically thick 3-2 emission suggests that the v=3 level is populated above that expected from LTE. Overtone transitions higher than 3-1 are outside of the region observered. It would be of interest to search for the strongest lines in the 4-2 band.
The emission profile is shifted relative to the center-of-mass velocity by 1.5 km s-1, suggesting an outflow. If the depression of the blue wing in the emission profiles is due to absorption in front of the dust disk, the absorption line profile is formed in a region with less outflow than the extended emission line forming region. Outflow was also noted for the first overtone CO lines. The outflow increases for the very lowest excitation lines, suggesting that the gas cools in the inner-disk region and is accelerated as it flows out. For the lowest excitation CO fundamental lines the cold outflow is seen in absorption with the outflow velocity increasing (Figure 10) as excitation energy decreases. Dominik et al. (2003) suggested that along the edges of the disk an outward flow results from radiation pressure erosion. Alternatively, a disk pressure gradient can result in an outward flow (Takeuchi & Lin, 2002) without a need for small grains. Indeed, the outflow could be driven initially by either gas or dust since momentum is transferred between the gas and dust through collisions (Netzer & Elitzur, 1993).
5.2 Comparison with Optical Spectra
A detailed analysis of time series C I, Na I D (D1 and D2), and H spectra of HR 4049 is presented by Bakker et al. (1998). The Na D lines contain a number of absorption components as well as weak emission. Bakker et al. (1998) identify two Na D absorption components with the circumstellar environment of the binary system. These are labeled as ‘A1’ and ‘A2’ (see Table 2 and Figure 4 of Bakker et al., 1998). A1 has a velocity of -5.0 km s-1 (mean of D1 and D2) relative to the systemic velocity. A2 has a velocity of -0.8 km s-1 again relative to the systemic velocity. A2 is stronger than A1 by about 50% and has a slightly greater FWHM.
The continuum in the infrared is dominated by the dust continuum. However, in the optical the continuum is entirely from the stellar photosphere. Thus the optical absorption is formed along a pencil beam originating near the center of the circumbinary disk. The A1 velocity has similar velocity to the outflow seen in the lowest excitation 1-0 CO lines. This outflow is a cold wind perhaps leaving the system. The A2 outflow is close to the outflow velocity seen in the CO first overtone as well as the slightly higher excitation 1-0 lines (Figure 10). This flow is an outward flow of warmer gas perhaps associated with circulation in the disk.
Given that the star is the continuum source of the Na absorption and the rear inner walls of the disk are the continuum source for the CO absorption, perfect agreement is not expected in either line of sight velocity or in FWHM. The overtone CO has a much larger FWHM than the Na D, as expected given the larger range of velocities sampled by the CO along the lines of slight to the CO continuum forming area (Fig. 13).
Na I also has an emission component (‘A3’ in Bakker et al., 1998). This is perhaps due to fluorescent emission from the gas interior to the disk. The line profile is disrupted by the Na D absorption components but the FWMH of the emission, 21 km s-1, is comparable to that of the CO emission.
The H line profile is complex. Bakker et al. (1998) identified two components, ‘Cmax’ and ‘Rmin’ which are stationary and presumably are associated with the circumbinary environment. Both are seen in absorption. Cmax has a large outward velocity, -21.3 km s-1. The velocity of Rmin is much less, -7.5 km s-1. The energetics of the H line are very different from those of the cold gas lines discussed in this paper. H also has an absorption feature ‘Bmin’ which possibly varies in anti-phase with the primary. Detailed understanding of the excited gas sampled by H requires modeling beyond the current discussion.
5.3 Properties of the Binary Members
The conceptual picture of a thin gas layer co-rotating just in front of the dust wall suggests the observed velocities result from Keplerian rotation. A FWZI of 18 km s-1 implies a rotational velocity of 9 km s-1. Assuming Keplerian rotation and a 10 AU disk radius, the total binary mass required is 0.9 M⊙. This is in agreement with the total binary mass suggested by Bakker et al. (1998). Bakker’s mass was based on the mass function from the spectroscopic orbit and the assumption that the A supergiant had a typical white dwarf mass.
The mass function from Bakker et al. (1998), the total binary mass, and the orbital inclination allows a solution for the individual masses in the binary. We make the assumption, discussed in §5.6, that the binary orbit is co-planer with the disk. The definition of the mass function then yields the masses for the individual stars. The A supergiant has a very low mass of 0.58 M⊙ confirming the post-AGB state of this star. This mass, nearly equal to that of a typical white dwarf (Bergeron et al., 1992), implies that the mass-loss process for this star has terminated. The companion mass is 0.34 M⊙. This mass does not resolve the status of the companion. While a mass of 0.34 M⊙ is low for a white dwarf and strongly suggests an M-dwarf, it is possible that the companion mass has been altered by evolution (§5.6).
5.4 Winnowing
Lambert et al. (1988) report quantitative abundances for HR 4049 revealing an extremely metal-poor star with [Fe/H] -3 but near-solar C, N, and O: [C/H] = -0.2, [N/H]=0.0, [O/H]=-0.5. Lambert et al. (1988) argue that the ultra-low iron abundances found in a post-AGB star cannot be primordial since there are no known progenitor AGB stars with similar abundances. Venn & Lambert (1990) and Bond (1991) find similar abundance patterns to those in HR 4049 in the young main-sequence Boo stars and gas in the interstellar medium (ISM). In all three cases the abundance pattern is deficient in refractory (high condensation temperature) elements but nearly solar in volatile (low condensation temperature) elements. This abundance pattern is explained in the ISM by the locking up of refractory elements in grains.
Five extremely iron-deficient post-AGB stars are known in the HR 4049 class (van Winckel et al., 1995). Lambert et al. (1988) and Mathis & Lamers (1992) have noted that all are A stars with no surface convection. A likely scenario is that the observed abundances result from peculiar abundances in little more than the observed photospheric layer. The very low refractory abundance in the HR 4049 stars results in a much lower opacity in the photospheric material than from a normal composition making this region additionally stable against convection (Mathis & Lamers, 1992). Assuming a 47 R⊙ radius for HR 4049 (Bakker et al., 1998) and referring to a 7500 K Teff, log g = 1.0 model atmosphere (Kurucz, 1979), the photosphere of HR 4049 above optical depth unity contains a few percent of an Earth mass of volatile material.
Mathis & Lamers (1992) postulated that the HR 4049 abundance pattern results from the separation of mass-loss gas and dust by differential forces on the gas and dust in a circumstellar shell. Waters et al. (1992) further suggested that a circumbinary disk played a critical role. Winnowing occurs as gas is accreted to the stellar surface while dust remains in the circumstellar shell or is ejected. The Boo stars, which are also A stars without surface convection, have similar surface abundances due to winnowing of gas from dust in a pre-main sequence disk (Venn & Lambert, 1990). Mathis & Lamers (1992) found the removal of refractory elements from a solar abundance gas to be a very inefficient winnowing process. They suggested that an efficient winnowing process is one that creates a gas with a low refractory abundance.
Models of disks, created mainly to explore pre-main sequence evolution, provide a rich view of the basic disk physics. While the detailed physics of the winnowing are complex, these models, combined with the current observations, reveal the basics of the winnowing process. In optically thin circumstellar regions, the radiation pressure to gravity ratio for A stars drags grains with larger than 4 microns inward while expelling grains smaller than 4 microns (Takeuchi & Artymowicz, 2001). Takeuchi & Lin (2002) extend this to disk models, showing that large particles accumulate in the inner part of the disk. These models also apply to optically thick disks where the majority of the dust in the disk is not exposed to stellar radiation (Takeuchi & Lin, 2003). In this case, interaction with the stellar radiation field at the inner disk edge drives flows in the disk with the dust-to-gas ratio increasing at the inner disk edge.
Dominik et al. (2003) conclude that the grain size distribution in the HR 4049 disk is currently indeterminate. However, they note that in the case where the inner disk consists of small grains, these grains will be driven outward by radiation pressure exposing a dust free region of gas. This gas layer will be driven inwards by either the gas pressure gradient or sub-Keplerian rotation. In pre-main sequence disks it has been shown that the gas interior to the dust suffers turbulent viscosity and accretes onto the central star. The viscous time scale in pre-main sequence circumstellar disks is typically estimated at 106 years (Takeuchi & Lin, 2003; Hartmann et al., 1998).
The observations reported here of a sheet of gas at the inner disk edge support the model where separation of volatiles from grains occurs near the inner dust disk surface. The temperature of the gas released from the grains is far to low for evaporation of refractory elements to take place. The total gas mass interior to the HR 4049 dust disk is 0.1 M⊕. The gas required in the stellar photosphere to alter the observed stellar abundances is one tenth this. A naive interpretation is that the surface material required to match the observed abundances could be accreted in 105 years. For post-AGB evolution this may be too long. An alternative is that the winnowing process currently observed is the termination of a very rapid clearing of the inner disk region that result in sudden accretion of the gas now present in the stellar photosphere. The observed CO, H2O, OH is near the disk. The flow to the stellar surface is presumed much more tenuous and is not observed.
Takeuchi & Lin (2002) found that higher than a few disk scale heights from the disk midplane the gas rotates faster than the particles due to an inward pressure gradient. This drag causes particles to move outward in the radial direction. Takeuchi & Lin (2003) speculate that in an optically thick disk, particles in the irradiated surface layer move outward, while beneath the surface layer, particles move inward. The outward flow seen in CO plus the driving entrained particles could rejoin the cool outer portions of the disk. In this case, the inward interior disk flow would move this material to the inner disk surface. The winnowing process could then be a distillation process resulting in a disk with increasingly refractory grains.
5.5 Isotopic Abundances
The oxygen isotopic ratios reported by Cami & Yamamura (2001) set HR 4049 apart as having by a factor 10 the smallest ratios of 16O/17O and 16O/18O known at that time. Our analysis of the optically thin CO first overtone transition does not support these results. There are no detectable C17O first overtone lines giving a 3 limit of 16O/17O 200. On the other hand, the fundamental spectrum of CO in HR 4049 consists of optically thick emission lines. Four isotopic variants (12C16O, 13C16O, 12C17O, and 12C18O) can be seen in the fundamental spectrum with lines of similar intensity. The CO2 bands measured by Cami & Yamamura (2001) were observed at low resolution by ISO and are in the 13 - 17 m region of the infrared. These bands appear in emission. We contend that the oxygen isotope ratios appear small in these CO2 bands because, as for the CO fundamental, the emission lines are highly saturated. Cami & Yamamura (2001) warn that their isotopic ratios are in the optically thin limit.
The carbon and oxygen isotopic ratios appear typical for an AGB star (Lambert, 1988). While the oxygen isotopic ratio in the circumstellar environment of HR 4049 is not abnormally low, there are stars that do have extreme oxygen isotope values. Some hydrogen deficient carbon stars have 16O/18O considerably less than 1 (Clayton et al., 2005, 2007). Clayton et al. (2007) suggest that the extreme overabundance of 18O observed in these objects is the result of He-burning in white dwarf mergers. Meteoritic samples have been found with small 16O/18O ratios. These could result from processes in the pre-solar nebula or pollution from a stellar source. While the rarity of stellar sources with small oxygen isotope ratios suggests a stellar source is unlikely, the origin of exotic oxygen isotopic ratios detected in early solar system samples remains uncertain (Aleon et al., 2005).
5.6 Binary Evolution
ISO data described by Dominik et al. (2003) contain features from oxygen-rich molecules implying that the disk is oxygen-rich. The lack of mid-infrared silicate features associated with oxygen-rich grains is attributed by Dominik et al. (2003) to high optical depth in the dust disk. Our observations reveal a 2.3 – 4.6 m spectrum resulting from a mix of gas phase molecules, CO, OH, and H2O, typical for an oxygen-rich environment. If, as seems probable, the gas consists of volatiles evaporated from grains then the disk environment is oxygen rich.
In contrast, as reviewed in §1, carbon-rich circumstellar grains have been observed. An explanation is that these grains are exterior to the disk. Carbon-rich chemistry is the result of evolution in the AGB phase where CNO material processed in the stellar interior is mixed to the surface. For AGB stars of mass 2, the surface chemistry of the AGB star is converted to carbon-rich by the third dredge up. Rapid AGB mass loss then produces a carbon-rich circumstellar shell. In the case of HR 4049 the fossil carbon-rich shell of AGB mass loss is still observable although HR 4049 is now a post-AGB object.
Why is the disk oxygen-rich? Bakker et al. (1996) noted that the current binary separation is less than the radius required for the AGB phase of the current post-AGB star. Hence, prior to the post-AGB stage the HR 4049 system underwent common envelope evolution. Prior to the common envelope phase the system passed through a pre-AGB contact binary phase with the more massive star transferring mass onto the less massive member. An AGB star does not contract due to mass loss, so the AGB star continued to expand enveloping the dwarf companion. Common envelope systems rapidly eject mass from both members (Taam & Sandquist, 2000). Most carbon stars have C/O near unity (Lambert et al., 1986). Mixing or mass transfer during the common-envelope stage converted the carbon-rich envelope of the AGB star back to an oxygen-rich envelope. Mass lost during the common-envelope phase formed the current circumbinary disk. In such a scenario a co-rotating circumbinary disk is formed surrounding the binary (Rasio & Livio, 1996).
This process is apparently not unusual. De Ruyter et al. (2006) find that circumbinary disks are a common feature of post-AGB stars. The current A-supergiant M-dwarf HR 4049 binary is rapidly evolving to a white-dwarf M-dwarf binary system. White-dwarf M-dwarf binary systems with a co-binary disk resulting from common-envelope evolution also appear to be common (Howell et al., 2006).
6 Conclusions
The 2 to 5 m spectrum of HR 4049 is formed in a circumbinary disk and wind. The optically thin 2.3 m CO lines appear in absorption against the dust continuum, allowing the determination of the mass of gas. The gas forms a thin layer, of radial thickness 6 R⊙, lining the dust disk. This gas is composed of the volatiles separated in the disk from grains. The 4.6 m emission spectrum requires a region of line formation extended beyond the continuum forming region. The circumbinary gas is rotating with a Keplerian velocity of 9 km s-1. Combined with the circumbinary disk radius and inclination derived from photometry, Keplerian rotation allows the determination of the masses of the individual binary stars. The very low mass of the A supergiant, 0.58 M⊙, confirms the post-AGB nature of this object. Gas is also flowing out of the system, perhaps as a result of a disk pressure gradient, at 1 km s-1.
Our observations show that the HR 4049 circumbinary disk has typical AGB abundances for the carbon and oxygen isotopes; 12C/13C = 6 and 16O/17O 200. Exotic mechanisms, as proposed e.g. by Lugaro et al. (2005), for production of the 16O/17O are not required. The widely quoted value of 16O/17O 8 reported by Cami & Yamamura (2001) results from the naive interpretation that the infrared emission lines are optically thin. Cami & Yamamura (2001) warn that their values were in the optically thin limit. The extreme saturation of lines in the 4.6 m spectrum of HR 4049 results in nearly equal apparent strengths for isotopic variants of molecular species with abundances differing by factors of 103.
The peculiar surface abundances of HR 4049 are likely the result of winnowing driven by the evaporation of volatiles in the disk and the viscous accretion of this gas onto the star. Detailed modeling of the process will be required to determine if there is adequate time for the current outgassing of the disk to fully explain the surfaces abundances of the A supergiant or if a sudden, post-common envelope clearing of the inner disk is required. The existence of the Boo stars shows that the winnowing process applies to pre-main sequence as well as post-AGB systems. The wider significance of the winnowing process may well be in systems where the convective nature of the stellar photosphere cancels any impact on stellar abundances. However, circumstellar grains in these systems are undergoing processes separating volatile and refractory elements. This winnowing could have general application to the chemical evolution of grains in pre-main sequence disks.
Carbon-rich circumstellar material implies that the post-AGB star was a carbon-rich star on the AGB. The current oxygen-rich circumstellar disk likely evolved from common envelope mixing. HR 4049 is one of five known post-AGB stars with similar photospheric abundances. Of the other four at least one, the red-rectangle nebula/binary HD 44179, has a similar oxygen-rich circumbinary disk in a carbon-rich circumstellar shell (Waters et al., 1998). In future papers of this series we will explore the infrared spectra of the other members of the HR 4049 class of objects.
References
- Aleon et al. (2005) Aleon, J., Robert, F., Duprat, J., & Derenne, S. 2005, Nature, 437, 385
- Antoniucci et al. (2005) Antoniucci, S., Paresce, F., & Wittkowski, M. 2005, A&A, 429, L1
- Ayres & Wiedemann (1989) Ayres, T. R. & Wiedemann, G. R. 1989, ApJ, 338, 1033
- Bakker et al. (1996) Bakker, E. J., van der Wolf, F. L. A., Lamers, H. J. G. L. M., Gulliver, A. F., Ferlet, R., & Vidal-Madjar, A. 1996, A&A, 306, 924
- Bakker et al. (1998) Bakker, E. J., Lambert, D. L., Van Winckel, H., McCarthy, J. K., Waelkens, C., & Gonzalez, G. 1998, A&A, 336, 263
- Beintema et al. (1996) Beintema, D. A., van den Ancker, M. E., Molster, F. J., Waters, L. B. F. M., Tielens, A. G. G. M., Waelkens, C., de Jong, T., de Graauw, T., Justtanont, K., Yamamura, I., Heras, A., Lahuis, F., & Salama, A. 1996, A&A, 315, L369
- Bergeron et al. (1992) Bergeron, P., Saffer, R. A., & Liebert, J. 1992, ApJ, 394, 228
- Bond (1991) Bond, H. E. in Proc. IAU Symposium 145, “Stellar Evolution: The Photospheric Abundance Connection,” eds. G. Michaud & A. Tutekov, Reidel:Dordrecht, p. 341
- Brittain et al. (2005) Brittain, S. D., Rettig, T. W., Simon, T., & Kulesa, C. 2005, ApJ, 626, 283
- Cami & Yamamura (2001) Cami, J. & Yamamura, I. 2001, A&A, 367, L1
- Clayton et al. (2005) Clayton, G. C., Herwig, F., Geballe, T. R., Asplund, M., Tenebaum, E. D., Engelbracht, C. W., & Gordon, K. D. 2005, ApJ, 623, L141
- Clayton et al. (2007) Clayton, G. C., Geballe, T. R., Herwig, F., Fray, C., Asplund, M. 2007, preprint.
- Dominik et al. (2003) Dominik, C., Dullemond, C. P., Cami, J., & van Winckel, H. 2003, A&A, 397, 595
- De Ruyter et al. (2006) De Ruyter, S., Van Winckel, H., Maas, T., Lloyd Evans, T., Waters, L.B.F.M., & Dejonghe, H. 2006, A&A, 448, 641
- Geballe et al. (1989) Geballe, T. R., Noll, K. S., Whittet, D. C. B., & Waters, L. B. F. M. 1989, ApJ, 340, L29
- Glassgold et al. (2004) Glassgold, A. E., Najita, J., & Igea, J. 2004, ApJ, 615, 972
- Grevesse et al. (1991) Grevesse, N, Lambert, D. L., Sauval, A. J., van Dishoek, E. F., Farmer, C. B., & Norton, R. H. 1991, A&A, 242, 488
- Guillois et al. (1999) Guillois, O., Ledoux, G., & Reynaud, C. 1999, ApJ, 521, L133
- Hartmann et al. (1998) Hartmann, L., Calvet, N., Gullbring, E., & D’Alessio, P. 1998, ApJ, 495, 385
- Hinkle & Barnes (1979) Hinkle, K. H. & Barnes, T. 1979, ApJ, 227, 923
- Hinkle et al. (1998) Hinkle, K. H., Cuberly, R., Gaughan, N., Heynssens, J., Joyce, R., Ridgway, S., Schmitt, P., & Simmons, J. E. 1998, Proc. SPIE, 3354, 810
- Hinkle et al. (2000) Hinkle, K. H., Joyce, R. R., Sharp, N., & Valenti, J. A. 2000, Proc. SPIE, 4008, 720
- Hinkle et al. (2003) Hinkle, K. H., Blum, R., Joyce, R. R., Ridgway, S. T., Rodgers, B., Sharp, N., Smith, V., Valenti, J., van der Bliek, N.,& Winge, C. 2003, Proc. SPIE, 4834, 353
- Howell et al. (2006) Howell, S. B., Brinkworth, C., Hoard, D. W., Wachter, S., Harrison, T., Chun, H., Thomas, B., Stefaniak, L., Ciardi, D. R., Szkody, P., van Belle, G. 2006, ApJ, 646, L65
- Joyce (1992) Joyce, R. R. 1992, in ASP Conf. Ser. 23, Astronomical CCD Observing and Reduction Techniques, ed. S. Howell (San Francisco: ASP), p. 258
- Kurucz (1979) Kurucz, R. L. 1979, ApJS, 40, 1
- Lambert et al. (1986) Lambert, D. L., Gustafsson, B., Eriksson, K., & Hinkle, K. H. 1986, ApJS, 62, 373
- Lambert (1988) Lambert, D. L. 1988 in Evolution of Peculiar Red Giant Stars, IAU Colloq. 106, eds. H. R. Johnson & B. M. Zuckerman (Cambridge: Cambridge Univ. Press), p. 101
- Lambert et al. (1988) Lambert, D. L., Hinkle, K. H., & Luck, R. E. 1988, ApJ, 333, 917
- Lugaro et al. (2005) Lugaro, M., Pols, O., Karakas, A. I., & Tout, C. A. 2005, Nuclear Physics A, 758, 725
- Mathis & Lamers (1992) Mathis, J. S. & Lamers, H. J. G. L. M. 1992, A&A, 259, L39
- McClatchey et al. (1973) McClatchey, R. A., Benedict, W. S., Clough, S. A., Burch, D. E., Calfee, R. F., Fox, K., Rothman, L. S., & Garing, J. S. 1973, “AFCRL Atmospheric Absorption Line Parameters Compilation”, Environmental Research Papers, 434 (Bedford, Mass.: Air Force Cambridge Research Laboratories)
- Najita et al. (1996) Najita, J., Carr, J. S., Glassgold, A. E., Shu, F. H., Tokunaga, A. T. 1996, ApJ, 462, 919
- Netzer & Elitzur (1993) Netzer, N. & Elitzur, M. 1993, ApJ, 410, 701
- Rasio & Livio (1996) Rasio, F. A. & Livio, M. 1996, ApJ, 471, 366
- Smith et al. (2002) Smith, V. V., Hinkle, K. H., Cunha, K., Plez, B., Lambert, D. L., Pilachowski, C. A., Barbuy, B., Melendez, J., Balachandran, S., Bessell, M. S., Geisler, D. P., Hesser, J. E., & Winge, C. 2002, AJ, 124, 3241
- Spitzer (1978) Spitzer, L. 1978, Physical Processes in the Interstellar Medium (New York, Wiley)
- Taam & Sandquist (2000) Taam, R. E. & Sandquist, E. L. 2000, ARA&A, 38, 113
- Takada-Hidai (1990) Takada-Hidai, M. 1990, PASP, 102, 139
- Takeuchi & Artymowicz (2001) Takeuchi, T. & Artymowicz, P. 2001, ApJ, 557, 990
- Takeuchi & Lin (2002) Takeuchi, T. & Lin, D. N. C. 2002, ApJ, 581, 1344
- Takeuchi & Lin (2003) Takeuchi, T. & Lin, D. N. C. 2003, ApJ, 593, 524
- van Winckel et al. (1995) van Winckel, H., Waelkens, C., & Waters, L. B. F. M. 1995, A&A, 293, L25
- Venn & Lambert (1990) Venn, K. A. & Lambert, D. L. 1990, ApJ, 363, 234
- Waters et al. (1989) Waters, L. B. F. M., Lamers, H. J. G. L. M., Snow, T. P., Mathlener, E., Trams, N. R., van Hoof, P. A. M., Waelkens, C., Seab, C. G., & Stanga, R. 1989, A&A, 211, 208
- Waters et al. (1992) Waters, L. B. F. M., Trams, N. R., & Waelkens, C. 1992, A&A, 262, L37
- Waters et al. (1998) Waters, L. B. F. M., et al. 1998, Nature, 391, 868
- Waelkens et al. (1991a) Waelkens, C., Lamers, H. J. G. L. M., Walters, L. B. F. M., Rufener, F., Trams, N. R., LeBertre, T., Ferlet, R., & Vidal-Madjar, A. 1991a, A&A, 242, 433
- Waelkens et al. (1991b) Waelkens, C., Van Winckel, H., Bogaert, E., & Trams, N. R. 1991b, A&A, 251, 495
- Waelkens et al. (1996) Waelkens, C., Van Winckel, H., Waters, L.B.F.M., & Bakker, E.J. 1996, A&A, 314, L17
| Date | Wavelength | Frequency | S/N |
|---|---|---|---|
| (m) | (cm-1) | ||
| 2002 Feb 13 | 2.3120 | 4324 | 290 |
| 2002 Feb 13 | 2.3233 | 4303 | 220 |
| 2002 Feb 13 | 2.3309 | 4289 | 280 |
| 2002 Feb 13 | 2.3421 | 4268 | 260 |
| 2002 Feb 13 | 2.3617 | 4233 | 400 |
| 2002 Dec 11 | 2.3405 | 4272 | 80 |
| 2002 Dec 12 | 2.3126 | 4323 | 90 |
| 2002 Dec 12 | 4.6434 | 2153 | 200 |
| 2002 Dec 12 | 4.6629 | 2144 | 190 |
| 2002 Dec 14 | 2.2980 | 4350 | 350 |
| 2002 Dec 14 | 2.9977 | 3335 | 130 |
| 2002 Dec 14 | 4.6219 | 2163 | 150 |
| 2002 Dec 14 | 4.6825 | 2135 | 170 |
| 2003 Feb 16 | 2.3416 | 4269 | 210 |
| 2004 Apr 3 | 4.8874 | 2045 | 220 |
| 2005 Dec 10 | 2.3634 | 4230 | 300 |
| 2005 Dec 10 | 2.3523 | 4250 | 350 |
| Species | Line | ic1 | Line | ic | Line | ic | Line | ic |
|---|---|---|---|---|---|---|---|---|
| 12C16O | 1-0 P3 | 1.36: | 1-0 P2 | 1.25 | 1-0 P1 | 1.27 | 1-0 R0 | 1.28 |
| 1-0 R1 | 1.26 | 1-0 R2 | 1.25 | 1-0 R3 | 1.17 | 1-0 R4 | 1.36 | |
| 1-0 R5 | 1.38 | |||||||
| 2-1 P18 | 1.36 | 2-1 R3 | 2-1 R4 | 1.27 | 2-1 R6 | |||
| 2-1 R7 | 1.37 | 2-1 R8 | 1.31 | 2-1 R8 | 1.31 | 2-1 R9 | 1.26 | |
| 2-1 R10 | 2-1 R11 | 1.27 | 2-1 R12 | 1.27 | 2-1 R13 | 1.22 | ||
| 3-2 P11 | 1.13 | 3-2 R10 | 3-2 R11 | 1.08 | 3-2 R12 | |||
| 3-2 R13 | 3-2 R14 | 1.08 | 3-2 R15 | 3-2 R16 | ||||
| 3-2 R18 | 3-2 R21 | 1.09 | ||||||
| 5-4 P5 | 1.03 | |||||||
| 13C16O | 1-0 R9 | 1-0 R10 | 1.23 | 1-0 R11 | 1.20 | 1-0 R12 | 1.23 | |
| 1-0 R13 | 1.22 | 1-0 R14 | 1-0 R15 | 1.27 | 1-0 R16 | 1.20 | ||
| 1-0 R17 | 1.20 | 1-0 R18 | 1.21 | 1-0 R19 | 1.17 | 1-0 R20 | ||
| 2-1 P7 | 1.28 | 2-1 P6 | 1.25 | 2-1 R17 | 1.12 | 2-1 R18 | ||
| 2-1 R19 | 1.16 | 2-1 R20 | 2-1 R21 | 2-1 R22 | 1.13 | |||
| 2-1 R23 | 2-1 R24 | 2-1 R25 | 1.13 | 2-1 R26 | ||||
| 2-1 R27 | 1.09 | 2-1 R28 | 2-1 R29 | 2-1 R30 | 1.08 | |||
| 12C17O | 1-0 P17 | 1.14 | 1-0 R3 | 1-0 R4 | 1.11 | 1-0 R5 | 1.15 | |
| 1-0 R6 | 1-0 R8 | 1-0 R9 | 1.12 | 1-0 R10 | ||||
| 1-0 R11 | 1.08 | 1-0 R12 | 1-0 R13 | |||||
| 2-1 R17 | 2-1 R19 | |||||||
| 12C18O | 1-0 P13 | 1.26 | 1-0 P12 | 1.24 | 1-0 R10 | 1.12 | 1-0 R11 | 1.14 |
| 1-0 R12 | 1-0 R13 | 1-0 R14 | 1.12 | 1-0 R15 | 1.12 | |||
| 1-0 R16 | 1.18 | 1-0 R17 | 1.13 | 1-0 R18 | 1.11 | 1-0 R19 | ||
| 1-0 R21 | 1.13 | 1-0 R22 | 1.12 | |||||
| 2-1 R22 | 1.03 |
Note. — Central intensities at the maximum emission strength. Continuum = 1.0.
| Vibrational | Rotational | ic | Rotational | ic | Rotational | ic |
|---|---|---|---|---|---|---|
| Transition | Transition | Transition | Transition | |||
| (100)-(010) | [2,2,0]-[1,1,1] | 1.07 | [2,2,1]-[1,1,0] | 1.19: | [3,1,3]-[2,0,2] | |
| [3,2,1]-[4,1,4] | 1.13 | [3,2,2]-[2,1,1] | [4,0,4]-[3,1,3] | |||
| [4,1,4]-[3,0,3] | 1.16 | [4,2,3]-[4,1,4] | 1.11 | [5,0,5]-[4,1,4] | 1.13 | |
| [5,1,5]-[4,0,4] | 1.10 | [5,2,4]-[5,1,5] | [5,4,2]-[5,3,3] | 1.03 | ||
| [5,5,0]-[5,4,1] | 1.06 | [5,5,1]-[5,4,2] | [6,1,5]-[5,2,4] | 1.08 | ||
| [6,1,5]-[6,0,6] | [6,2,5]-[6,1,6] | 1.07: | [6,3,4]-[6,2,5] | |||
| [7,2,5]-[6,3,4] | 1.05 | [7,3,5]-[7,2,6] | 1.07: | [8,2,6]-[8,1,7] | 1.05 | |
| [8,3,6]-[8,2,7] | [9,2,7]-[9,1,8] | 1.08 | [9,3,6]-[8,4,5] | |||
| [9,3,7]-[9,2,8] | [10,4,7]-[10,3,8] | 1.03 | ||||
| (010)-(000) | [6,5,1]-[5,2,4] | [8,8,1&0]-[7,7,0&1] | [9,5,5]-[8,2,6] | |||
| [9,8,1&2]-[8,7,2&1] | 1.04 | [10,3,7]-[10,0,10] | 1.02 | [10,3,8]-[9,0,9] | 1.04 | |
| [10,4,7]-[9,1,8] | 1.06 | [11,3,8]-[10,2,9] | 1.08 | [11,7,4]-[10,6,5] | 1.04 | |
| [11,7,5]-[10,6,4] | 1.03 | [12,4,8]-[11,3,9] | [12,6,6]-[11,5,7] | 1.06 | ||
| [13,5,8]-[12,4,9] | 1.05 | [13,5,9]-[12,4,8] | 1.07 | [13,6,7]-[12,5,8] | ||
| [14,6,9]-[13,5,8] | 1.06 | [15,6,10]-[14,5,9] | [16,6,11]-[15,5,10] | |||
| (001)-(010) | [0,0,0]-[1,0,1] | [1,1,0]-[1,1,1] | [1,1,1]-[1,1,0] | 1.15 | ||
| [2,1,2]-[2,1,1] | [2,2,0]-[2,2,1] | 1.18 | [2,2,0]-[3,0,3] | |||
| [2,2,1]-[2,2,0] | [3,0,3]-[2,2,0] | 1.20 | [3,2,1]-[3,2,2] | |||
| [3,2,2]-[3,2,1] | 1.23: | [3,2,2]-[4,2,3] | 1.21 | [4,0,4]-[3,2,1] | ||
| [4,2,2]-[4,2,3] | 1.06 | [5,0,5]-[4,2,2] | 1.02 | [5,1,4]-[4,3,1] | ||
| [6,1,5]-[5,3,2] | 1.01: | [6,3,3]-[6,3,4] | 1.02 | [7,1,6]-[6,3,3] | ||
| [7,3,4]-[7,3,5] | 1.09 | [8,1,7]-[7,3,4] | [8,2,6]-[7,4,3] | |||
| [8,3,5]-[8,3,6] | 1.03 | |||||
| (020)-(010) | [5,5,0]-[4,2,3] | [6,5,2]-[5,2,3] | 1.01 | [8,8,0&1]-[7,7,1&0] | 1.05 | |
| [10,2,8]-[9,1,9] | [10,3,8]-[9,0,9] | [10,4,7]-[9,1,8] | 1.02 | |||
| [10,7,4]-[9,6,3] | 1.03 | [10,7,3]-[9,6,4] | [11,3,8]-[10,2,9] |