SN 2003du: 480 days in the Life of a Normal Type Ia Supernova
Abstract
Aims. We present a study of the optical and near-infrared (NIR) properties of the Type Ia Supernova (SN Ia) 2003du.
Methods. An extensive set of optical and NIR photometry and low-resolution long-slit spectra was obtained using a number of facilities. The observations started 13 days before -band maximum light and continued for 480 days with exceptionally good time sampling. The optical photometry was calibrated through the S-correction technique.
Results. The light curves and the color indices of SN 2003du closely resemble those of normal SNe Ia. SN 2003du reached a -band maximum of 13.49 0.02 mag on JD2452766.38 0.5. We derive a -band stretch parameter of 0.003, which corresponds to , indicative of a SN Ia of standard luminosity. The reddening in the host galaxy was estimated by three methods, and was consistently found to be negligible. Using an updated calibration of the and absolute magnitudes of SNe Ia, we find a distance modulus mag to the host galaxy, UGC~9391. We measure a peak bolometric luminosity of erg s-1 and Arnett’s rule implies that of was synthesized during the explosion. Modeling of the bolometric light curve also indicates in the range . The spectral evolution of SN 2003du at both optical and NIR wavelengths also closely resembles normal SNe Ia. In particular, the Si ii ratio at maximum () and the time evolution of the blueshift velocities of the absorption line minima are typical. The pre-maximum spectra of SN 2003du showed conspicuous high-velocity features in the Ca ii H&K doublet and infrared triplet, and possibly in Si ii 6355, lines. We compare the time evolution of the profiles of these lines with other well-observed SNe Ia and we suggest that the peculiar pre-maximum evolution of Si ii 6355 line in many SNe Ia is due to the presence of two blended absorption components.
Key Words.:
stars: supernovae: general – stars: supernovae: individual: SN 2003du – methods: observational – techniques: photometric – techniques: spectroscopic1 Introduction
Type Ia supernovae (SNe Ia) form a relatively homogeneous class of objects with only a small scatter in their observed absolute peak magnitudes ( mag). Moreover, their spectra and light curves are strikingly similar (e.g. Branch & Tammann, 1992). Theoretical investigations strongly suggest that SNe Ia are thermonuclear explosions of carbon/oxygen white dwarfs (WD) with masses close to the Chandrasekhar limit 1.4 (for a review see Hillebrandt & Niemeyer, 2000). In the favored model, the WD mass grows via accretion from a companion star until the mass reaches the Chandrasekhar limit and the WD ignites at (or near) its center. The light curves of SNe Ia are powered by the energy released from the decay of radioactive produced during the explosion (typically a few tenths of ) and its daughter nuclides, and the scatter of the absolute magnitudes is mostly due to the different amounts of synthesized . However, it has been shown that the peak luminosity of SNe Ia correlates with the luminosity decline rate after maximum light; the slower the decline, the greater the peak luminosity (Pskovskii, 1977; Phillips, 1993; Hamuy et al., 1995, 1996; Riess et al., 1995). After correcting for the empirical ”light curve width – peak luminosity” relation and for the extinction in the host galaxy, the dispersion of the SN Ia absolute peak magnitudes is mag (Phillips et al., 1999). This property combined with their high intrinsic luminosity ( mag), make SNe Ia ideal for measuring relative cosmological distances.
Observations of SNe Ia out to a redshift of led to the surprising discovery that the expansion of the Universe is accelerating, and that % of the Universe consists of an unknown constituent with effective negative pressure, dubbed ”dark energy” (Riess et al., 1998; Perlmutter et al., 1999; Knop et al., 2003; Riess et al., 2004; Astier et al., 2006; Riess et al., 2007; Wood-Vasey et al., 2007). Currently, the favored model for dark energy is a non-zero positive cosmological constant (or vacuum energy), but more exotic models have also been proposed (for a review see Peebles & Ratra, 2003). There are several observational programs planned or in progress that aim to discover and observe hundreds of SNe Ia up to , with the goal of measuring cosmological parameters with greatly improved accuracy. This will enable distinctions to be made between the large number of proposed models for dark energy. Although these programs will be able to greatly reduce the statistical uncertainties on the measured cosmological parameters, the output will still be limited by systematic errors due to our poor knowledge of some aspects of SNe Ia and their environment. Two of the major concerns are the possible evolution of the brightness or colors of SNe Ia with redshift and the estimation of the reddening in the host galaxy. There are indications that the amount of synthesized during the explosion is sensitive to the metallicity, carbon-to-oxygen (C/O) ratio and the central density of the exploding WD (Hoeflich et al., 1998; Umeda et al., 1999; Timmes et al., 2003; Röpke & Hillebrandt, 2004; Röpke et al., 2006), although based on three-dimensional simulations Röpke & Hillebrandt (2004) and Röpke et al. (2006) found that the C/O ratio has little effect on the production. These quantities may, however, evolve with redshift and might therefore introduce some evolution of the observed SNe Ia properties. However, our poor knowledge of the details of the physics of the explosion, the progenitor systems and how the WD mass grows to the Chandrasekhar limit (e.g., Hillebrandt & Niemeyer, 2000)) prevents us from accurately estimating the magnitude of the effect, and the extent to which it could affect the derived cosmological parameters. The difficulties in accurately estimating the reddening in the SN host galaxies arise mostly from the uncertainty in the intrinsic colors of SNe Ia (e.g., Nobili et al., 2003) and the calibration of the photometry (Suntzeff, 2000), combined with poor knowledge of the dust properties.
In this paper we present observations of the nearby Type Ia SN 2003du. It was discovered by The Lick Observatory and Tenagra Observatory Supernova Searches (Schwartz & Holvorcem, 2003) in the nearby (recession velocity of 1914 km s-1) SBd galaxy UGC~9391 on 2003 April 22.4 UT. Kotak et al. (2003) classified SN 2003du as a normal SN Ia at about two weeks before maximum light and an intensive optical and NIR observational campaign was initiated by the European Supernova Collaboration (ESC). The optical and NIR observations were carried out until 466 and 30 days after -band maximum light, respectively; throughout this paper we define the phase of the supernova as the time in days from the -band maximum. The goal of the ESC is to make progress in our understanding of the physics of the thermonuclear SN explosions by collecting and analyzing early-time observations of nearby SNe Ia. Since 2002 the ESC has obtained via coordinated observations using a large number of telescopes optical and IR observations for 15 nearby SNe Ia. First results of the observations have already been published (SN 2002bo – Benetti et al. 2004, Stehle et al. 2005; SN 2002dj – Pignata et al. 2005; SN 2002er – Pignata et al. 2004, Kotak et al. 2005; SN 2003cg – Elias-Rosa et al. 2006; SN 2004eo – Pastorello et al. 2007a; SN 2005cf – Pastorello et al. 2007b, Garavini et al. 2007; Benetti et al. 2005; Mazzali et al. 2005a). Optical observations of SN 2003du have also been presented by Gerardy et al. (2004), Anupama et al. (2005) and Leonard et al. (2005).
| Date (UT) | JD | Phase | Wavelength | Telescopea |
|---|---|---|---|---|
| [day] | range [Å] | |||
| 2003 Apr 23 | 2452753.58 | 12.8 | 4900-7500 | INT |
| 2003 Apr 25 | 2452755.43 | 10.9 | 3450-10400 | AS1.8 |
| 2003 Apr 25 | 2452755.58 | 10.8 | 4250-7500 | NOT |
| 2003 Apr 28 | 2452758.54 | 7.8 | 3200-7500 | INT |
| 2003 Apr 30 | 2452760.56 | 5.8 | 3230-8060 | TNG |
| 2003 May 02 | 2452762.39 | 4.0 | 3230-8060 | TNG |
| 2003 May 04 | 2452764.48 | 1.9 | 3436-7776 | AS1.8 |
| 2003 May 05 | 2452765.39 | 1.0 | 3500-7776 | AS1.8 |
| 2003 May 06 | 2452766.39 | +0.0 | 3447-7776 | AS1.8 |
| 2003 May 07 | 2452767.55 | +1.2 | 3500-9590 | AS1.8 |
| 2003 May 08 | 2452768.54 | +2.2 | 5860-7060 | AS1.2 |
| 2003 May 09 | 2452769.54 | +3.2 | 3500-10010 | AS1.8 |
| 2003 May 10 | 2452770.64 | +4.3 | 3300-10000 | CA2.2 |
| 2003 May 12 | 2452772.57 | +6.2 | 4680-7017 | AS1.2 |
| 2003 May 13 | 2452773.61 | +7.2 | 3300-7200 | NOT |
| 2003 May 14 | 2452774.59 | +8.2 | 3300-7200 | NOT |
| 2003 May 15 | 2452775.48 | +9.1 | 3250-7200 | NOT |
| 2003 May 16 | 2452776.47 | +10.0 | 3260-9800 | NOT |
| 2003 May 21 | 2452781.51 | +15.1 | 3800-6130 | AS1.2 |
| 2003 May 23 | 2452783.55 | +17.2 | 3600-10100 | AS1.8 |
| 2003 May 24 | 2452784.60 | +18.2 | 4260-6595 | AS1.2 |
| 2003 May 25 | 2452785.39 | +19.0 | 3700-7776 | AS1.8 |
| 2003 May 27 | 2452787.52 | +21.1 | 3400-8830 | CA2.2 |
| 2003 Jun 01 | 2452792.52 | +26.1 | 3240-8060 | TNG |
| 2003 Jun 06 | 2452797.60 | +31.2 | 3240-8060 | TNG |
| 2003 Jun 09 | 2452800.45 | +34.1 | 3500-9500 | WHT |
| 2003 Jun 14 | 2452805.38 | +39.0 | 3700-10000 | WHT |
| 2003 Jun 20 | 2452811.54 | +45.2 | 3880-7770 | AS1.8 |
| 2003 Jun 26 | 2452817.52 | +51.1 | 3350-10000 | WHT |
| 2003 Jul 08 | 2452829.44 | +63.1 | 3700-9850 | NOT |
| 2003 Jul 17 | 2452838.41 | +72.0 | 3500-10000 | WHT |
| 2003 Jul 29 | 2452850.42 | +84.0 | 3600-10000 | WHT |
| 2003 Aug 23 | 2452875.32 | +108.9 | 3000-7820 | AS1.8 |
| 2003 Sep 25 | 2452907.82 | +141.4 | 3500-8800 | CA2.2 |
| 2003 Nov 18 | 2452962.25 | +195.9 | 4370-7050 | WHTb |
| 2003 Dec 01 | 2452975.70 | +209.3 | 3000-7600 | CA3.5 |
| 2003 Dec 13 | 2452987.72 | +221.3 | 3500-8820 | CA2.2 |
| 2004 Feb 02 | 2453038.71 | +272.3 | 3800-8000 | CA3.5 |
| 2004 May 17 | 2453143.30 | +376.9 | 3500-8060 | TNG |
a AS1.8 = Asiago 1.82m + AFOSC; AS1.2 = Asiago 1.22m + B&C;
TNG = TNG 3.58m + DOLORES; NOT = NOT 2.6m + ALFOSC;
CA2.2 = Calar Alto 2.2m + CAFOS; CA3.5 = Calar Alto 3.5m + MOSCA;
WHT = WHT 4.2m + ISIS; INT = INT 2.5m + IDS
b average of spectra obtained on 17 and 18 Nov. 2003; these
spectra cover the ranges 4370–5220 Å and 6200–7050 Å with dispersion 0.23 Å pixel-1.
2 Observations and data reduction
2.1 Optical spectroscopy
The optical spectroscopy log of SN 2003du is given in Table 1. The spectra were reduced111All data reduction and calibration was done in IRAF and with our own programs written in IDL. IRAF is distributed by the National Optical Astronomy Observatories, which are operated by the Association of Universities for Research in Astronomy, Inc., under cooperative agreement with the National Science Foundation. following the algorithm of (Horne, 1986). The images were first bias and flat-field corrected. The 1D spectra were then optimally extracted from the 2D images, simultaneously identifying and removing the cosmic rays and bad pixels. The spectra were wavelength calibrated using arc-lamp spectra. The wavelength calibration was checked against the night-sky emission lines and, when necessary, small additive corrections were applied. Spectrophotometric standard stars were used to flux calibrate the SN spectra. Telluric absorption features were removed from the supernova spectra following Wade & Horne (1988). On a number of nights two different spectrometer settings were used to cover the whole optical wavelength range, and the two spectra were combined into a single spectrum. Most of the spectra have dispersion between Å pixel-1 and Å pixel-1, except for the few red spectra taken at Asiago 1.82m telescope, which have a dispersion of Å pixel-1 and one WHT spectrum with Å pixel-1.
The spectra were obtained with the slit oriented along the parallactic angle in order to minimize differential losses due to atmospheric refraction (Filippenko, 1982). Nevertheless the relative flux calibration was not always sufficiently accurate and the final flux calibration was achieved by slightly correcting the spectra to match the observed photometry. This step was done alongside the calibration of the photometry and is discussed in detail in the Appendix.
2.2 Optical photometry
The optical photometric observations of SN 2003du were obtained with a number of instruments equipped with broadband filters. The CCD images were bias and flat-field corrected. Cosmic ray hits were identified and cleaned with the Laplacian detection algorithm of van Dokkum (2001). The observations consist of single exposures at early times and dithered multiple exposures at late epochs. In the latter case, the images in each filter were combined to form a single image. For the -band, we also corrected for fringing in the individual exposures.
| Star | |||||
|---|---|---|---|---|---|
| 1 | 13.864 (39) | 13.848 (22) | 13.309 (13) | 12.960 (13) | |
| 2 | 15.004 (39) | 14.920 (22) | 14.310 (14) | 13.911 (13) | 13.624 (12) |
| 3 | 16.562 (40) | 16.428 (22) | 15.792 (13) | 15.400 (13) | 15.077 (13) |
| 4 | 16.930 (40) | 17.024 (23) | 16.462 (14) | 16.113 (14) | 15.792 (12) |
| 5 | 18.261 (45) | 17.611 (24) | 16.251 (14) | 15.258 (15) | 14.117 (13) |
| 6 | 18.254 (45) | 17.909 (24) | 17.011 (15) | 16.478 (14) | 16.012 (12) |
| 7 | 17.660 (42) | 17.552 (23) | 16.893 (14) | 16.468 (14) | 16.129 (12) |
| 8 | 17.114 (40) | 16.993 (23) | 16.307 (15) | 15.829 (14) | 15.504 (12) |
| 9 | 17.806 (42) | 17.951 (24) | 17.518 (15) | 17.179 (16) | 16.875 (13) |
| 10 | 17.809 (42) | 18.092 (24) | 17.675 (16) | 17.357 (16) | 17.057 (13) |
| 11 | 17.775 (42) | 17.586 (23) | 16.874 (15) | 16.418 (15) | 16.107 (14) |
| 12 | 18.328 (46) | 18.636 (27) | 18.158 (18) | 17.799 (18) | 17.487 (14) |
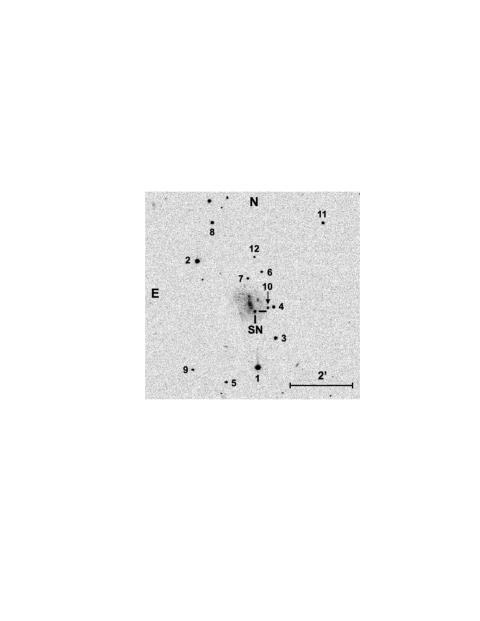
The SN lies only 15″ from the host galaxy nucleus, on a complex background (Fig. 1). The background contamination may significantly degrade the photometry, especially at late epochs when the SN has faded considerably. The approach commonly used is to subtract the background using template galaxy images without the SN, taken either before or a few years after the SN explosion. The galaxy template, preferably with better seeing and signal-to-noise ratio (S/N) than the SN images, is aligned with the SN image, convolved with a suitable kernel so that the point-spread functions (PSF) of the two images are the same, then scaled to match the flux level of the SN image and subtracted. The SN flux can then be correctly measured on the background-subtracted image.
Lacking pre-explosion observations of the host galaxy of SN 2003du, we constructed template images using observations which we obtained more than one year after SN maximum light. The SN magnitudes were measured by PSF-fitting. The small SN contribution was then subtracted and the images were visually inspected for over- or under-subtraction (none was noticed). The best seeing images were then combined to form the templates. The subtraction of the host galaxy from the ”SN + host” images was done with Alard’s (Alard & Lupton, 1998; Alard, 2000) optimal image subtraction software, slightly modified and kindly made available to us by B. Schmidt. When using galaxy templates built in this way, any improperly subtracted SN light will introduce systematic errors into the subsequent photometry. In the case of SN 2003du this should, however, be negligible because at the epochs used to build the templates, the SN was much fainter than on the images to which the template subtraction was applied (at least 2 mag fainter at days and 4–5 mag fainter over the first three months after maximum). Even if we conservatively assume that the final templates still contained 20% of the SN light, the error introduced would be at most 0.03 mag at days and clearly negligible during the first 3-4 months after maximum.
The SN magnitudes were measured differentially with respect to the field stars indicated with numbers in Fig. 1. The instrumental magnitudes were measured by aperture photometry for observations before September 2003 and by PSF fitting at the later epochs. The magnitudes of the field stars were calibrated for two photometric nights at the Nordic Optical Telescope – May 15 and 16, 2003. On each night, the field of the globular cluster M92 that includes the standard stars listed in Majewski et al. (1994) was observed at four airmasses between 1.06 and 1.8. The magnitudes of the standard stars were taken from (Stetson, 2000)222Available at http://cadcwww.hia.nrc.ca/standards/ and as discussed by Stetson (2000) this photometry is essentially in the Landolt (1992) system., while the magnitudes were calculated from the values given in Majewski et al. (1994). The standard star magnitudes were measured with PSF photometry and aperture corrections were applied to convert the PSF magnitudes to magnitudes in an aperture with a radius of five times the seeing. Following Harris et al. (1981), all measured magnitudes were fitted simultaneously (with 3 clipping) to derive linear transformation equations, with the additional requirement that the color-terms and the zero-points to be the same for the two nights. Second-order extinction terms were not included. The calibrations for the two nights agree very well within the estimated photometric (statistical) errors. The weighted average magnitudes from the calibration in the two nights and the corresponding errors are given in Table 2. Note that the uncertainties of the calibrated magnitudes are donated by the uncertainty of the zero-point and not by the statistical uncertainty. A comparison between the stars in common with Leonard et al. (2005) and Anupama et al. (2005) reveals that there are small systematic differences between the photometry; ours being generally brighter. The mean differences with the photometry of Leonard et al. (2005) are, respectively, , , and mag. Excluding star #1 which is brighter in Anupama et al. (2005) in all bands, the mean differences are , , , and mag for the bands, respectively. Some of these differences are non-negligible and we have no explanation of why they appear in the comparison stars calibrations. This is clearly worrisome and emphasizes one important source of systematic errors when different SN data sets are combined and used to derive cosmological parameters.
Landolt (1992) standard fields were observed to derive the instrument color-terms (), allowing us to transform the photometry of SN 2003du to the standard Johnson-Cousins system. The instrumental magnitudes of the standard stars were measured by aperture photometry with large apertures. All measurements for a given instrument were fitted simultaneously (with 3 clipping) with linear equations of the form:
| , | |||||
| , | (1) | ||||
to determine the s. The upper-case and lower-case letters denote the standard and instrumental magnitudes, respectively.
For each SN image, a zero-point was calculated for each calibrated star by applying Eqs. 2.2. The final image ZP and its uncertainty are, respectively, the average of the individual ZPs (with outliers removed if present) and the standard deviation. The measured scatter for the brightest stars was always larger than expected from Poisson statistics. This indicates that there are additional sources of uncertainties: imperfect flat-fielding, presence of non-uniform scattered light, CCD non-linearity, etc. Considering the magnitude scatter of the brightest stars we estimate that these effects contribute mag to the error budget. Finally, the ZPs were added to the measured SN magnitudes to obtain the magnitudes in the natural systems of the instruments used, .

The SN magnitudes can be transformed to a standard photometric system using the color corrections obtained with Eqs. 2.2. It is, however, well known that these color corrections do not work well for SNe and significant systematic differences between photometry obtained with different instruments are often observed (Suntzeff, 2000; Stritzinger et al., 2002; Krisciunas et al., 2003). The reason is that the SN spectral energy distribution (SED) is very different from that of normal stars. Another consequence of this is that if a given band is calibrated against different color indices, e.g. and , one would get the same magnitude for normal stars but slightly different magnitudes for objects with non-stellar SEDs. This is because the color-terms are determined with normal stars, but SNe occupy a different region in the color-color diagrams. The photometric observations of SN 2003du were collected with many different instruments and we chose to standardize the photometry using the S-correction method described by Stritzinger et al. (2002) coupled with our very well-sampled spectral sequence of SN 2003du. The S-correction method assumes that the SED of the SN and the response of the instruments used for the observations are both accurately known. Then one can correct the photometry to any well-defined photometric system by means of synthetic photometry. If is the photon flux of the object per unit wavelength, the object magnitude as defined above, the response of the natural system and the response of the standard system, then the object standard magnitude is:
| (2) | |||||
The constant in Eq. 2 is such that the correction is zero for A0 V stars with all color indices zero. This ensures that for normal stars the synthetic S-correction gives the same results as the linear color-term corrections (Eq. 2.2). The constant can be determined from synthetic photometry of stars for which both photometry and spectrophotometry is available. The details of the application of the S-corrections are given in the Appendix. In Fig. 2 we only show the time evolution of the difference between the S-correction and the linear color-term correction. Note the particularly large difference for Calar Alto , and NOT and -bands, as well as the rather large scatter for the -band at all epochs and for the -band after +20 days.
The final photometry of SN 2003du is given in Table 3. Note that none of the -band and part of the photometry could be S-corrected. Additional and photometry obtained at Moscow and Crimean Observatories is given in Table 4. Figure 3 shows a comparison between the S-corrected and color-term corrected color index and magnitudes. It is evident that in the color-term corrected photometry small systematic differences between the various setups exist. It is also evident that the S-correction removes those differences to a large extent, the exception being the BAO data at early epochs. Significant improvement is also achieved for the -band, which required the largest S-corrections.
| Date (UT) | Phase [day] | JD | Telescope | |||||
|---|---|---|---|---|---|---|---|---|
| 2003-04-25 | 11.0 | 2452755.39 | 14.737 (0.018) | 14.854 (0.014) | 14.728 (0.010) | 14.798 (0.017) | AS1.8 | |
| 2003-04-25 | 10.8 | 2452755.61 | 14.382 (0.011) | 14.629 (0.010) | 14.774 (0.010) | 14.672 (0.010) | 14.756 (0.021) | NOT |
| 2003-04-29 | 7.3 | 2452759.06 | 13.974 (0.014) | 14.072 (0.022) | 13.963 (0.015) | 14.052 (0.017) | BAO | |
| 2003-04-30 | 6.2 | 2452760.17 | 13.820 (0.024) | 13.920 (0.012) | 13.852 (0.010) | 13.936 (0.024) | BAO | |
| 2003-04-30 | 5.8 | 2452760.54 | 13.193 (0.034) | 13.719 (0.018) | 13.860 (0.010) | 13.754 (0.010) | 13.921 (0.021) | TNG |
| 2003-05-02 | 4.0 | 2452762.38 | 13.077 (0.015) | 13.589 (0.021) | 13.712 (0.027) | 13.639 (0.022) | 13.834 (0.023) | TNG |
| 2003-05-04 | 1.9 | 2452764.46 | 13.496 (0.010) | 13.614 (0.018) | 13.592 (0.010) | 13.841 (0.010) | AS1.8 | |
| 2003-05-05 | 1.0 | 2452765.41 | 13.489 (0.012) | 13.595 (0.019) | 13.569 (0.010) | 13.857 (0.011) | AS1.8 | |
| 2003-05-06 | +0.0 | 2452766.40 | 13.489 (0.019) | 13.566 (0.025) | 13.575 (0.011) | 13.870 (0.010) | AS1.8 | |
| 2003-05-07 | +1.1 | 2452767.51 | 13.506 (0.015) | 13.575 (0.014) | 13.590 (0.018) | 13.927 (0.016) | AS1.8 | |
| 2003-05-09 | +3.1 | 2452769.51 | 13.566 (0.010) | 13.587 (0.021) | 13.600 (0.010) | 14.009 (0.010) | AS1.8 | |
| 2003-05-10 | +4.2 | 2452770.61 | 13.234 (0.014) | 13.605 (0.010) | 13.620 (0.016) | 13.600 (0.010) | 13.982 (0.016) | CA2.2 |
| 2003-05-11 | +5.1 | 2452771.51 | 13.316 (0.040) | 13.643 (0.011) | 13.642 (0.017) | 14.017 (0.010) | CA2.2 | |
| 2003-05-13 | +7.2 | 2452773.59 | 13.597 (0.021) | 13.764 (0.010) | 13.712 (0.010) | 13.786 (0.011) | 14.205 (0.018) | NOT |
| 2003-05-14 | +8.2 | 2452774.56 | 13.651 (0.017) | 13.845 (0.011) | 13.758 (0.010) | 13.838 (0.010) | 14.271 (0.010) | NOT |
| 2003-05-15 | +9.1 | 2452775.44 | 13.749 (0.017) | 13.908 (0.010) | 13.795 (0.011) | 13.908 (0.011) | 14.352 (0.015) | NOT |
| 2003-05-16 | +10.1 | 2452776.45 | 13.838 (0.021) | 14.004 (0.014) | 13.842 (0.010) | 13.979 (0.010) | 14.443 (0.011) | NOT |
| 2003-05-17 | +10.7 | 2452777.08 | 14.066 (0.018) | 13.862 (0.010) | 14.040 (0.011) | 14.448 (0.010) | BAO | |
| 2003-05-22 | +15.8 | 2452782.20 | 14.596 (0.013) | 14.186 (0.010) | 14.342 (0.011) | 14.588 (0.017) | BAO | |
| 2003-05-23 | +17.1 | 2452783.49 | 14.722 (0.023) | 14.268 (0.028) | 14.332 (0.012) | 14.626 (0.031) | AS1.8 | |
| 2003-05-24 | +18.0 | 2452784.42 | 14.833 (0.014) | 14.302 (0.014) | 14.350 (0.016) | 14.611 (0.010) | AS1.8 | |
| 2003-05-25 | +19.0 | 2452785.37 | 14.942 (0.012) | 14.350 (0.013) | 14.361 (0.012) | 14.594 (0.010) | AS1.8 | |
| 2003-05-26 | +20.0 | 2452786.38 | 15.043 (0.011) | CA2.2 | ||||
| 2003-05-27 | +21.0 | 2452787.45 | 15.144 (0.017) | 15.146 (0.014) | 14.463 (0.017) | 14.392 (0.012) | 14.464 (0.018) | CA2.2 |
| 2003-05-29 | +22.8 | 2452789.20 | 14.493 (0.031) | 14.451 (0.014) | BAO | |||
| 2003-06-01 | +26.1 | 2452792.51 | 15.809 (0.023) | 15.648 (0.010) | 14.724 (0.010) | 14.453 (0.019) | 14.410 (0.027) | TNG |
| 2003-06-06 | +31.2 | 2452797.58 | 16.172 (0.033) | 16.041 (0.011) | 15.018 (0.014) | 14.658 (0.010) | 14.451 (0.019) | TNG |
| 2003-06-10 | +34.7 | 2452801.06 | 16.363 (0.085) | 15.223 (0.047) | 14.881 (0.018) | 14.540 (0.035) | BAO | |
| 2003-06-14 | +38.7 | 2452805.04 | 15.477 (0.131) | 15.140 (0.013) | 14.829 (0.024) | BAO | ||
| 2003-06-15 | +39.7 | 2452806.04 | 16.472 (0.036) | 15.473 (0.011) | 15.187 (0.018) | 14.929 (0.018) | BAO | |
| 2003-06-20 | +45.1 | 2452811.51 | 16.606 (0.021) | 15.676 (0.010) | 15.415 (0.017) | 15.265 (0.010) | AS1.8 | |
| 2003-06-26 | +51.1 | 2452817.52 | 16.796 (0.023) | 16.727 (0.011) | 15.859 (0.015) | 15.613 (0.011) | 15.584 (0.022) | TNG |
| 2003-06-28 | +52.7 | 2452819.04 | 16.745 (0.023) | 15.892 (0.012) | 15.679 (0.018) | 15.633 (0.038) | BAO | |
| 2003-06-30 | +54.6 | 2452821.03 | 16.753 (0.039) | 15.924 (0.018) | 15.776 (0.032) | 15.715 (0.039) | BAO | |
| 2003-07-04 | +58.7 | 2452825.06 | 16.835 (0.016) | 16.046 (0.019) | 15.874 (0.011) | 15.920 (0.022) | BAO | |
| 2003-07-05 | +60.0 | 2452826.38 | 16.088 (0.016) | 15.926 (0.010) | 16.026 (0.019) | NOT | ||
| 2003-07-08 | +62.7 | 2452829.06 | 16.159 (0.036) | 16.010 (0.017) | 16.096 (0.029) | BAO | ||
| 2003-07-08 | +63.1 | 2452829.53 | 17.004 (0.026) | 16.924 (0.011) | 16.173 (0.010) | 16.036 (0.011) | 16.138 (0.017) | NOT |
| 2003-07-09 | +63.7 | 2452830.06 | 16.194 (0.045) | BAO | ||||
| 2003-07-12 | +66.8 | 2452833.19 | 16.290 (0.020) | 16.140 (0.020) | 16.270 (0.030) | MDK | ||
| 2003-07-17 | +72.0 | 2452838.33 | 17.082 (0.015) | 16.410 (0.015) | 16.275 (0.010) | 16.477 (0.012) | AS1.8 | |
| 2003-08-01 | +87.0 | 2452853.34 | 17.319 (0.010) | 16.769 (0.011) | 16.719 (0.011) | 17.010 (0.011) | AS1.8 | |
| 2003-08-22 | +108.0 | 2452874.40 | 17.618 (0.030) | 17.266 (0.026) | 17.309 (0.028) | AS1.8 | ||
| 2003-08-23 | +109.0 | 2452875.37 | 17.688 (0.011) | 17.281 (0.012) | 17.379 (0.014) | 17.756 (0.018) | AS1.8 | |
| 2003-09-16 | +132.9 | 2452899.32 | 18.763 (0.079) | 17.961 (0.022) | 17.780 (0.021) | 18.040 (0.023) | 18.454 (0.075) | CA2.2 |
| 2003-09-19 | +136.0 | 2452902.38 | 18.844 (0.032) | 18.059 (0.012) | 17.851 (0.017) | 18.077 (0.029) | 18.329 (0.020) | WHT |
| 2003-09-26 | +143.0 | 2452909.34 | 19.140 (0.072) | 18.114 (0.021) | 17.956 (0.043) | 18.330 (0.062) | 18.570 (0.067) | CA2.2 |
| 2003-11-22 | +199.2 | 2452965.62 | 18.660 (0.100) | 18.670 (0.100) | 19.090 (0.120) | CRM | ||
| 2003-11-23 | +200.3 | 2452966.63 | 18.990 (0.060) | 18.930 (0.060) | 19.210 (0.110) | CRM | ||
| 2003-11-25 | +202.2 | 2452968.61 | 18.900 (0.040) | 18.950 (0.050) | 19.330 (0.110) | CRM | ||
| 2003-12-01 | +208.3 | 2452974.63 | 19.020 (0.070) | 19.090 (0.100) | 19.370 (0.120) | CRM | ||
| 2003-12-12 | +220.4 | 2452986.75 | 20.688 (0.038) | 19.304 (0.016) | 19.313 (0.012) | 19.899 (0.041) | 19.673 (0.031) | CA3.5 |
| 2003-12-19 | +227.4 | 2452993.75 | 19.384 (0.010) | 19.419 (0.011) | 19.979 (0.044) | 19.910 (0.033) | CA3.5 | |
| 2004-05-10 | +370.2 | 2453136.62 | 21.476 (0.019) | 21.453 (0.020) | 22.202 (0.044) | 21.192 (0.029) | WHT | |
| 2004-05-11 | +371.2 | 2453137.62 | 22.638 (0.079) | 21.531 (0.011) | 21.493 (0.018) | 22.190 (0.028) | 21.320 (0.030) | WHT |
| 2004-06-22 | +413.4 | 2453179.54 | 22.100 (0.044) | 22.010 (0.026) | 23.010 (0.052) | 21.720 (0.038) | NOT | |
| 2004-08-11 | +463.0 | 2453229.43 | 22.771 (0.027) | 22.827 (0.026) | NOT | |||
| 2004-08-14 | +466.0 | 2453232.39 | 22.212 (0.048) | TNG |
AS1.8 – Asiago 1.82m + AFOSC; NOT – Nordic Optical Telescope + ALFOSC; CA2.2 – Calar Alto 2.2m + CAFOS; TNG – Telescopio Nazionale Galileo + DOLORES; WHT – William Herschel Telescope + PFIP; CA3.5 – Calar Alto 3.5m + LAICA; BAO – Beijing Astronomical Observatory 60cm + CCD; MDK – Maidanak Observatory 1.5m + SITe CCD; CRM – 60-cm Crimean reflector + CCD.
2.3 Near infrared photometry and spectroscopy
Near infrared photometry of SN 2003du was obtained on six nights at TNG and NOT. The two telescopes use identical and filters, but the TNG uses a while the NOT has a filter (Tokunaga et al., 2002). The observations were reduced in the standard way, using the XDIMSUM package in IRAF.
The two nights at the NOT were photometric and standard stars from the list of Hunt et al. (1998) were observed in order to calibrate a local sequence of stars. However, only star #3 (Fig. 1) could be reliably calibrated because it is the only one that is faint enough to be in the linear range of the detector and is bright enough to give an adequate S/N. The average NIR magnitudes of star #3 are , and , all with uncertainties of mag. The calibrated magnitudes are in good agreement with the 2MASS values, which are , and . Star #3 was used to calibrate the TNG photometry. No color terms were applied. The NIR photometry of SN 2003du is given in Table 5.
Eleven low-resolution NIR spectra of SN 2003du were obtained at UKIRT and TNG (Table 6). At UKIRT, the spectral range was covered by using different instrument settings. At TNG an AMICI prism was used as disperser. In this mode the whole NIR spectral range is provided in one exposure at the expense of having very low resolving power (). Both sets of observations were performed in ABBA sequences, where A and B denote two different positions along the slit. After bias/dark and flat field corrections, for each pair of AB images, the B image was subtracted from the A image. The negative spectrum was shifted to the position of the positive one and subtracted from it. This resulted in an image with the sum of the spectra but minus the sky background. All such images were summed into a single image and the 1D spectra were then optimally extracted. We note that the optimal extraction algorithm has to be applied on images where the pixel levels are given in the form of actual detected counts, and so it will not work quite correctly if applied to background-subtracted images. Special care was thus taken to calculate the optimal extraction weights correctly. The UKIRT spectra were wavelength calibrated with arc-lamp spectra, while for the TNG spectra a tabulated dispersion solution relating pixel number to wavelength was used. The dispersion of the UKIRT spectra ranges from Å pixel-1 to Å pixel-1, while for the TNG spectra, the dispersion is in the Å pixel-1 – Å pixel-1 range.

The A5 V star AS-24 (Hunt et al., 1998) and the F7 V star BS5581 (from the list of UKIRT standard stars) were observed at TNG and UKIRT respectively. The standard stars were observed close in time and airmass to the SN observations. The SN spectra were first divided by the spectra of the comparison stars to remove the strong telluric absorption features. The result was multiplied by a model spectrum of the appropriate spectral type, smoothed to the instrumental resolution, to remove any residual features due to the absorption lines of the standard, simultaneously providing the relative flux calibration. The UKIRT spectra from the different instrument settings that did not overlap were combined using the SN 2003du photometry and average NIR color indices of normal SNe Ia.
3 Results
3.1 Light curves
| JD | Phase | Telescope | ||
|---|---|---|---|---|
| 2452765.38 | 1.0 | 13.45 (0.01) | 13.61 (0.01) | 1 |
| 2452768.33 | +2.0 | 13.49 (0.02) | 13.57 (0.02) | 1 |
| 2452775.38 | +9.0 | 13.95 (0.01) | 13.83 (0.01) | 1 |
| 2452782.37 | +16.0 | 14.65 (0.05) | 14.17 (0.02) | 2 |
| 2452786.33 | +20.0 | 14.99 (0.06) | 14.43 (0.02) | 2 |
| 2452792.31 | +25.9 | 14.73 (0.06) | 3 |
1 – 70-cm Moscow reflector + CCD Pictor 416; 2 – 30-cm Moscow refractor + CCD AP-7p; 3 – 38-cm Crimean reflector + CCD ST-7;
| JD | Phase | |||
|---|---|---|---|---|
| [day] | ||||
| 2452755.41 | 11.5 | 14.96 (0.04) | 15.02 (0.04) | 15.02 (0.04) |
| 2452768.68 | +1.7 | 14.42 (0.04) | 14.66 (0.04) | 14.38 (0.04) |
| 2452773.43 | +6.5 | 14.92 (0.04) | 14.77 (0.04) | 14.53 (0.04) |
| 2452777.46 | +10.5 | 15.67 (0.04) | 14.86 (0.04) | 14.70 (0.04) |
| 2452778.51 | +11.5 | 15.84 (0.04) | 14.86 (0.04) | 14.75 (0.04) |
| 2452782.58 | +15.6 | 16.12 (0.04) | 14.85 (0.04) | 14.65 (0.04) |
| Date (UT) | JD | Phase | Coverage | Telescopea |
|---|---|---|---|---|
| [day] | [m] | |||
| 2003 Apr 25 | 2452754.89 | 11.5 | 0.8-2.5 | UK-1 |
| 2003 Apr 25 | 2452755.47 | 10.9 | 0.75-2.45 | TNG |
| 2003 May 01 | 2452760.89 | 5.5 | 0.8-2.5 | UK-1 |
| 2003 May 04 | 2452763.88 | 2.5 | 1.42-2.4 | UK-2 |
| 2003 May 08 | 2452768.68 | +2.3 | 0.9-2.3 | TNG |
| 2003 May 10 | 2452769.79 | +3.4 | 1.39-2.50 | UK-2 |
| 2003 May 11 | 2452770.90 | +4.5 | 0.8-2.5 | UK-1 |
| 2003 May 19 | 2452778.80 | +12.4 | 1.48-2.30 | UK-2 |
| 2003 May 22 | 2452782.58 | +16.2 | 0.9-2.48 | TNG |
| 2003 May 27 | 2452786.77 | +20.4 | 0.8-2.5 | UK-1,2 |
| 2003 Jun 06 | 2452796.80 | +30.4 | 0.8-2.5 | UK-1,2 |
aTNG = TNG + NICS, UK-1/2 = UKIRT + CGS4/UIST
The light curves (LCs) of SN 2003du are shown in Fig. 4. The light curves morphology resemble that of a normal SN Ia with a well-pronounced secondary maximum in the -band and a shoulder in the -band. The -band also shows a strong rise towards a secondary maximum. Comparison with the photometry of Leonard et al. (2005) and Anupama et al. (2005) reveals fairly good consistency. However, systematic differences between the data sets do exist and our photometry is generally brighter. This is probably due to the differences in the comparison star calibrations, as well as to the fact that our photometry was S-corrected, unlike those of Leonard et al. (2005) and Anupama et al. (2005). To estimate the differences we fitted a smoothing spline function to our data and computed the mean difference and its standard deviation from Leonard et al. (2005) and Anupama et al. (2005) photometry. The difference slightly varies with the SN phase. Up to 30 days after maximum light the mean differences and standard deviations in are, respectively, , , and mag with Anupama et al. (2005) and , , and mag with Leonard et al. (2005). The difference with the Anupama et al. (2005) -band photometry is mag.

We fitted the -band template of Nugent et al. (2002) to the data to determine the -band light curve parameters. This provided the time of maximum light (JD)=2452766.38 (2003 May 6.88 UT), stretch factor and peak magnitude mag. The peak magnitudes were estimated by fitting low-order polynomials to the data around maximum, giving , and mag. The -band maximum was estimated by fitting our own template derived from the SNe published by Jha et al. (2006a): mag. The optical photometric coverage around 15 days after is rather sparse. However, the -band template matches the observed photometry very well, thus we are able to use this to determine the decline rate parameter. We find . template light curves with were also generated using the data and the method described by Prieto et al. (2006). These light curves are also shown in Fig. 4, shifted to match SN 2003du peak magnitudes. The resemblance between SN 2003du light curves and the templates is excellent.

The NIR templates from Krisciunas et al. (2004b) were fitted to the first three photometric points (Fig. 4) to estimate the peak magnitudes: , and mag. The rms around the fits are fairly small 0.03, 0.02 and 0.04 mag, respectively, but because the LCs are undersampled the uncertainties in the peak magnitudes should exceed these values. To derive the templates, Krisciunas et al. (2004b) fitted third-order polynomials to the photometry of a number of SNe. The rms around the fits are 0.062, 0.080 and 0.075 mag for , and , respectively. These numbers were added in quadrature to the rms around the fits to the SN 2003du data to obtain the uncertainties of the peak magnitudes, 0.07, 0.08 and 0.09 mag, respectively.
The entire light curves are shown in the inset of Fig. 4. The late-time data from Leonard et al. (2005) are also shown (open symbols); these are consistent with our ground based photometry. After days the magnitudes of SN 2003du decline linearly, following the expected form of an exponential radioactive decay chain. The decline rates in magnitudes per 100 days in -bands (as determined by linear least-squares fitting) are , , , and , respectively. The decline rates in the - and -bands are virtually the same. The -band decline on the other hand is much slower than in the other bands. Many other normal SNe Ia (e.g., Lair et al., 2006) and the peculiar SN 2000cx (Sollerman et al., 2004) also show similar behavior.
3.2 Reddening in the host galaxy
Figure 5 shows that the time evolution of the color indices (CIs) of SN 2003du closely follows the reddening corrected CIs of normal SNe such as 1990N, 1998aq, and 1998bu, as well as the Nobili et al. (2003) templates. This implies that SN 2003du was probably not reddened within its host galaxy. Nevertheless, the reddening in the host galaxy was estimated with three different methods. The CIs of SN 2003du were first corrected for the small Milky Way reddening of (Schlegel et al., 1998) assuming .
i) Phillips et al. (1999) use the observed and indices, and the evolution of between 30 and 90 days after maximum to derive . The first two quantities are weak functions of . The time evolution of (known as the Lira relation) seems to hold for the majority of SNe Ia (Phillips et al., 1999; Jha et al., 2006b). Following Phillips et al. (1999), for SN 2003du we obtain , and . The errors indicate the intrinsic accuracy of the three methods as given in Phillips et al. (1999), viz. 0.03, 0.04 and 0.05, added in quadrature to the uncertainties of the observed CIs. Note that the evolution of SN 2003du has a different slope from that of the Lira relation, leading to rather a large scatter of mag. We averaged the above estimates of , 0.8333the factor 0.8 serves to convert to assuming the standard Milky Way extinction law with . and weighted by their respective uncertainties to obtain the final reddening estimate: .
ii) Wang et al. (2003b) introduced a novel method, CMAGIC, to estimate the brightness and the reddening of SNe Ia. It is based on the observation that between 5-10 to 30-35 days after maximum the magnitude is a linear function of with a fairly uniform slope. Applying this method, we obtain .

iii) Krisciunas et al. (2000, 2001, 2004b) have shown that the intrinsic CIs of SNe Ia are very uniform and can be used to estimate the reddening of the host galaxy. Figure 6 shows the CIs of SN 2003du overplotted with the unreddened loci for mid- () and slow-declining SNe () of Krisciunas et al. (2004b). Most of the data of SN 2003du fall between the two loci. This is consistent with the fact that its lies between these two groups of SNe Ia. Although the CI is slightly redder than the locus, overall the CIs of SN 2003du suggest little reddening.
Combining the results of the three estimates we conclude that SN 2003du suffered negligible reddening within the host galaxy. The main parameters of SN 2003du that we derived from photometry are summarized in Table 7.
3.3 Spectroscopy

Our collection of optical spectra of SN 2003du is shown in Figs. 7 and 8. The spectra marked with an asterisk have been smoothed using the á trous wavelet transform (Holschneider et al., 1989). The optical spectral evolution of SN 2003du is that of a normal SN Ia. In the earliest spectrum at days the Si ii 6355 line is strong and broad ( km s-1 full-width at half-depth), and the S ii 5454 and 5640 lines are well developed. In the day spectrum the Ca ii H&K and the IR triplet lines are also very strong. In all the spectra until one week after maximum light, Si ii 4129 and 5972 lines are clearly visible. Mg ii 4481, Si iii 4553,4568 and the blend of Fe ii, Si ii and S ii lines around 4500–5000 Å are also prominent. A few days after the spectrum starts to be dominated by Fe group elements and gradually evolves into a nebular spectrum.
The ratio between the depth of the Si ii 5972 and 6355 lines, Si ii (Nugent et al., 1995), at maximum is Si ii, typical for normal SN Ia. Si ii does not change significantly in the pre-maximum spectra, remaining at .
| [JD] | |
|---|---|
| (UT date) | May 6.88, 2003 |
| -band stretch, | 0.988 |
| -band decline rate, | 1.02 |
| Peak magnitudes | |
| Late-time decline | |
| rate [mag/100 days] | |
| E | 0.00 |

In Fig. 9 three of the pre-maximum spectra of SN 2003du are compared with spectra of other normal SNe Ia observed at similar epochs and appropriately de-reddened. For this and other comparison plots we use published optical spectra of SN 1994D (Patat et al., 1996; Filippenko, 1997; Meikle et al., 1996), SN 1990N (Leibundgut et al., 1991), SN 1996X (Salvo et al., 2001), SN 1999ee (Hamuy et al., 2002), SN 1998aq (Branch et al., 2003), SN 1998bu (Jha et al., 1999; Hernandez et al., 2000), SN 2002er (Kotak et al., 2005), SN 2001el (Wang et al., 2003a; Mattila et al., 2005) and SN 2005cg (Quimby et al., 2006). The spectra at about 10 days before maximum show significant differences. The spectra have not been taken at exactly the same phase and the rapid spectral evolution at such early phases may partly be responsible for the differences. However, most of the differences are most likely intrinsic. It worths noting that the weak feature at 6300 Å that is visible in the two earliest spectra of SN 2003du is present in other SNe Ia as well (Fig. 10) and has been attributed to C ii 5860 (Mazzali, 2001; Branch et al., 2003; Garavini et al., 2004, 2005). At one week before maximum the spectra are more similar to each other. It is interesting to note that at these epochs the largest differences between the SNe are seen in the strengths and profiles of the Si ii 6355, Ca ii H&K and Ca ii IR3 lines. Starting from one week before maximum the spectra of most SNe Ia are very homogeneous.
The NIR spectra of SN 2003du are shown in Fig. 11. The earliest spectra at and days are rather featureless with only hints at weak broad P-Cygni profiles. The weak m absorption could be due to Mg ii 10926 or He i 10830 (or a combination of the two) (Meikle et al., 1996; Mazzali & Lucy, 1998; Branch et al., 2004; Marion et al., 2003). The strength of this absorption in the earliest two spectra is quite different, despite the fact that they have been taken only half a day apart. In the days spectrum, however, the absorption is likely enhanced by a noise spike due to the low instrument response at this wavelength.
In the day spectrum an absorption due to Mg ii 9226 (Marion et al., 2003) is clearly seen. In the earlier IR spectra there are only hints of its presence and it may be just detectable in the optical spectrum at day . Our experiments with the SN spectral synthesis code SYNOW (see for details, e.g. Branch et al., 2003) show however, that Si iii and possibly Si ii may contribute to the red part of this line. No other features are detected in the 0.9-1.2 m spectral region. In particular, no C i or O i lines are observed, in accordance with the findings of Marion et al. (2006). The absorption at m is due to Ca ii according to Wheeler et al. (1998), but the associated emission peak at m was attributed to Fe iii by Rudy et al. (2002) in SN 2000cx. The m absorption seen in the spectra until maximum light is due to Si ii with a possible contribution from Mg ii (Wheeler et al., 1998; Marion et al., 2003). The broad features beyond m lack clear identification. Possible contributors are Si iii at m (Wheeler et al., 1998) and Co ii at m and m (Marion et al., 2003).


By day , two strong emission features at m and m dominate the 1.4-1.8 m spectral region. These two features are formed by blending of many Fe ii, Co ii and Ni ii emission lines (Wheeler et al., 1998). Lines of Fe ii, Co ii, Ni ii and Si ii dominate the spectral region beyond 2 m. From day , a number of lines, with uncertain identifications also develop in the band. One can also clearly see how a flux deficit at m develops. This causes the very deep minimum observed in the -band light curves of most SNe Ia around 20 days after maximum.
Figure 12 presents a comparison of several IR spectra of SN 2003du with those of other normal SNe: SN 1994D (Meikle et al., 1996), SN 1999ee (Hamuy et al., 2002), SN 1998bu (Jha et al., 1999; Hernandez et al., 2000; Hamuy et al., 2002), and SN 2002bo (Benetti et al., 2004). Similarly to the optical, the IR spectra of normal SNe taken at similar epochs are very homogeneous, even the spectra taken 6–12 days before maximum. The only significant difference is in the -band, where the Mg ii lines of SN 2002bo are stronger compared to other SNe.

3.4 Blueshifts of absorption-line minima
We have measured the blueshifts of the absorption-line minima of Si ii 6355, S ii 5640 and Si iii 4553,4568, which are thought to be relatively un-blended (Branch et al., 2003), by fitting a Gaussian to the line absorption troughs. In the rest of the paper we report the velocities that correspond to the measured blueshifts of the absorption-line minima (unless otherwise stated) and will refer to these as velocities of the absorption lines. By convention, these velocities are negative and we say that the velocity of a line increases from, e.g. to km s-1. The velocities inferred from an explosion model will be reported as positive numbers.
The velocities of the Si ii 6355, S ii 5640 and Si iii 4553,4568 lines are shown in Fig. 13 and it is evident that the time evolution is very similar to that in other normal SNe Ia (see, e.g. Benetti et al., 2005). The Si ii 6355 velocity initially increases rapidly, but 7–5 days before maximum the increase rate slows down and the velocity remains almost constant thereafter. The velocities of the S ii 5640 and Si iii 4553,4568 lines increase at nearly constant rate; however, there is a hint that the S ii 5640 velocity remains constant after maximum, similarly to Si ii 6355. Benetti et al. (2005) measured a post-maximum velocity increase rate of the Si ii 6355 line to be km s-1d-1 and classified SN 2003du as a Low Velocity Gradient SN Ia, along with other normal and all overluminous SNe Ia. It can be seen from Fig. 1 in (Benetti et al., 2005) that before maximum the Si ii 6355 velocities of SN 2003du are systematically higher by 500-2000 km s-1 compared to all other SNe.

During the SN photospheric epochs the main source of continuum opacity at the optical wavelengths is electron scattering and following Jeffery et al. (1992) we adopt that the (continuum) photosphere is at electron scattering optical depth 2/3. However, the velocity gradient in the expanding SN ejecta causes many weak lines to overlap which gives rise to strong pseudo-continuum (e.g., Pauldrach et al., 1996), and the so-called expansion opacity (Karp et al., 1977; Pinto & Eastman, 2000) is an analytical description of this effect. This expansion opacity may exceed electron scattering opacity by orders of magnitude. The velocity of the pseudo-photosphere thus created is wavelength-dependent. Besides, strong absorption lines may form in a large volume above the continuum photosphere. For these reasons, the line velocities we measure most likely do not trace the velocity of the continuum photosphere and should be interpreted with caution. Lentz et al. (2000) have computed a grid of photospheric phase atmospheres of SNe Ia with different metallicities in the C+O layer and computed non-LTE synthetic spectra. It would be more reasonable for us to compare the Si ii 6355 line velocities in SN 2003du with the measurements from the Lentz et al. (2000) synthetic spectra. The time evolution is qualitatively similar and in Fig. 13 we also show the measurements for the 1/3 Solar metallicity models, which best follows the SN 2003du Si ii 6355 line blueshift.
Marion et al. (2003) showed that the velocities of lines in NIR spectra could be used to constrain the location of the transition region between the layers of explosive carbon and oxygen burning, and incomplete to complete silicon burning, and hence place constraints on the explosion models. We measured the velocities of the blue edges of the absorptions at m and 1.05 m in our optical and IR spectra between and days. Both lines show constant velocities of km s-1 and km s-1, respectively, assuming that the lines are formed by Mg ii 9226 and Mg ii 10926. The constant velocity indicates that the continuum photosphere is well beneath the Mg-rich layers (Meikle et al., 1996). The velocity of the sharp edge at m in the spectra between +10 and +20 days can be used to estimate the transition between the layers of incomplete and complete silicon burning. We measure velocities km s-1 which is similar to the results of Marion et al. (2003) and is also broadly consistent with their reference explosion model in which Si is completely consumed below km s-1. This ties in with the measurements of the Si ii 6355 line velocity, which is always km s-1.
4 Discussion
4.1 The distance to SN 2003du
We have shown that SN 2003du was a spectroscopically and photometrically normal SN Ia, and furthermore that it was not reddened within its host galaxy. The distance to UGC 9391 has not been measured using direct techniques, and the only available information is from its recession velocity. The observed velocity is 1914 km s-1, which after correcting for the Local Group in-fall onto Virgo becomes 2195 km s-1 (from the LEDA database) or a distance modulus of mag on the scale of km s-1,Mpc-1.
Recently, Riess et al. (2005) calibrated the luminosities of SN 1998aq and SN 1994ae by observing Cepheids in their host galaxies with the Hubble Space Telescope. Including two other SNe Ia with Cepheid calibrated distances, they estimated the absolute magnitude of a typical SN Ia to be 444Riess et al. (2005) estimated km s-1,Mpc-1 and , and we converted their to the scale of km s-1,Mpc-1 (statistical) (systematic) mag. Meikle (2000) and Krisciunas et al. (2004a, c) presented evidence that SNe Ia are standard candles in the NIR and that no correction for the light curve shape is needed for SNe with mag. Krisciunas et al. (2004c) derived the following absolute peak magnitudes for km s-1,Mpc-1: , and mag all with statistical uncertainty of mag. The systematic uncertainty of is mostly due to the 0.1 mag uncertainty in the distance to the Large Magellanic Cloud (LMC) and hence it also affects the NIR absolute magnitudes and the distance modulus derived from the host galaxy recession velocity (through ). The light curve decline rate parameter and the normal spectral evolution suggest that SN 2003du is very similar to normal SNe Ia. If one assumes that SN 2003du had the above-mentioned absolute magnitudes, a distance modulus of (or a radial velocity of km s-1 with km s-1,Mpc-1) is obtained 555The absolute magnitudes of Meikle (2000) are by 0.4 mag brighter than those of Krisciunas et al. (2004c). The distance moduli derived with the values from the latter paper are consistent with the estimates of absolute magnitude from Riess et al. (2005); we therefore adopt the Krisciunas et al. (2004c) values.. This estimate is the average of the four individual estimates weighted by their statistical uncertainties, i.e. the errors of SN 2003du peak magnitudes added in quadrature to the statistical uncertainties of the absolute magnitudes.

The difference between the two distance moduli is 0.37 mag (it will further increase if the Meikle 2000 absolute NIR magnitudes are used) and indicates that SN 2003du was fainter than the average of SNe with . The dispersion of SNe Ia absolute magnitudes in both, optical and IR, is mag (e.g., Phillips et al., 1999; Krisciunas et al., 2004c). The uniformity and the small dispersion of the colors of SNe Ia (Krisciunas et al., 2004b) indicates that the intrinsic scatter in the bands is correlated, and so cannot be reduced by averaging observations in different bands. Therefore, the distance modulus we estimate, mag, has an additional mag uncertainty from the intrinsic dispersion of SNe Ia luminosity. The fact that SN 2003du is 0.37 mag fainter than expected for SNe with may thus be due to the intrinsic scatter ( from of the mean). It is also possible that UGC 9391 may not be in the undisturbed Hubble flow: if it has km s-1 and a peculiar velocity component of km s-1 toward the Earth, it may seem closer than it really is. UGC 9391 is nearly face-on and the contribution of the galaxy rotation should be small.
4.2 The bolometric light curve
In order to compute the ”bolometric” light curve (i.e. the flux within the 0.2-2.4m interval) of SN 2003du we proceeded as follows. First, our -band template LC was fitted to the photometry in order to estimate the magnitudes when only were available. The magnitudes were corrected for the small Galactic reddening and transformed to flux densities using the absolute calibration of the system by Bessell et al. (1998). A cubic spline was fitted through the data points and the resulting fit was integrated numerically over the interval 3500-9000 Å.
Most of the early-time SN Ia luminosity is emitted at optical wavelengths, however, a non-negligible correction for the flux emitted outside the optical wavelengths is also needed (see, e.g. Suntzeff, 1996). The flux emitted beyond 9000 Å was estimated by integrating the combined optical-NIR spectra of SN 2003du. The filled circles in Fig. 14a show the time evolution of the ratio of the flux emitted in the 9000-24000 Å range to that emitted within 3500-9000 Å. Suntzeff (1996) finds that at days less than 10% of the flux is emitted in the IR. We estimate from the photometry of SN 2001el (Krisciunas et al., 2003) that the contribution of the IR flux is % and % at and days, respectively. This is consistent with our estimates for SN 2003du and the findings of Suntzeff (1996), and indicates that the contribution of the IR flux decreases roughly linearly between days and .
As there are no UV spectra of SN 2003du observed, we used UV spectra of other SNe Ia to estimate the contribution of the UV flux. These comprised combined de-reddened UV-optical spectra of SN 1990N at and days (Leibundgut et al., 1991), SN 1989B at (Wells et al. 1994 and UV spectra from the archive), SN 1981B (Branch et al., 1983), SN 1992A at , and (Kirshner et al., 1993), and SN 2001el between and (from archive). For spectra that did not cover the full 2000–9000 Å range we extrapolated to 9000 Å using spectra of SN 2003du. The spectra of SN 2001el were linearly extrapolated from Å down to 2000 Å assuming that the flux approached zero at 1000 Å. In Fig. 14a we show the ratios of the fluxes in the 2000–3500 Å range to those in the 3500–9000 Å range (open symbols).
The total contribution of the UV and IR fluxes is plotted as a dashed line in Fig. 14a, and one can see the particularly large corrections needed before the -band maximum and around the secondary -band maximum. Beyond +80 days we assumed a constant IR contribution of 10% and that the UV contribution decreases linearly from 5% at +80 days to zero at +500 days. This correction was applied to the optical fluxes to derive the fluxes of SN 2003du. These were converted to luminosity assuming a distance modulus mag. The ”bolometric” light curve of SN 2003du is shown in Fig. 14b. For comparison, we also show the bolometric light curve of SN 2005cf (Pastorello et al., 2007b), which is very similar to that of SN 2003du. The maximum ”bolometric” luminosity of SN 2003du is erg s-1 at days before the -band maximum. Using Arnett’s Rule as formulated by Stritzinger & Leibundgut (2005, their Eq. 7)) we estimate the amount of synthesized during the explosion, . The error is a simple propagation of the uncertainty of the bolometric peak luminosity and the relation of Stritzinger & Leibundgut (2005). However, Khokhlov et al. (1993) have shown that the simplifying assumptions made in the derivation of Arnett’s rule may lead to errors as large as 50%. Combined with the uncertainty of the distance to SN 2003du, clearly this estimation of the mass is subject to large systematic uncertainty. Note, however, that Stritzinger et al. (2006) have analyzed a nebular spectrum and the optical photometry of SN 2003du, and derived , which is in good agreement with our estimate. If one accepts a distance modulus of mag ( Mpc), then the estimated peak luminosity and should be reduced by %.
4.3 Bolometric light curve modeling
To further estimate the amount of synthesized we modeled the bolometric light curve of SN 2003du for both distance moduli and mag. We used the Monte Carlo light curve code described by Cappellaro et al. (1997) and Mazzali et al. (2001). Starting from an explosion model and a given content the code computes the transport and deposition of the -rays and the positrons generated by the decay chain in a grey atmosphere. The optical photons that are generated by the thermalization of the energy carried by the -rays and the positrons are then followed as they propagate through the SN ejecta. The optical opacity encountered by these photons is again assumed to be grey and to depend primarily on the relative abundance of iron-group elements. The opacity also decreases with time as , being the time since the explosion in days, to mimic the effect of the decreasing temperature. For more details on the adopted parametrization of the opacity see, e.g. Mazzali et al. (2001). This simple approximation works well (e.g. Mazzali et al., 2001) but an alternative view that the opacity depends primarily on temperature has been suggested (Kasen & Woosley, 2007). In Mazzali et al. (2000) the Monte Carlo code was compared with the results from the radiation hydrodynamics code of Iwamoto et al. (2000), finding very good agreement.
We followed the approach of Mazzali & Podsiadlowski (2006), who assumed that stable Fe-group isotopes (e.g. , ) may be present not only in the innermost part of the ejecta (), but also in the zone between and . Mazzali & Podsiadlowski (2006) suggested that the scatter of SNe Ia luminosity at a given may be reproduced by changing the ratio of the amount of radioactive and the stable isotopes in the zone, while keeping the total mass of the Fe-group elements constant. This ratio may be sensitive, for example, to the metallicity of the progenitor white dwarf (Timmes et al., 2003). The SN Ia light curve width is mainly determined by the opacity of the ejecta, which in turn is mostly determined by the total amount (stable and radioactive) of Fe-group elements synthesized, provided the temperature is above K (e.g. Khokhlov et al., 1993). The peak luminosity on the other hand is determined by the amount of . Therefore, if the fraction of stable Fe-group isotopes is varied within reasonable limits (%) the temperature may not be affected significantly, and thus the opacity may be effectively unchanged. This would lead to light curves with the same width, but different luminosities.

As shown in Fig. 14b, the ”bolometric” light curve of SN 2003du is remarkably similar to that of SN 2005cf (Pastorello et al., 2007b) if mag is adopted. Therefore, a model similar to that adopted for SN 2005cf can be used also to reproduce the light curve of SN 2003du. In this case the best fit, shown in Fig. 14b, is obtained for a model with 0.69 of and 0.42 of stable Fe-group isotopes using the W7 explosion model (Nomoto et al., 1984) as an input. This estimate of the amount of is in excellent agreement with the estimate derived above using Arnett’s rule. However, mixing out of a sufficient amount of is necessary to reproduce the early rise of the light curve. This is a feature that is not present in one-dimensional explosion models, but is often inferred from SN data. For example, for SN 2002bo, using the abundance distribution and the amount of mixed out as derived from an abundance tomography experiment (Stehle et al., 2005) gave a much better reproduction of the bolometric light curve. What is interpreted as mixing in one-dimensional models may be related to the presence of high velocity features (Mazzali et al., 2005b), which affect the early spectra of SN 2003du quite heavily.
If the true distance modulus were , the light curve could only be reproduced if the total mass of iron group elements was the same as above (i.e. 1.11) but the content was . While this may still be a possibility, with such a low mass (less than half of the total Fe-group content) it can be expected that the heating by radioactive decay is not sufficient to keep the gas at a sufficiently high temperature (K) that the opacity is unchanged. At lower temperatures, the opacity rapidly drops (Khokhlov et al., 1993), and thus the light curve would not be as broad as observed. We therefore suggest that a reasonable range of distances for SN 2003du is between and 33.0 mag, implying a mass between 0.6 and 0.8 for a total Fe-group elements mass of .
Roughly 200 days after maximum SN Ia ejecta become transparent to the -rays and the main source of energy is the positrons produced by the decay of . If the positrons are fully trapped and deposit all their kinetic energy, the true bolometric LC should have a decline rate of mag per 100 days. Larger decline rates are typically found in SNe Ia, and assuming that the optical flux follows the true bolometric flux, this is usually interpreted as evidence for positron escape (see, e.g., Colgate et al., 1980; Cappellaro et al., 1997; Ruiz-Lapuente & Spruit, 1998; Milne et al., 1999). The ”bolometric” luminosity decline rate of SN 2003du after 200 days is 1.4 mag per 100 days. However, late-time NIR observations of few SNe Ia have recently been published (SN 1998bu – Spyromilio et al. 2004; SN 2000cx – Sollerman et al. 2004; SN 2004S – Krisciunas et al. 2007) and indicate that after 300–350 days the NIR luminosity does not decline but stays nearly constant. The contribution of the NIR flux therefore increases with time and if accounted for may lead to decline rates lower than the observed ones and closer to the full positron trapping value. Motohara et al. (2006) obtained late-time NIR spectra (1.1-1.8 m) and -band photometry of SN 2003du. At +330 days SN 2003du had an magnitude of 20.12 (Motohara et al. private communication) and we calculate the integrated flux across the -band to be % of the optical flux at that epoch. The late-time NIR spectra of SN 2003du indicate that the integrated and band fluxes are nearly equal, implying that the contribution of the NIR flux is at least 6%. If we adopt a 10% NIR contribution at +330 days and assume that the total NIR flux did not change afterwards, we obtain a decline rate of 1.2 mag per 100 days, which is still larger than the full positron trapping value.
In Fig. 14c we compare the ”bolometric” LC of SN 2003du with the two models presented by Sollerman et al. (2004). The models are in the form of broadband -to- magnitudes. For a consistent comparison with SN 2003du we used only the model fluxes to compute the model LC in exactly the same way as for SN 2003du. The models are generic, and have not been tuned to any particular SN. They have been computed with 0.6 and assume full positron trapping, and differ only in the treatment of the photoionization representing two extreme cases that the UV photons either escape or are fully redistributed to lower energies (for more details see Sollerman et al. 2004 and references therein). For a comparison with SN 2003du the models were only re-scaled to a distance modulus mag, and yet they fit the absolute flux level of the LC of SN 2003du quite well. It is evident from Fig. 14c that a model with an intermediate treatment of the photoionization could reproduce the SN 2003du light curve. Figure 14c also shows a model computed with the Monte Carlo code using the best parameters we estimated above. Only the opacity to positrons was adjusted to fit the late-time decline rate (Cappellaro et al., 1997). The best value is cm-2 g-1, which is well within the range of values found by Cappellaro et al. (1997).
Both late-time LC models we discussed are based on the 1D W7 explosion model and do not include a contribution from magnetic fields. However, detailed calculations (Ruiz-Lapuente & Spruit, 1998; Milne et al., 1999) show that the positron deposition rate is quite sensitive to the magnetic field configuration in the ejecta and the actual explosion model. Clearly, to fully exploit the information in the bolometric LC a more detailed study is needed, but this is beyond the scope of this paper.
4.4 Evolution of Si ii 6355, Ca ii H&K and IR triplet

Figure 15 shows the pre-maximum evolution of the absorption lines Si ii 6355, Ca ii H&K and Ca ii IR3 in SN 2003du (here we also use a few spectra of SN 2003du from Gerardy et al. 2004 and Anupama et al. 2005) and other SNe Ia. In the days spectrum of SN 2003du the Si ii 6355 line is broad and rather symmetric. In the day spectrum the line is asymmetric and narrower, but around a week before maximum becomes symmetric again and the profile does not change much until maximum. The line evolution in SN 1994D is very similar, but is delayed with respect to SN 2003du: the and day spectra of SN 2003du are most similar to those of SN 1994D at and days. Similar evolution is also observed in SN 2001el, SN 1990N, SN 1999ee and SN 2005cg, but the pre-maximum coverage of these SNe is rather sparse. Nevertheless, this profile evolution may be explained if the Si ii 6355 line is a blend of two components. At days before maximum, the strength of the two components should be nearly equal. The blue component then decreases very rapidly, disappearing by days before maximum, while the red component increases in strength. In SN 2003du, the blue component was last seen in the day spectrum as a weak feature on the blue wing of the line, and in SN 2001el it may be still present in the day spectrum. The peculiar flat-bottom line shape in the early spectra of SN 2001el and SN 1990N is thus due to the blue component extending over a larger velocity interval compared to other SNe. The day spectrum of SN 1999ee on the other hand, has a stronger blue component such that the line is asymmetric with an extended red wing. Note that Mazzali (2001) and Mazzali et al. (2005b) find that a two-component model is needed to explain the peculiar Si ii 6355 line shape in SN 1990N and SN 1999ee, the high-velocity (HV) component being carbon/silicon and a thin pure Si shell, respectively. It is also clear that the early-time evolution of the blueshift of the line-profile minimum will be largely determined by the evolution of relative strength of the two components, and therefore will be very difficult to interpret.
Mattila et al. (2005) suggest that the flat-bottomed shape of Si ii 6355 in SN 2001el and its disappearance over a few days can be explained by the effects of scattering within a thin region moving at the continuum photospheric velocity, thus requiring no absorbing HV material to produce the line shape. Quimby et al. (2006) argue that the triangular shape of the profile in SN 2005cg with an extended blue wing (see, Fig. 15) may be due to absorption by Si in the HV part of the ejecta. The line profile may be reproduced if the Si abundance slowly decreases toward high velocities, which is typical for the delayed-detonation models (Khokhlov, 1991). However, these both suggestions may have difficulties to explain asymmetric line profiles with a stronger blue component as observed in SN 1999ee. SN 1999ee is not unique. SN 2005cf, observed by the ESC with daily sampling starting from 12 days before maximum (Garavini et al., 2007), shows Si ii 6355 line that consists of two distinct components with profile evolution similar to SN 1999ee. It is therefore likely that the ”peculiar” profiles in SN 2001el, SN 1990N and SN 2005cg are just snapshots of this common evolutionary pattern. In addition, if more SNe Ia like SN 2005cf and SN 1999ee are found, the suggestion of Quimby et al. (2006) that the SNe Ia with a flat-bottomed Si ii 6355 line may constitute a separate sub-class of SNe Ia, possibly produced from different progenitors and/or explosion models can be ruled out.
In the day spectrum of SN 2003du the Ca ii H&K line is a broad, single absorption with high velocity of km s-1. In the days spectrum another, less blueshifted Ca ii H&K component is also visible at velocity of km s-1. In the subsequent spectra, the HV component decreases in strength, while the low-velocity one grows stronger. Qualitatively the same evolution of also observed in SN 1994D. In the near maximum spectra, the HV component is much weaker, if present at all, in SN 1994D and SN 1998bu than in SN 2003du and SN 2001el. It can be seen in Fig 15 that the strength of the HV component in SN 1994D decreases faster than in SN 2003du and SN 2001el, thus qualitatively following the evolution of the Si ii 6355 HV component. On the other hand, SN 1998bu either lacked HV components altogether, or they disappeared faster than in SN 1994D. The evolution of the Ca ii IR3 line is shown for few epochs only, but it is evident that a strong HV component with velocity of km s-1 is also present and that this component disappears at different time, earliest in SN 1994D, followed by SN 2003du, and latest in SN 2001el. It is also interesting to note that there is a segregation of SNe Ia according to Ca ii H&K line profile: (i) SNe with a single-component line at all epochs, SN 2004S (Krisciunas et al., 2007), SN 1999ee and SN 2002bo being examples, and (ii) SNe like SN 2003du and SN 1994D with double-component line after maximum. In SN 1994D the blue component of the post-maximum Ca ii H&K-split is already visible in the spectrum as a weak feature superimposed on the broad HV component, while in SN 2003du it becomes apparent only around maximum, possibly because the HV component remains visible longer than in SN 1994D. Possible identification for this feature is Si ii 3850 (Nugent et al., 1997; Lentz et al., 2000), which is also supported by the identification of strong Si ii 3850 line in the early spectrum of SN 2004dt (Wang et al., 2006).
Due to severe line blending it is difficult to quantify the strength of the HV components at different epochs. However, the qualitative comparison strongly suggests that the strength of the HV components in the Si ii 6355, Ca ii H&K and Ca ii IR3 line in given SN are correlated and evolve similarly. The HV features in the Ca ii lines are stronger and more separated from the lower-velocity components than in the Si ii 6355 line. Comprehensive spectral modeling of the line profiles evolution is therefore needed to verify the two-component hypothesis for Si ii 6355 and further investigate the HV features (e.g. Mazzali et al., 2005b). Such an analysis of the SN 2003du spectra will be presented elsewhere. Currently, there is no consensus on the origin of the HV features. Interaction of the ejecta with circumstellar matter close to the SN (e.g. Gerardy et al., 2004) or the clumpy ejecta structure found in some explosion models (e.g., Mazzali et al., 2005b; Plewa et al., 2004; Kasen & Plewa, 2005) could cause the observed HV features. The continuum polarization in SNe Ia is typically low, but much higher polarization across the lines including the HV features is often observed, which favors the clumpy ejecta model rather than a global asymmetry (Wang et al., 2003a, 2006, 2007; Leonard et al., 2005). The HV features may thus carry information about the 3D structure of the ejecta and the environment close to the SN explosion site. Modeling of time sequences of flux and polarization spectra (e.g., Kasen et al., 2003; Thomas et al., 2004; Wang et al., 2007) may allow us to recover this information and help to impose additional constraints on the SN Ia explosion and progenitor models.
5 Summary
We present an extensive set of optical and NIR observations of the bright nearby Type Ia SN 2003du. The observations started 13 days before -band maximum light, and continued for 480 days after with exceptionally good sampling. The optical photometry was performed after the background contamination from the host galaxy had been removed by subtraction of template images. The photometry was obtained using a number of instruments with different filter responses. In order to properly account for deviations from the standard system responses, the optical photometry was calibrated by applying S-corrections.
Our observations show that the spectral and photometric evolution of SN 2003du in both, optical and NIR wavelengths, closely follow that of the normal SNe Ia. The luminosity decline rate parameter is found to be , the ratio between the depth of the Si ii 5972 and 6355 lines Si ii and the velocity of the Si ii 6355 line is km s-1 around maximum light. The analysis of the light curve suggests that of was synthesized during the explosion. All this indicates an average normal SN Ia. We also find that SN 2003du was unreddened in its host galaxy. This property is important for better understanding of the intrinsic colors of SNe Ia in order to obtain accurate estimates of the dust extinction to the high-redshift SNe Ia, which is one of the major systematic uncertainties in their cosmological use. SN 2003du also showed strong high-velocity features in Ca ii H&K and Ca ii IR3 lines, and possibly in Si ii 6355. The excellent temporal coverage allowed us to compare the time evolution of the line profiles with other well-observed SNe Ia and we found evidence that the peculiar pre-maximum evolution of Si ii 6355 line in many SNe Ia is due to the presence of two blended absorption components.
The well-sampled and carefully calibrated data set we present is a significant addition to the well-observed SNe Ia and the data will be made publicly available for further analysis. For example comprehensive modeling of the extensive spectral data set, e.g. by the abundance tomography method (Stehle et al., 2005), may eventually help to achieve a better understanding of the physics of SNe Ia explosions and their progenitors.
Acknowledgements.
This work is partly supported by the European Community’s Human Potential Program “The Physics of Type Ia Supernovae”, under contract HPRN-CT-2002-00303. V.S. and A.G. would like to thank the Göran Gustafsson Foundation for financial support. The work of D.Yu.T. and N.N.P. was partly supported by the grant RFBR 05-02-17480. The work of S.M. was supported by a EURYI scheme award. This work is based on observations collected at the Italian Telescopio Nazionale Galileo (TNG), Isaac Newton (INT) and William Herschel (WHT) Telescopes, and Nordic Optical Telescope (NOT), all located at the Spanish Observatorio del Roque de los Muchachos of the Instituto de Astrofisica de Canarias (La Palma, Spain), the 1.82m and 1.22m telescopes at Asiago (Italy), the 2.2m and 3.5m telescopes at Calar Alto (Spain), the United Kingdom Infrared Telescope (UKIRT) at Hawaii and the 60-cm telescope of the Beijing Astronomical Observatory (China). We thank the support astronomers of these telescopes for performing part of the observations. We also thank the director of the Calar Alto Observatory Roland Gredel for allocating additional time at the 2.2m telescope in May 2003. We thank all observers that gave up part of their time to observe SN 2003du. Thomas Augusteijn and Amanda Djupvik are acknowledged for observing during two technical nights at the NOT. Observations were also obtained at the NOT during a student training course in Observational Astronomy provided by Stockholm Observatory and the NorFA Summer School in Observational Astronomy. We thank Geir Oye for excellent support and close collaboration during this course. We also thank O.A.Burkhanov, S.Yu.Shugarov and I.M.Volkov for carrying out observations at Maidanak, Slovakia, Moscow and Crimea. We thank Cecilia Kozma for making available to us her late-time light curve models. We thank Aaron Barth for providing us with the spectra of SN 1994D collected by the Alexei Filippenko group at UC Berkeley, and the people who did the observations: Aaron Barth, Alexei Filippenko, Tomas Matheson, Xiaoming Fan, Michael Gregg, Vesa Junkkarinen, Brian Espey, Matt Lehnert, Lee Armus, Graeme Smith, Greg Wirth, David Koo, Abe Oren and Vince Virgilio. We thank K. Motohara and the co-authors of Motohara et al. (2006) for providing us with the unpublished late-time NIR magnitudes of SN 2003du. This work has made use of the NASA/IPAC Extragalactic Database (NED), the Lyon-Meudon Extragalactic Database (LEDA), NASA’s Astrophysics Data System, the SIMBAD database operated at CDS, Strasbourg, France, data products from the Two Micron All Sky Survey and the SUSPECT supernova spectral archive.References
- Alard (2000) Alard, C. 2000, A&AS, 144, 363
- Alard & Lupton (1998) Alard, C. & Lupton, R. H. 1998, ApJ, 503, 325
- Anupama et al. (2005) Anupama, G. C., Sahu, D. K., & Jose, J. 2005, A&A, 429, 667
- Astier et al. (2006) Astier, P., Guy, J., Regnault, N., et al. 2006, A&A, 447, 31
- Benetti et al. (2005) Benetti, S., Cappellaro, E., Mazzali, P. A., et al. 2005, ApJ, 623, 1011
- Benetti et al. (2004) Benetti, S., Meikle, P., Stehle, M., et al. 2004, MNRAS, 348, 261
- Bessell (1990) Bessell, M. S. 1990, PASP, 102, 1181
- Bessell (1995) Bessell, M. S. 1995, PASP, 107, 672
- Bessell et al. (1998) Bessell, M. S., Castelli, F., & Plez, B. 1998, A&A, 333, 231
- Branch et al. (2003) Branch, D., Garnavich, P., Matheson, T., et al. 2003, AJ, 126, 1489
- Branch et al. (1983) Branch, D., Lacy, C. H., McCall, M. L., et al. 1983, ApJ, 270, 123
- Branch & Tammann (1992) Branch, D. & Tammann, G. A. 1992, ARA&A, 30, 359
- Branch et al. (2004) Branch, D., Thomas, R. C., Baron, E., et al. 2004, ApJ, 606, 413
- Cappellaro et al. (1997) Cappellaro, E., Mazzali, P. A., Benetti, S., et al. 1997, A&A, 328, 203
- Colgate et al. (1980) Colgate, S. A., Petschek, A. G., & Kriese, J. T. 1980, ApJ, 237, L81
- Elias-Rosa et al. (2006) Elias-Rosa, N., Benetti, S., Cappellaro, E., et al. 2006, MNRAS, 369, 1880
- Filippenko (1982) Filippenko, A. V. 1982, PASP, 94, 715
- Filippenko (1997) Filippenko, A. V. 1997, ARA&A, 35, 309
- Garavini et al. (2005) Garavini, G., Aldering, G., Amadon, A., et al. 2005, AJ, 130, 2278
- Garavini et al. (2004) Garavini, G., Folatelli, G., Goobar, A., et al. 2004, AJ, 128, 387
- Garavini et al. (2007) Garavini, G., Nobili, S., Taubenberger, S., et al. 2007, ArXiv Astrophysics e-prints
- Gerardy et al. (2004) Gerardy, C. L., Höflich, P., Fesen, R. A., et al. 2004, ApJ, 607, 391
- Hamuy et al. (2002) Hamuy, M., Maza, J., Pinto, P. A., et al. 2002, AJ, 124, 417
- Hamuy et al. (1995) Hamuy, M., Phillips, M. M., Maza, J., et al. 1995, AJ, 109, 1
- Hamuy et al. (1996) Hamuy, M., Phillips, M. M., Suntzeff, N. B., et al. 1996, AJ, 112, 2391
- Harris et al. (1981) Harris, W. E., Fitzgerald, M. P., & Reed, B. C. 1981, PASP, 93, 507
- Hernandez et al. (2000) Hernandez, M., Meikle, W. P. S., Aparicio, A., et al. 2000, MNRAS, 319, 223
- Hillebrandt & Niemeyer (2000) Hillebrandt, W. & Niemeyer, J. C. 2000, ARA&A, 38, 191
- Hoeflich et al. (1998) Hoeflich, P., Wheeler, J. C., & Thielemann, F. K. 1998, ApJ, 495, 617
- Holschneider et al. (1989) Holschneider, M., Kronland-Martinet, R., Morlet, J., & Tchamitchian, P. 1989, in Wavelets. Time-Frequency Methods and Phase Space, ed. J.-M. Combes, A. Grossmann, & P. Tchamitchian, 286
- Horne (1986) Horne, K. 1986, PASP, 98, 609
- Hunt et al. (1998) Hunt, L. K., Mannucci, F., Testi, L., et al. 1998, AJ, 115, 2594
- Iwamoto et al. (2000) Iwamoto, K., Nakamura, T., Nomoto, K., et al. 2000, ApJ, 534, 660
- Jeffery et al. (1992) Jeffery, D. J., Leibundgut, B., Kirshner, R. P., et al. 1992, ApJ, 397, 304
- Jha et al. (1999) Jha, S., Garnavich, P. M., Kirshner, R. P., et al. 1999, ApJS, 125, 73
- Jha et al. (2006a) Jha, S., Kirshner, R. P., Challis, P., et al. 2006a, AJ, 131, 527
- Jha et al. (2006b) Jha, S., Riess, A. G., & Kirshner, R. P. 2006b, ArXiv Astrophysics e-prints
- Karp et al. (1977) Karp, A. H., Lasher, G., Chan, K. L., & Salpeter, E. E. 1977, ApJ, 214, 161
- Kasen et al. (2003) Kasen, D., Nugent, P., Wang, L., et al. 2003, ApJ, 593, 788
- Kasen & Plewa (2005) Kasen, D. & Plewa, T. 2005, ApJ, 622, L41
- Kasen & Woosley (2007) Kasen, D. & Woosley, S. E. 2007, ApJ, 656, 661
- Khokhlov et al. (1993) Khokhlov, A., Mueller, E., & Hoeflich, P. 1993, A&A, 270, 223
- Khokhlov (1991) Khokhlov, A. M. 1991, A&A, 245, 114
- Kirshner et al. (1993) Kirshner, R. P., Jeffery, D. J., Leibundgut, B., et al. 1993, ApJ, 415, 589
- Knop et al. (2003) Knop, R. A., Aldering, G., Amanullah, R., et al. 2003, ApJ, 598, 102
- Kotak et al. (2005) Kotak, R., Meikle, W. P. S., Pignata, G., et al. 2005, A&A, 436, 1021
- Kotak et al. (2003) Kotak, R., Meikle, W. P. S., & Rodriguez-Gil, P. 2003, IAU Circ., 8122, 3
- Krisciunas et al. (2007) Krisciunas, K., Garnavich, P. M., Stanishev, V., et al. 2007, AJ, 133, 58
- Krisciunas et al. (2000) Krisciunas, K., Hastings, N. C., Loomis, K., et al. 2000, ApJ, 539, 658
- Krisciunas et al. (2001) Krisciunas, K., Phillips, M. M., Stubbs, C., et al. 2001, AJ, 122, 1616
- Krisciunas et al. (2004a) Krisciunas, K., Phillips, M. M., & Suntzeff, N. B. 2004a, ApJ, 602, L81
- Krisciunas et al. (2004b) Krisciunas, K., Phillips, M. M., Suntzeff, N. B., et al. 2004b, AJ, 127, 1664
- Krisciunas et al. (2003) Krisciunas, K., Suntzeff, N. B., Candia, P., et al. 2003, AJ, 125, 166
- Krisciunas et al. (2004c) Krisciunas, K., Suntzeff, N. B., Phillips, M. M., et al. 2004c, AJ, 128, 3034
- Lair et al. (2006) Lair, J. C., Leising, M. D., Milne, P. A., & Williams, G. G. 2006, AJ, 132, 2024
- Landolt (1992) Landolt, A. U. 1992, AJ, 104, 340
- Leibundgut et al. (1991) Leibundgut, B., Kirshner, R. P., Filippenko, A. V., et al. 1991, ApJ, 371, L23
- Lentz et al. (2000) Lentz, E. J., Baron, E., Branch, D., Hauschildt, P. H., & Nugent, P. E. 2000, ApJ, 530, 966
- Leonard et al. (2005) Leonard, D. C., Li, W., Filippenko, A. V., Foley, R. J., & Chornock, R. 2005, ApJ, 632, 450
- Majewski et al. (1994) Majewski, S. R., Kron, R. G., Koo, D. C., & Bershady, M. A. 1994, PASP, 106, 1258
- Marion et al. (2003) Marion, G. H., Höflich, P., Vacca, W. D., & Wheeler, J. C. 2003, ApJ, 591, 316
- Marion et al. (2006) Marion, G. H., Höflich, P., Wheeler, J. C., et al. 2006, ApJ, 645, 1392
- Mattila et al. (2005) Mattila, S., Lundqvist, P., Sollerman, J., et al. 2005, A&A, 443, 649
- Mazzali (2001) Mazzali, P. A. 2001, MNRAS, 321, 341
- Mazzali et al. (2005a) Mazzali, P. A., Benetti, S., Altavilla, G., et al. 2005a, ApJ, 623, L37
- Mazzali et al. (2005b) Mazzali, P. A., Benetti, S., Stehle, M., et al. 2005b, MNRAS, 357, 200
- Mazzali et al. (2000) Mazzali, P. A., Iwamoto, K., & Nomoto, K. 2000, ApJ, 545, 407
- Mazzali & Lucy (1998) Mazzali, P. A. & Lucy, L. B. 1998, MNRAS, 295, 428
- Mazzali et al. (2001) Mazzali, P. A., Nomoto, K., Cappellaro, E., et al. 2001, ApJ, 547, 988
- Mazzali & Podsiadlowski (2006) Mazzali, P. A. & Podsiadlowski, P. 2006, MNRAS, 369, L19
- Meikle (2000) Meikle, W. P. S. 2000, MNRAS, 314, 782
- Meikle et al. (1996) Meikle, W. P. S., Cumming, R. J., Geballe, T. R., et al. 1996, MNRAS, 281, 263
- Milne et al. (1999) Milne, P. A., The, L.-S., & Leising, M. D. 1999, ApJS, 124, 503
- Motohara et al. (2006) Motohara, K., Maeda, K., Gerardy, C. L., et al. 2006, ApJ, 652, L101
- Nobili et al. (2003) Nobili, S., Goobar, A., Knop, R., & Nugent, P. 2003, A&A, 404, 901
- Nomoto et al. (1984) Nomoto, K., Thielemann, F.-K., & Yokoi, K. 1984, ApJ, 286, 644
- Nugent et al. (1997) Nugent, P., Baron, E., Branch, D., Fisher, A., & Hauschildt, P. H. 1997, ApJ, 485, 812
- Nugent et al. (2002) Nugent, P., Kim, A., & Perlmutter, S. 2002, PASP, 114, 803
- Nugent et al. (1995) Nugent, P., Phillips, M., Baron, E., Branch, D., & Hauschildt, P. 1995, ApJ, 455, L147+
- Pastorello et al. (2007a) Pastorello, A., Mazzali, P. A., Pignata, G., et al. 2007a, ArXiv Astrophysics e-prints
- Pastorello et al. (2007b) Pastorello, A., Taubenberger, S., Elias-Rosa, N., et al. 2007b, MNRAS, 161
- Patat et al. (1996) Patat, F., Benetti, S., Cappellaro, E., et al. 1996, MNRAS, 278, 111
- Pauldrach et al. (1996) Pauldrach, A. W. A., Duschinger, M., Mazzali, P. A., et al. 1996, A&A, 312, 525
- Peebles & Ratra (2003) Peebles, P. J. & Ratra, B. 2003, Reviews of Modern Physics, 75, 559
- Perlmutter et al. (1999) Perlmutter, S., Aldering, G., Goldhaber, G., et al. 1999, ApJ, 517, 565
- Phillips (1993) Phillips, M. M. 1993, ApJ, 413, L105
- Phillips et al. (1999) Phillips, M. M., Lira, P., Suntzeff, N. B., et al. 1999, AJ, 118, 1766
- Pignata et al. (2005) Pignata, G., Benetti, S., Buson, L., et al. 2005, in ASP Conf. Ser. 342: 1604-2004: Supernovae as Cosmological Lighthouses, ed. M. Turatto, S. Benetti, L. Zampieri, & W. Shea, 266
- Pignata et al. (2004) Pignata, G., Patat, F., Benetti, S., et al. 2004, MNRAS, 355, 178
- Pinto & Eastman (2000) Pinto, P. A. & Eastman, R. G. 2000, ApJ, 530, 757
- Plewa et al. (2004) Plewa, T., Calder, A. C., & Lamb, D. Q. 2004, ApJ, 612, L37
- Prieto et al. (2006) Prieto, J. L., Rest, A., & Suntzeff, N. B. 2006, ApJ, 647, 501
- Pskovskii (1977) Pskovskii, I. P. 1977, Soviet Astronomy, 21, 675
- Quimby et al. (2006) Quimby, R., Höflich, P., Kannappan, S. J., et al. 2006, ApJ, 636, 400
- Riess et al. (1998) Riess, A. G., Filippenko, A. V., Challis, P., et al. 1998, AJ, 116, 1009
- Riess et al. (2005) Riess, A. G., Li, W., Stetson, P. B., et al. 2005, ApJ, 627, 579
- Riess et al. (1995) Riess, A. G., Press, W. H., & Kirshner, R. P. 1995, ApJ, 445, L91
- Riess et al. (2007) Riess, A. G., Strolger, L.-G., Casertano, S., et al. 2007, ApJ, 659, 98
- Riess et al. (2004) Riess, A. G., Strolger, L.-G., Tonry, J., et al. 2004, ApJ, 607, 665
- Röpke et al. (2006) Röpke, F. K., Gieseler, M., Reinecke, M., Travaglio, C., & Hillebrandt, W. 2006, A&A, 453, 203
- Röpke & Hillebrandt (2004) Röpke, F. K. & Hillebrandt, W. 2004, A&A, 420, L1
- Rudy et al. (2002) Rudy, R. J., Lynch, D. K., Mazuk, S., et al. 2002, ApJ, 565, 413
- Ruiz-Lapuente & Spruit (1998) Ruiz-Lapuente, P. & Spruit, H. C. 1998, ApJ, 500, 360
- Salvo et al. (2001) Salvo, M. E., Cappellaro, E., Mazzali, P. A., et al. 2001, MNRAS, 321, 254
- Schlegel et al. (1998) Schlegel, D. J., Finkbeiner, D. P., & Davis, M. 1998, ApJ, 500, 525
- Schwartz & Holvorcem (2003) Schwartz, M. & Holvorcem, P. R. 2003, IAU Circ., 8121, 1
- Sollerman et al. (2004) Sollerman, J., Lindahl, J., Kozma, C., et al. 2004, A&A, 428, 555
- Spyromilio et al. (2004) Spyromilio, J., Gilmozzi, R., Sollerman, J., et al. 2004, A&A, 426, 547
- Stehle et al. (2005) Stehle, M., Mazzali, P. A., Benetti, S., & Hillebrandt, W. 2005, MNRAS, 360, 1231
- Stetson (2000) Stetson, P. B. 2000, PASP, 112, 925
- Stritzinger et al. (2002) Stritzinger, M., Hamuy, M., Suntzeff, N. B., et al. 2002, AJ, 124, 2100
- Stritzinger & Leibundgut (2005) Stritzinger, M. & Leibundgut, B. 2005, A&A, 431
- Stritzinger et al. (2006) Stritzinger, M., Mazzali, P. A., Sollerman, J., & Benetti, S. 2006, A&A, 460, 793
- Stritzinger et al. (2005) Stritzinger, M., Suntzeff, N. B., Hamuy, M., et al. 2005, PASP, 117, 810
- Suntzeff (1996) Suntzeff, N. B. 1996, in IAU Colloq. 145: Supernovae and Supernova Remnants, ed. R. McCray & Z. Wang, 41
- Suntzeff (2000) Suntzeff, N. B. 2000, in American Institute of Physics Conference Series, ed. S. S. Holt & W. W. Zhang, 65–74
- Thomas et al. (2004) Thomas, R. C., Branch, D., Baron, E., et al. 2004, ApJ, 601, 1019
- Timmes et al. (2003) Timmes, F. X., Brown, E. F., & Truran, J. W. 2003, ApJ, 590, L83
- Tokunaga et al. (2002) Tokunaga, A. T., Simons, D. A., & Vacca, W. D. 2002, PASP, 114, 180
- Umeda et al. (1999) Umeda, H., Nomoto, K., Kobayashi, C., Hachisu, I., & Kato, M. 1999, ApJ, 522, L43
- van Dokkum (2001) van Dokkum, P. G. 2001, PASP, 113, 1420
- Wade & Horne (1988) Wade, R. A. & Horne, K. 1988, ApJ, 324, 411
- Wang et al. (2003a) Wang, L., Baade, D., Höflich, P., et al. 2003a, ApJ, 591, 1110
- Wang et al. (2006) Wang, L., Baade, D., Höflich, P., et al. 2006, ApJ, 653, 490
- Wang et al. (2007) Wang, L., Baade, D., & Patat, F. 2007, Science, 315, 212
- Wang et al. (2003b) Wang, L., Goldhaber, G., Aldering, G., & Perlmutter, S. 2003b, ApJ, 590, 944
- Wells et al. (1994) Wells, L. A., Phillips, M. M., Suntzeff, B., et al. 1994, AJ, 108, 2233
- Wheeler et al. (1998) Wheeler, J. C., Hoeflich, P., Harkness, R. P., & Spyromilio, J. 1998, ApJ, 496, 908
- Wood-Vasey et al. (2007) Wood-Vasey, W. M., Miknaitis, G., Stubbs, C. W., et al. 2007, ArXiv Astrophysics e-prints
Appendix A S-corrections
A.1 Photometric systems responses
The most important ingredient for computing S-corrections is the accurate knowledge of the object SED and the response of the instruments used. Pignata et al. (2004) have calculated the responses of most of the instruments used by the ESC. However, we repeated the process for the 5 instruments most frequently used to observe SN 2003du: AFOSC at Asiago 1.82m telescope, DOLORES at TNG, ALFOSC at NOT, CAFOS at Calar Alto 2.2m telescope and BAO 60-cm telescope imager, using the new extensive spectrophotometry of Landolt stars in Stritzinger et al. (2005). The first four of the five instruments are combined spectrographs/imagers with design that allows the grisms, the slits and the imaging filters to be inserted into the light beam simultaneously. This made possible to measure the filter transmissions in situ as the filters are mounted in the instrument and used during the photometric observations. This measurement is straightforward and consists of taking spectral flat-fields with and without the filter in the beam. The flat taken with the filter is divided by the one taken without, giving the filter transmission. Before doing this, the bias and any reflected light present was carefully removed. The latter can be important in the blue part of the spectrum where the sensitivity of the system is low and the scattered light can be a significant fraction of the useful signal; this can affect the measured transmission. The wavelength calibration was done with arc-lamp spectra taken without the filter in the beam. When filters are introduced in the beam small shifts of the wavelength solution can be expected. After the measurements we checked this for few filters at AFOSC at Asiago 1.8m telescope and did indeed find shifts of a few pixels. Hence, the measured filter transmissions might be shifted by up to 20–30 Å, but the shape is accurately determined. Generally, we found good agreement with the filter transmissions available from the instrument web-pages. However, we found significant discrepancies for the Calar Alto 2.2m + CAFOS and filters, and minor differences for the TNG+DOLORS -band. For the -bands we used the transmissions available from the instrument web-pages. For the BAO 60-cm telescope the filter transmissions specified by the manufacturer were used.

The total system responses were computed by multiplying the filter transmissions by (a) the CCD quantum efficiency (QE), (b) the reflectivity of at least two aluminum surfaces, (c) the continuum transmission of the Earth atmosphere at airmass one (the extinction laws were provided by the observatories), and (d) a telluric absorption spectrum, which we derived from the spectrophotometric standards observed at WHT close to airmass one. The lens and window transmissions were not included because this information was unavailable. Synthetic magnitudes were calculated from Stritzinger et al. (2005) spectrophotometry of Landolt standard stars, . The difference between the synthetic and the observed photometry was fitted as a function of the observed color indices to compute synthetic color-terms (), e.g. for we have
| (3) |
For the -bands, the ’s were close to the observed ones . In some cases small differences exceeding the uncertainty were accounted for by shifting the filter transmissions until matched . Small shifts of up to Å were required. These discrepancies could easily have arisen from the way in which the transmissions were determined, as discussed above. For the and -bands however, we found large differences which would have required an unacceptably large shift to correct for them. The synthetic and bands were always too blue. This is, to some extent, to be expected because the neglected optical elements like lenses or windows, anti-reflection and other coatings will tend to reduce the system sensitivity shortward of 4000 Å. The uncertainty in the CCD QEs and the extinction laws may also contribute to this effect. To account for the net effect of these uncertainties we modified the and bands by multiplying them with a smooth monotonic function of wavelength so that matched . We used the Sigmoid function
| (4) |
that changes smoothly from 0 to 1. The parameters and control the position and the width of the transition; for small the Sigmoid function approaches a Heaviside step function at . We proceeded as follows: and were varied in the wavelength intervals 3200–4200 Å and 100–500 Å, respectively, and the set of parameters that brought the synthetic and -band color-terms into accord with the observed ones was chosen. Note that independent modification of and results in degeneracy in the (,) parameter space, and it was only when the and -bands were considered together that an unique solution for and could be obtained. As standard Johnson-Cousins system responses we use the Bessell (1990) filters but following Stritzinger et al. (2005) we first modified them so that they could be used with photon fluxes and included the telluric absorptions. Small shifts were also applied to account for the small color-terms that are noticeable when compared with the Landolt photometry. Bessell (1995) suggested correcting Landolt photometry to bring it into the original Cousins system. The synthetic photometry with the original Bessell filters does match the corrected magnitudes. However, for sake of comparability with the existing SN photometry, we use the original Landolt photometry and modify the Bessell filters so that the synthetic color-terms are zero. The constant terms derived from the fits with Eq. 3 are the filter zero-points for synthetic photometry. The constant in Eq. 2 is the difference between the zero-point for the Bessell and natural passbands.
The reconstructed bands are shown in Fig. 16 together with the modified Bessell filters, demonstrating the variety of passbands one may encounter at different telescopes. Note particularly the non-standard form of the Calar Alto -band and NOT -band. We note that the reconstructed responses should be regarded only as approximations of the real responses. A given passband can be modified in many ways to match the observed and the synthetic color-term, and we would consider the procedure we used as the most appropriate one given the available information. We also note that fitting the -band synthetic color-term is ambiguous. Because of the Balmer discontinuity even small deviation from the Bessell passband changes such that it needs no longer be a simple linear function of . This also affects the derivation of the observed color-terms and as a result the -band photometry should be in general considered significantly less accurate than other bands.
A.2 Computing the S-corrections
We used our spectra obtained earlier than 110 days after maximum, and spectra from Gerardy et al. (2004) and Anupama et al. (2005) to compute the S-corrections and to transform the photometry of SN 2003du into the Johnson-Cousins system. The TNG, Calar Alto and BAO -bands extend out to 1.1 m and to compute the S-corrections, we also used our NIR spectra of SN 2003du (Sec. 2.3). To compute the BAO -band S-corrections between and days we also used NIR spectra of SN 1999ee (Hamuy et al., 2002) and SN 2000ca (Stanishev et al., in preparation) taken at days. The -band could not be S-corrected because no UV spectra of SN 2003du were available.
The relative spectrophotometry of SN 2003du was not always sufficiently accurate for the purpose of computing S-corrections. It was thus necessary to slightly modify some of the spectra so that the synthetic photometry with the modified Bessell bands matched the observed one. To achieve that, the spectra were multiplied by a smooth correction function determined by fitting the ratio between the observed and the synthetic fluxes. When the ratio varied monotonically with wavelength, a second-order polynomial was used. When a more complex function was required, a spline fit was used. At the first iteration the synthetic magnitudes were compared with the linear color-term corrected magnitudes of SN 2003du, and the spectra were only modified if the observed and the synthetic color indices differed by more than 0.05 mag for and , and 0.1 mag for . These corrected spectra were used to compute S-corrected photometry of SN 2003du. The flux correction of the spectra was then repeated using the S-corrected rather than the color-term corrected photometry. Spectra were only corrected if the color discrepancies were greater than 0.03 mag for and , or 0.05 mag for . New S-corrected photometry was then computed and the process repeated to obtain the final S-corrected photometry and calibrated spectra. A number of spectra have a wavelength coverage that only allows and synthetic magnitudes to be computed. In these cases, only a simple linear correction was applied to match the observed and magnitudes.
We note that because the instrumental responses are fairly close to those of Bessell filters, the S-corrections are almost entirely determined by the SN spectral features and are practically insensitive to small changes of the SN colors. It was found that the initial correction of the spectra yielded spectrophotometry which was already accurate to a few per cent and that the subsequent iterations had very little effect on the final calibrated photometry. We therefore conclude that the few percent uncertainties in the spectrophotometry, which might have arisen from the way the spectra were corrected, should have little effect on the final photometry.