The electronic structures, the equilibrium geometries and finite temperature properties of Nan (=39-55)
Abstract
Density-functional theory has been applied to investigate systematics of sodium clusters Nan in the size range of = 39-55. A clear evolutionary trend in the growth of their ground-state geometries emerges. The clusters at the beginning of the series (=39-43) are symmetric and have partial icosahedral (two-shell) structure. The growth then goes through a series of disordered clusters (=44-52) where the icosahedral core is lost. However, for 53 a three shell icosahedral structure emerges. This change in the nature of the geometry is abrupt. In addition, density-functional molecular dynamics has been used to calculate the specific heat curves for the representative sizes = 43, 45, 48 and 52. These results along with already available thermodynamic calculations for = 40, 50, and 55 enable us to carry out a detailed comparison of the heat capacity curves with their respective geometries for the entire series. Our results clearly bring out strong correlation between the evolution of the geometries and the nature of the shape of the heat capacities. The results also firmly establish the size-sensitive nature of the heat capacities in sodium clusters.
pacs:
31.15.Ew, 31.15.Qg, 36.40.Ei, 36.40.QvI Introduction
Physics and chemistry of clusters are very active areas of research especially because of the emergence of nano science and nano technology. nano Although major efforts have been spent into ground-state investigations, finite temperature properties are turning out to be very interesting. Such investigations are challenging, both experimentally as well as theoretically. One of the first detailed measurements providing much impetus for theoretical work was on free sodium clusters by Haberland and co-workers. Haberland These measurements reported the melting temperatures (Tm) of sodium clusters in the size range between 55 and 350 and remained unexplained for almost about a decade.
The main puzzle was related to the irregular behavior of the melting temperature and the absence of any correlation between the peaks and the magic numbers either geometric or electronic. A good deal of simulation works has been carried out to explain the sodium data, most of the early work being with classical inter atomic potentials. Calvo ; Li It turned out that none of these could obtain qualitative and quantitative agreement with the experimental data. Thus, it needed an ab initio density-functional method to achieve this. Indeed, much insight and excellent quantitative agreement has been obtained by density-functional molecular dynamics (DFMD) simulations. Manninan ; Chacko ; Lee-small-sodium ; Lee-58 ; Aguado ; Aguado30
Recently a very different aspect of finite temperature behavior has been brought out by the experimental and later by theoretical work on gallium clusters. Jarrold-Ga ; Kavita The experimental reports of Breaux and co-workers Jarrold-Ga showed that in the size range of =30 to 55, free clusters of gallium melt much above their bulk melting temperature. Interestingly, their experiment also showed that the nature of heat capacity is size sensitive. In fact, addition of even one atom changes the shape of the heat capacity dramatically, e.g for Ga30 and Ga31. A similar experimental observation has been reported for aluminum clusters in the size range =49-62. Jarrold-Al Such a size sensitive behavior has also been observed in DFMD simulation of Au19 and Au20. Au19-20 A detailed analysis of the ground-state geometries of these clusters brought out the role of order and disorder in their geometries on the shape of the melting curve. A disordered system is shown to display a continuous melting transition leading to a very broad heat capacity curve. However, the effect is subtle and description of order and disorder needs careful qualifications.
In spite of substantial experimental works on sodium clusters over a period of 10 years and or so, there is no firm and systematic evidence of size sensitivity. This is mainly due to the fact that the reported experimental data Haberland is for the size range of =55-350 at discrete sizes. It is necessary to investigate the effect of addition of few atoms in a continuous manner in appropriate size range. However, it is not clear whether larger clusters having sizes of 100 will also show this effect.
An extensive ab initio study on the structural properties of small Na clusters up to =20 has been reported by Röthlisberger and Andreoni. Rothlisberger The study reveals that pentagonal motifs dominate the structures above =7. As expected most of the atoms in these clusters lie on the surface and a discernible core develops after about =15-16. The shapes after this sizes show signature of icosahedral structures.
The finite temperature behavior of sodium clusters in the size range of =8 to 55 has been reported. Lee-small-sodium The study reveals that it is not easy to discern any melting peaks below =25. However, the simulation data available at rather coarse sizes above =40 already shows size-sensitive feature. In addition to this feature, our recent investigation Lee-58 on Na57 and Na58 does bring out the role of geometry and electronic structure on the melting. Nevertheless, in order to draw definitive conclusions it is necessary to investigate the effect of addition of a few atoms in a continuous manner in appropriate size range. Therefore, we have chosen the size range of =39-55 and have carried out detailed density-functional investigations. The purpose of the present work is two fold. First, to obtain reliable equilibrium geometries for all the clusters in the size range of =39-55 and to discern evolutionary trends. We note that Na40 has a symmetric partially icosahedron core and Na55 is a complete icosahedron. Thus it is of considerable interest to examine the growth pattern from =39 to =55. The second purpose is to seek correlation between the nature of the ground-state and the evolutionary trends observed in the nature of their specific heats. Towards this end we have carried out extensive finite temperature simulations on representative clusters of size = 43, 45, 48, and 52. Together with the already published results, this gives us access to specific heats for Na40, Na43, Na45, Na48, Na50, Na52 and Na55, a reasonable representation across the series under investigation. Finally, we note that all the DFMD simulations reported so far have yielded excellent agreement with the experimental data Aguado ; Chacko ; Lee-58 These reports demonstrate the reliability of density-functional molecular dynamics in describing the finite temperature properties.
The plan of the paper is as follows. In the next section (Sec. II) we note the computational details. Sec. III presents equilibrium geometries and their shape systematic. Sec. IV presents the finite temperatures behavior of Na43, Na45, Na48, Na52 and finally we discuss the correlation between the ground states and nature of the specific heats for all the available thermodynamics data. We conclude our discussion in Sec. V.
II Computational Details
We have carried out Born-Oppenheimer molecular dynamics (BOMD) simulations MD using Vanderbilt’s ultrasoft pseudopotentials vanderbilt within the local-density approximation (LDA), as implemented in the VASP package. VASP We have optimized about 300 geometries for each of the sodium clusters in the size range between =39 and =55. The initial configuration for the optimization of each cluster were obtained by carrying out a constant temperature dynamics simulation of 60 ps each at various temperatures between 300 to 400 K. For many of the geometries we have also employed basin hopping Basin and genetic genetic1 ; genetic2 algorithms using Gupta potential Li for generating initial guesses. Then we optimized these structures by using the ab initio density-functional method. ab initio For computing the heat capacities, the iso-kinetic BOMD calculations were carried out at 14 different temperatures for each cluster of Na43, Na45, Na48, Na52 in the range between 100 K and 460 K, each with the time duration of 180 ps or more. Thus, it results in the total simulation time of 2.5 ns per system. In order to get converged heat capacity curve especially in the region of co-existence, more temperatures were required with longer simulation times. We have discarded at least first 30 ps for each temperature for thermalization. To analyze the thermodynamic properties, we first calculate the ionic specific heat by using the Multiple Histogram (MH) technique. Mh1 ; Mh2 We extract the classical ionic density of states () of the system, or equivalently the classical ionic entropy, , following the MH technique. With in hand, one can evaluate thermodynamic averages in a variety of ensembles. We focus in this work on the ionic specific heat. In the canonical ensemble, the specific heat is defined as usual by , where is the average total energy. The probability of observing an energy at a temperature is given by the Gibbs distribution , with the normalizing canonical partition function. We normalize the calculated canonical specific heat by the zero-temperature classical limit of the rotational plus vibrational specific heat, i.e., . Abhijat
We have calculated a number of thermodynamic indicators such as root-mean-square bond length fluctuations (), mean square displacements (MSD) and radial distribution function (g(r)). The is defined as
| (1) |
where is the number of atoms in the system, is the distance between atoms and , and denotes a time average over the entire trajectory. MSDs for individual atoms is another traditional parameter used for determining phase transition and is defined as,
| (2) |
where RI is the position of the th atom and we average over M different time origins t0m spanning over the entire trajectory. The interval between the consecutive t0m for the average was taken to be about 1.5 ps. The MSDs of a cluster indicate the displacement of atoms in the cluster as a function of time. The g(r) is defined as the average number of atoms within the region and .
We have also calculated the shape deformation parameter (), to analyze the shape of the ground state for all the clusters. The is defined as,
| (3) |
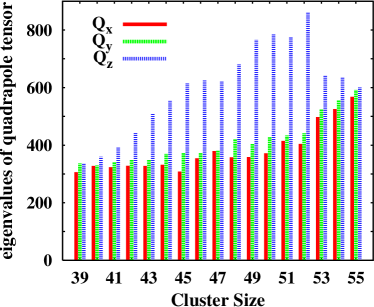
where are the eigenvalues, in descending order, of the quadrupole tensor
| (4) |
Here and run from 1 to 3, runs over the number of ions, and is the ith coordinate of ion relative to the center of mass (COM) of the cluster. A spherical system () has =1 and larger values of indicates deviation of the shape of the cluster from sphericity.
III Geometries
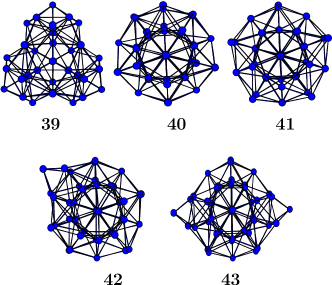
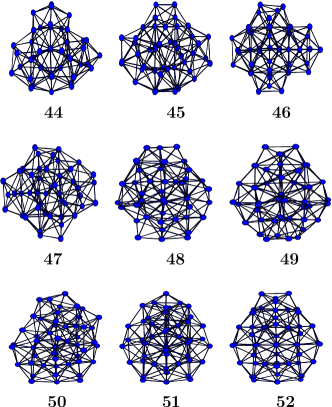
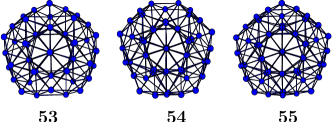
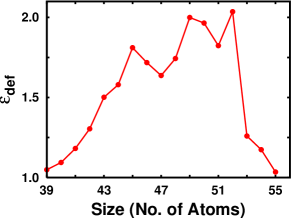
The lowest energy geometries of sodium clusters (Nan =39-55) are shown in Fig. 1 (=39-43), Fig. 2 (=44-52), and Fig. 3 (=53-55). We have also plotted the shape deformation parameter and the eigenvalues of quadrupole tensor for the ground state geometries of these clusters in Fig. 4 and Fig. 5, respectively.

It is convenient to divide these clusters into three groups. The clusters in the first group, shown in Fig. 1 are nearly spherical. The ground-state geometry for Na39 is highly symmetric. This structure has three identical units, each based on the icosahedral motive and these three units are arranged as shown in the Fig. 1. It is interesting to note that an addition of an extra atom changes the structure dramatically. It can be seen that the geometry of Na40 is based on icosahedral structure with missing 12 corner atoms and (111) facet as reported by Rytkönen et al . Manninan An extra atom added to this structure is accommodated near the surface and deforms the structure slightly. In addition to the deformation the distance between the two shells is reduced by 0.3 Å as compared to that in Na40. A single atom added to Na41 is not accommodated in the structure, instead it caps the surface. However, the low-lying geometries for Na42 have a spherical shape without any cap (figure not shown). The lowest-energy structure of Na43 shows two caps symmetrically placed on the opposite side of Na41, accompanied by distortion of the icosahedral core. The second group in Fig. 2 consisting of the clusters with =44-52 shows substantial distortion of the icosahedral core and even loss of this core structure. These clusters essentially represent the transition region from the two shell icosahedron, Na40 to three shell complete icosahedron, Na55. It can be seen that by adding one atom to Na43 the two shell core is destroyed. The growth from =44 to =52 shows successive stages of capping followed by rearrangement in the inner core. There is a dramatic change in the structure as soon as we add one more atom to Na52. All the atoms rearrange to form an icosahedral structure as seen in Na53. Thus, the clusters in the last group namely, Na53 and Na54 differ from a perfect icosahedron of Na55 by an absence of two and one atom(s), respectively (Fig. 3).
The nature of the changes in the shape of the clusters during the growth can be seen in Fig. 4 and Fig. 5. The shape deformation parameter () increases to a value about 2 up to Na52 with slightly higher values for Na45 and Na49 (Fig. 4). However, this value drops suddenly for Na53. It is interesting to examine the three eigenvalues of quadrupole tensor () shown in Fig. 5. It can be seen that two of the eigenvalues are nearly same up to Na52 while the third one continuously grows and indicates that the growth dominantly takes place along one of the directions. A prolate configuration has . Thus, the majority of the clusters in the second group are prolate. The formation, the destruction and reformation of the shell structure is clearly seen in Fig. 6. In this figure we have plotted the distance of each atom from the center of mass arranged in the increasing fashion. Clearly small rearrangement of atoms yields a change in the structure from Na39 to Na40. The two shell structures are observed till Na43. The formation of the shell structure is reflected in the formation of the sharp steps in the graph. As the size increases from Na43 to Na44 the shell structure is destroyed and seen again at Na53. Thus, three shells begin to emerge at Na53.
IV Thermodynamics
We have calculated the ionic heat capacity and indicators like mean square displacements (MSD) and root-mean-square bond length fluctuations () for four of the representative clusters in the investigated series which are Na43, Na45, Na48, and Na52.
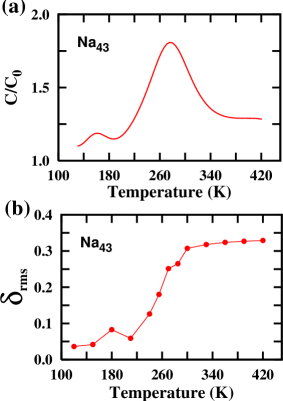

We note that the thermodynamics of Na40 Manninan ; Lee-small-sodium , Na50 Lee-small-sodium and Na55 Aguado ; Chacko has already been reported. Thus it is possible to examine and analyze the systematic variations in the melting characteristic and correlate them with the equilibrium geometries across the entire range of sizes from 40 to 55. The heat capacity and for Na43 are shown in Figs. 7(a) and 7(b), respectively. We also show typical low energy geometries (isomers) for Na43 in Fig. 8. The first isomer shown in Fig. 8(a) has two atoms closest to each other capping the surface and second isomer shows a distorted shape and no caps. The heat capacity shows a weak peak around 160 K while the main peak occurs at 270 K. An examination of the motion of ionic trajectory seen as a movie indicates that isomerization (Fig. 8(a)) is responsible for the weak peak.
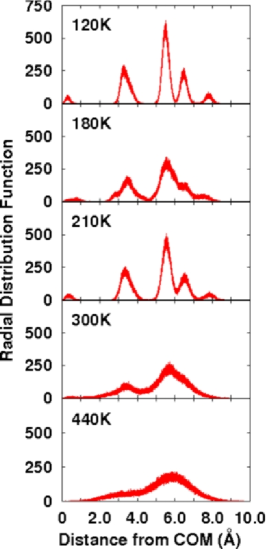
It is interesting to observe the changes of radial distribution function (RDF) as a function of temperature which is shown in Fig. 9. At low temperatures the shell structure is clearly evident. The pattern seen at 180 K and 210 K are mainly due to the fluctuation of the cluster between the ground-state and low-lying states. At 300 K and above the RDF shows the typical melting behavior of a cluster. The in Fig. 7(b) shows the effect of isomerization around 160 K. It can be seen that the melting region is of the order of 60 K.


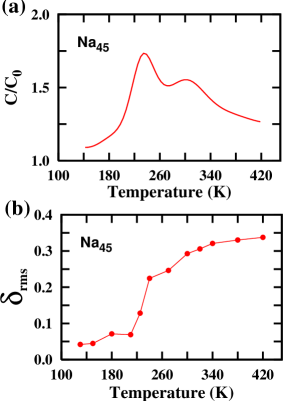
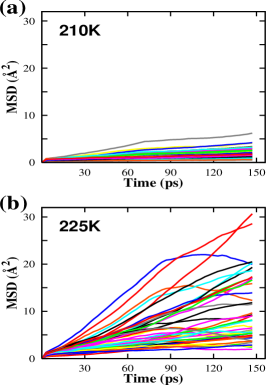
Let us recall that Na45, Na48 and Na52 belong to the second class of disordered clusters. Among these Na45 shows some signature of partial shells. The heat capacity and for Na45 are shown in Figs. 10(a) and 10(b), respectively. The heat capacity of Na45 shows a first peak around 230 K and a second peak around 300 K. We also show the MSDs of individual atoms at 210 and 225 K in Figs. 11(a) and 11(b), respectively. We have observed the ionic trajectories as a movie in the temperature at 225 K. It turns out that about one third of atoms in the cluster “melt” at this temperature. This is brought out by the contrasting behavior of the MSDs as shown in Figs. 11(a) and 11(b). Interestingly, all these 15 atoms are on the surface, indicating that surface melting takes place first. The peak around 225 K in the heat capacity is due to partial melting of these surface atoms. We show the as a function of the temperature in Fig. 10(b). There is a sharp increases in around 210 K and a slow rise after 240 K consistent with the behavior of the heat capacity. Thus in Na45 melting takes place in two stages over the range of 120 K.
The heat capacity and for Na48 and Na52 are shown in Fig. 12. The heat capacity of Na48 (Fig. 12(a)) is very broad indicating almost continuous phase change starting around 150 k. Thus it is difficult to identify a definite melting temperature. A similar behavior is also seen in that of Na52 except for the small peak seen 180 K due to isomerization (Fig. 12(c)). It is interesting to note that for both clusters also show a gradual rise from about 150 K to 350 K indicating a continuous melting transition as shown in Figs. 12(b) and 12(d).
The systematic evolution of heat capacities can be better appreciated by examination of all the available data (calculated from density-functional simulation). In Fig. 13 we show the specific heats for all the available clusters between Na40 and Na55. The most symmetric cluster Na55 shows the sharpest peak in the heat capacity. The heat capacity of Na40 and Na43 (partial icosahedral structures) have well recognizable peaks which are broader than that of Na55. The disordered phase of the growth is clearly reflected in the very broad heat capacities seen around =50.
V Summary and conclusion
The ab initio density-functional method has been applied to investigate systematic evolutionary trends in the ground state geometries of the sodium clusters in the size range of =39-55. The DFMD finite temperature simulations have been carried out for representative clusters. A detailed comparison between the heat capacities and the geometries firmly establishes a direct influence of the geometries on the shapes of the heat capacity curves. The heat capacities show size sensitivity. The growth pattern shows a transition from ordered disordered ordered sequence. The corresponding heat capacities show a transition from peaked to a very broad to peaked sequence. It is seen that addition of a few atoms changes the shape of heat capacity very significantly. We believe that the size sensitive feature seen our simulation is universal. It may be noted that such a feature has been observed experimentally in the case of gallium and aluminum and in the case of DFMD simulations for gold. We await the experimental measurements of the heat capacities on the sodium clusters in these range showing the size sensitivity.
VI Acknowledgment
We acknowledge partial assistance from the Indo-French center for Promotion of Advance Research (India)/ Center Franco-Indian pour la promotion de la Recherche Avancée (France) (IFC-PAR, project No; 3104-2). We would like to thank Kavita Joshi and Sailaja Krishnamurty for a number of useful discussions.
References
- (1) P. G. Reinhard, E. Suraud, Introduction to Cluster Dynamics (Wiley-VCH, Berlin, 2003)
- (2) M. Schmidt, R. Kusche, B. von. Issendorff, and H. Haberland, Nature (London) 393, 238 (1998); M. Schmidt and H. Haberland, C. R. Phys. 3, 327 (2002); H. Haberland, T. Hippler, J. Donges, O. Kostko, M. Schmidt and B. von Issendroff, Phys. Rev. Lett. 94, 035701 (2005)
- (3) F. Calvo and F. Spiegelmann, J. Chem. Phys. 112, 2888 (2000)
- (4) Y. Li, E. Blaisten-Barojas, and D. A. Papaconstantopoulos, Phys. Rev. B 57, 15519 (1998).
- (5) A. Rytkönen, H. Häkkinen, and M. Manninen, Phys. Rev. Lett. 80, 3940 (1998).
- (6) S. Chacko, D. G. Kanhere, and S. A. Blundell, Phys. Rev. B 71, 155407 (2005).
- (7) M.-S. Lee, S. Chacko, and D. G. Kanhere, J. Chem. Phys. 123, 164310 (2005).
- (8) M.-S. Lee and D. G. Kanhere, Phys. Rev. B 75, 125427 (2007).
- (9) A. Aguado and J. M. López, Phys. Rev. Lett. 94, 233401 (2005).
- (10) A. Aguado and J. M. López, Phys. Rev. B 74, 115403 (2006).
- (11) G. A. Breaux, D. A. Hillman, C. M. Neal, R. C. Benirschke, and M. F. Jarrold, J. Am. Chem. Soc. 126, 8628 (2004).
- (12) K. Joshi, S. Krishnamurty, and D. G. Kanhere, Phys. Rev. Lett. 96, 135703 (2006).
- (13) G. A. Breaux, C. M. Neal, B. Cao, and M. F. Jarrold, Phys. Rev. Lett. 94, 173401 (2005).
- (14) S. Krishnamurty, G. Shafai, D. G. Kanhere, and M. J. Ford, Cond-mat/0612287 (to be published).
- (15) U. Röthlisberger and W. Andreoni, J. Chem. Phys. 94, 8129 (1991)
- (16) M. C. Payne, M. P. Teter, D. C. Allan, T. A. Arias, and J. D. Joannopoulos, Rev. Mod. Phys. 64, 1054 (1992).
- (17) D. Vanderbilt, Phys. Rev. B 41, 7892 (1990).
- (18) Vienna ab initio simulation package, Technische Universität Wien (1999); G. Kresse and J. Furthmüller, Phys. Rev. B 54, 11169 (1996).
- (19) Z. Li and H. A. Scheraga, Proc. Natl. Acad. Sci. 84, 6611 (1987); D. J. Wales and J. P. K. Doye, J. Phys. Chem. A 101, 5111 (1997).
- (20) M. Iwamatsu, J. Chem. Phys. 112, 10976 (2000)
- (21) J. A. Niesse and H. R. Mayne, J. Chem. Phys. 105, 4700 (1996)
- (22) R. G. Parr and W. Yang, The Density Functional Theory of Atoms and Molecules (Oxford university Press, New York, 1989).
- (23) A. M. Ferrenberg, R. H. Swendsen, Phys. Rev. Lett. 61, 2635 (1988).
- (24) P. Labastie and R. L. Whetten, Phys. Rev. Lett. 65, 1567 (1990).
- (25) A. Vichare, D. G. Kanhere, and S. A. Blundell, Phys. Rev. B 64, 045408 (2001).