Optical properties of (In,Ga)As capped InAs quantum dots grown on [11k] substrates
Abstract
Using three-dimensional calculation including strain and piezoelectricity, we showed that the size of the quantum dot (QD) in the growth direction determines the influence of the (In,Ga)As capping layer on the optical properties of [11k] grown InAs QDs, where k=1,2,3. For flat dots, increase of concentration in the capping layer leads to a decrease of the transition energy, as is the case of [001] grown QDs, whereas for large dots an increase of the concentration in the capping layer is followed by an increase of the transition energy up to a critical concentration of , after which the optical transition energy starts to decrease.
pacs:
73.21.La, 71.35.Ji, 78.20.Ls, 71.70.GmManipulation of quantum dots’ (QDs) properties is driven by current and potential applications, ranging from QD lasers, and photodetectors to single polarized photon sources. Growth conditions, such as growth temperature, substrate orientation, or capping procedures, determine the QD electronic and optical properties. Shchukin In order to produce good quality QD structures with high densities and low size dispersion, or to control lateral and vertical ordering of QDs in QD lattices, growth on high index surfaces has been put forward. Schmidbauer ; Caroff ; Celebi ; Jacobi2 Furthermore, to achieve long wavelength emission, e.g. larger than 1.3m in a QD laser diode, or alternatively user-defined detection wavelength, e.g. for quantum dot infrared photodetectors, QD-in-a-well (DWELL) structures were introduced. Lin ; Gong Namely, optical properties of a QD are tuned by size and chemical composition of QW layer, where the QD is embedded in.
In a widely investigated DWELL system, [001] grown InAs QD embedded in InxGa1-xAs QW, variation of the concentration in the capping layer as well as the thickness of the layer influence the hydrostatic component of the strain tensor and consequently the transition energies: Increase of the concentration in the QW leads to a decrease of the transition energy. What is happening in the case of QDs grown on [11k] substrates, where k=1,2,3? How does the (In,Ga)As capping layer influence the optical properties of the InAs QDs grown on [11k] substrates? In this Letter we answer these questions and provide a guideline for the variation of the transition energy of [11k] grown QDs, as function of the capping layers thickness and chemical profile, and for different dot composition.
Prior to understanding how the capping layer influences the transition energies of [11k] grown InAs QDs, one has to know the effect on the transition energies of QD growth on [11k] substrates (k=1,2,3). The origin of the variation of the transition energy with the substrate orientation can be traced back to the competition of several effects: MlinarAPL (i) hydrostatic component of the strain tensor is responsible for a shift of the conduction band upwards and the valence bands downwards, (ii) biaxial component of the strain tensor influences the degree of the valence band mixing, and (iii) variation of the hole effective mass with the substrate orientation, which can significantly alter the effects of the size quantization in the QD. Actually, we have shown that the QD size in the growth direction determine which of the three above mentioned effects will be the dominant one, regardless on the dot shape. Therefore, we consider here two model lens-shaped QDs with different height: L1 QD with radius R=9.04nm and height h=4.52nm, and L2 QD with radius R=9.04nm and height h=9.04nm. The thickness of the capping layer is assumed to be the same as the height of the dots, whereas the concentration in the capping layer is varied from 0 to 30.
A model QD, as it enters our calculations, is constructed on a three-dimensional (3D) rectangular grid with a grid step equal to the lattice constant of GaAs, and is shown in Fig. 1(a). In our full 3D model, the strain distribution is calculated using continuum elasticity and the single particle states are obtained from an eight-band theory Mlinar1 including strain and piezoelectricity. In order to properly take into account the effect of the different substrate orientation, the coordinate system is rotated in a way that the Cartesian coordinate z′ coincides with the growth direction [Figs. 1(b)]. Henderson The general [11k] coordinate system is related to the conventional [001] system through a transformation matrix U=U. The angles and represent the azimuthal and polar angles, respectively, of the [11k] direction relative to the [001] coordinate system. Transition energies are calculated taking into account the direct Coulomb interaction.
What will happen when both effects, QD growth on high index surfaces and capping, are present? Transition energies of L1 and L2 QD, extracted from our numerical calculations, as they vary with substrate orientation and concentration in the capping layer, are shown in Figs. 1(c) and (d), respectively. On can see that for both, [001] grown L1 and [001] grown L2 QD, an increase of the concentration in the capping layer leads to a decrease of the transition energy. On the other hand, our findings on the transition energies versus concentration for [11k] grown QD, depend heavily on the dot size in the growth direction. Let us first discuss the case of the L1 QD.
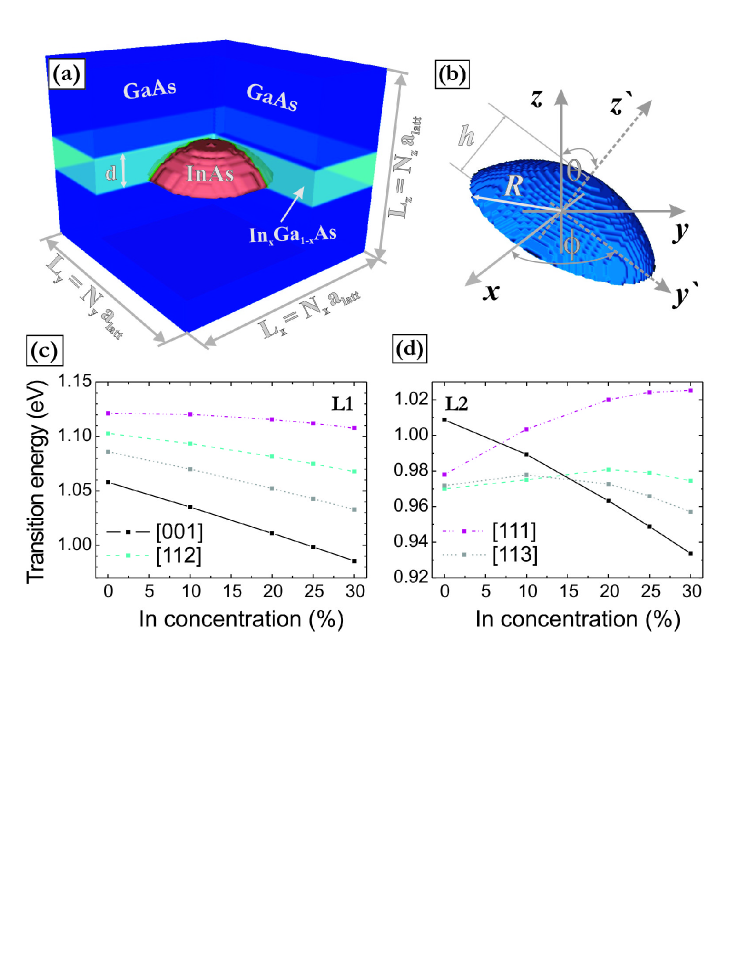
The variation of the transition energy with the concentration does not depend qualitatively on the substrate orientation, i.e. with increase of concentration the transition energy decreases, as was the case for [001] grown QDs [black line in Fig. 1(a)]. This is a simple consequence of the variation of the hydrostatic component of the strain tensor with the substrate orientation and concentration in the capping layer, as shown in Fig. 2(a).

The hydrostatic component of the strain tensor of [11k] grown QDs reduces with the increase of the concentration, as in the case of [001] grown QDs. The substrate orientation only determines the degree of the influence of the capping layer on the hydrostatic strain, and consequently on the transition energy. Namely, for [111] grown QDs, transition energies decrease slower with the increase of the concentration, whereas same dependence for [113] grown QDs is similar to the reference case of [001] grown QDs.
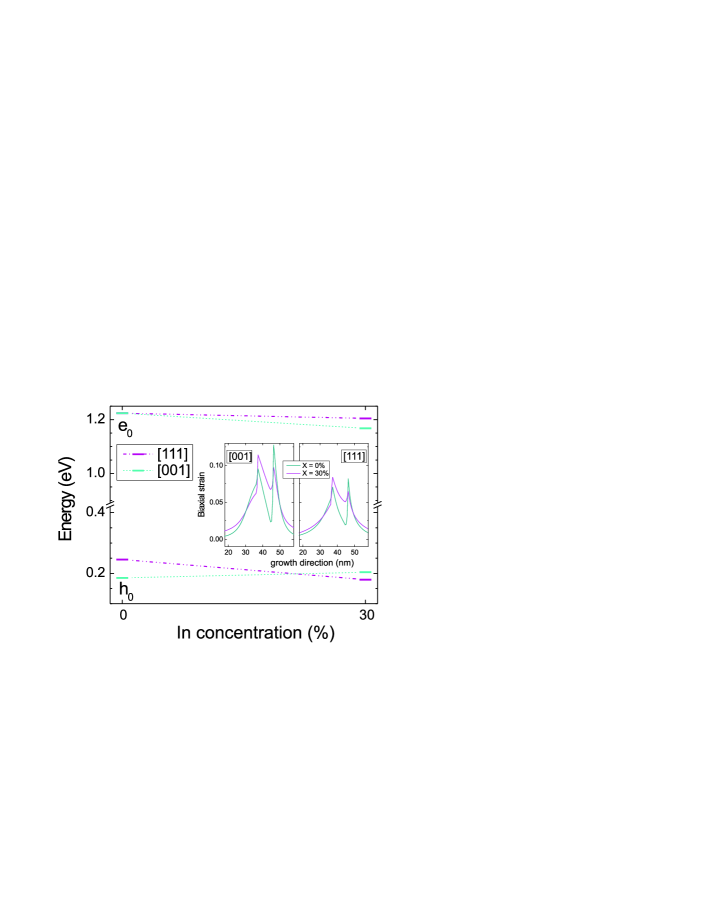
However, for the L2 QD surprising results are obtained: with the increase of the concentration in the capping layer the transition energies of [11k] grown L2 QD increase, exactly the opposite to the dependence for [001] grown L2 QD. After the concentration of in the capping layer reaches some critical value, 35, 20, and 10, for [111], [112], and [113] grown L2 QDs, respectively, the transition energy starts to decrease with consecutive increase of concentration in the capping layer [it starts to follow the pattern of [001] grown L2 QD]. What is the origin of such a behavior? Dependence of the hydrostatic strain on the substrate orientation and concentration in the capping layer is shown in Fig. 2(b) demonstrating that the increase of the concentration leads to a decrease of the hydrostatic strain, as in the case of [001] grown QDs. We single out the most pronounced case, [111] grown L2 QD, and show in Fig. 3 calculated electron and hole ground state for x=0 and x=30 concentration in capping layer. As a comparison, we show the results for [001] grown L2 QD as well. Clearly, the variation of the hole ground state, which is most strongly influenced by the strain, with the capping leads to an increase of the transition energy. It is caused by the increase of the biaxial component of the strain, as shown in the inset of Fig. 3. Actually, the competition between the increased biaxial component of the strain tensor, responsible for the decrease of the valence band mixing, and the decrease of the hydrostatic strain with increase of the concentration determine the transition energy. Note also that even for [001] grown L1 QD, biaxial strain is increased, but the hydrostatic strain has a dominant influence on the transition energy.
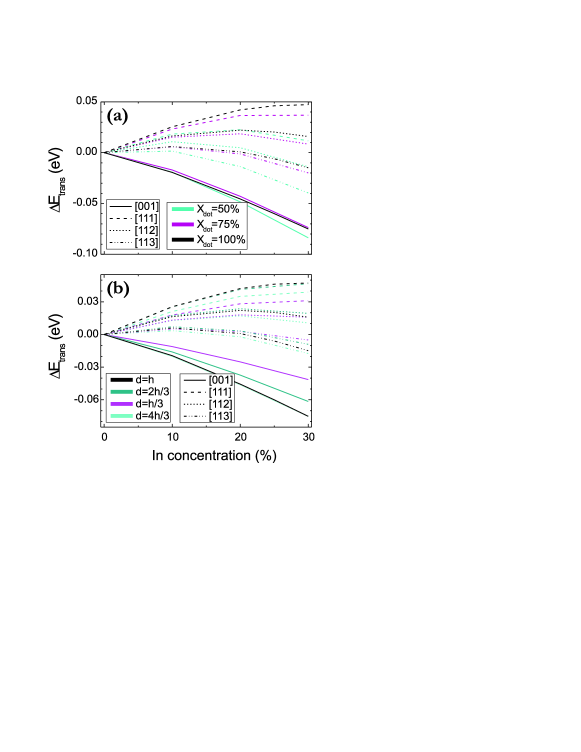
At the end we address how the above conclusions are affected by the variation in the dot composition and the thickness of the capping layer, since those are the uncertainties to be expected in the experiment. For that purpose we modified the L2 QD composition from pure InAs to In0.5Ga0.5As and In0.75Ga0.75As, and thickness of the capping layer, d, from d=h, where h is the L2 dot height, to d=h/3, d=2h/3, and d=4h/3. Our results are shown in Figs. 4(a) and (b). An increase of the transition energy with increase of the concentration in the capping layer is observed regardless of the variation of the dot composition or capping layer thickness. Note that the critical concentration after which the transition energy vs. concentration dependence starts to follow the expected is reduced for L2 QD with 50Ga in the dot, as it can be seen in Fig. 4(a). For example, for [111] grown pure InAs QD critical In concentration is 35, whereas for In0.5Ga0.5As QD critical concentration in the capping layer is 20.
In conclusion, our 3D calculation including strain and piezoelectricity showed that the QD size in the growth direction determines the influence of the (In,Ga)As capping layer on the optical properties of [11k] grown InAs QDs, where k=1,2,3. For flat dots, an increase of concentration in the capping layer leads to a decrease of the transition energy, as it is the case of [001] grown QDs, whereas the large dots exhibit an opposite behavior i.e. increase of the transition energy with increase of concentration up to a critical concentration after which the transition energies start to decrease. We have shown that our conclusions were not sensitive on the dot composition and thickness of the capping layer, therefore possible to verify experimentally.
This work was supported by the Belgian Science Policy (IAP), and the European Union Network of Excellence: SANDiE.
References
- (1) V. Shchukin, N. N. Ledentsov, and D. Bimberg, Epitaxy of Nanostructures, Nanoscience and Technology (Springer, New York, 2003).
- (2) M. Schmidbauer, Sh. Seydmohamadi, D. Grigoriev, Zh. M. Wang, Yu. I. Mazur, P. Schäfer, M. Hanke, R. Köhler, and G. J. Salamo, Phys. Rev. Lett. 96, 66108 (2006).
- (3) P. Caroff, C. Paranhoen, C. Platz, H. Folliot, N. Bertru, C. Labbe, R. Piron, E. Homeyer, A. Le Corre, and S. Loualiche, Appl. Phys. Lett. 87, 243107 (2005).
- (4) C. Çelebi, J. M. Ulloa, P. M. Koenraad, A. Simon and A. Letoublon, and N. Bertru, Appl. Phys. Lett. 89, 23119 (2006).
- (5) M. C. Xu, Y. Temko, T. Suzuki, and K. Jacobi, Phys. Rev. B 71, 75314 (2005).
- (6) C. H. Lin, W.-W. Pai, F. Y. Chang, and H. H. Lin, Appl. Phys. Lett 90, 63102 (2007).
- (7) Q. Gong, P. Offermans, R. Nötzel, P. M. Koenraad, and J. H. Wolter, Appl. Phys. Lett 85, 5697 (2004).
- (8) V. Mlinar and F.M. Peeters, Appl. Phys. Lett. 89, 261910 (2006).
- (9) V. Mlinar, M. Tadić, B. Partoens, and F.M. Peeters, Phys. Rev. B 71, 205305 (2005).
- (10) R. H. Henderson and E. Towe, J. Appl. Phys. 78, 2447 (1995).