Near-Infrared and X-ray Observations of the Enigmatic G70.71.2
Abstract
We present high resolution imaging of the puzzling radio and optical nebula G70.71.2 with the Keck Observatory’s laser guide star adaptive optics (LGS-AO) system and the Chandra X-ray Observatory. The archival X-ray observations show a hard (), low luminosity ( s-1) point source at the center of the nebula. Follow-up LGS-AO near-infrared imaging of the Chandra error circle reveals a relatively bright ( 14 magnitude) counterpart. Both its color and brightness are consistent with a heavily obscured B-star or possibly a late-G/early-K giant. The most plausible explanation is that this newly discovered X-ray source is a non-accreting B-star/pulsar binary powering the radio and optical nebula. If so, the luminous Be-star discussed in the literature seemingly embedded in the nebula is not the dominant force responsible for shaping G70.71.2. Thus, we suggest that G70.71.2 is the result of two unrelated objects (a B-star X-ray binary and a Be star) interacting with a dense molecular cloud. With this explanation we believe we have solved the mystery of the origin of G70.71.2.
1 Introduction
G70.71.2 is a compact (″) radio and optical nebula in the Galactic Plane whose origin is controversial (Reich et al., 1985; Green, 1986; de Muizon et al., 1988; Bally et al., 1989). The shell-like radio morphology is accompanied by broad, blue-shifted [O I] and [S II] emission lines indicative of an interstellar shock (de Muizon et al., 1988; Kulkarni et al., 1992). Millimeter CO emission traces this radio and optical emission, suggesting the shock is interacting with molecular material (Bally et al., 1989; Phillips et al., 1993; Onello et al., 1995). In addition, a bright near-infrared (NIR) star appears to be embedded in G70.71.2, and it is surrounded by a strong H reflection of spectral type Be (Becker & Fesen, 1988; Kulkarni et al., 1992).
Ironically, it is the plethora of clues that make G70.71.2 a perplexing object, despite its discovery more than two decades ago (Reich et al., 1985). G70.71.2 is unique in that nearly every Galactic prototype has been proposed to explain it: young supernova remnant, nova shell, stellar wind bubble, H II region and Herbig-Haro-like outflow (Reich et al., 1985; de Muizon et al., 1988; Green, 1986; Becker & Fesen, 1988). However, none of these can explain the low expansion velocities and the non-thermal radio emission. The only currently proposed consistent theory to explain these properties is one in which the bright NIR star is paired with an unseen neutron star to form a Be-radio pulsar binary moving supersonically through the dense gas (Kulkarni et al., 1992). In this model, significant mass loss from the luminous Be-star inflates a bubble which is filled by a mixture of the stellar wind with energetic particles and magnetic field from the pulsar. This combination creates the non-thermal radio emission coincident with the optical bow shock of the medium surrounding the system. This model makes the prediction that an X-ray source or pulsar should be seen coincident with the embedded Be-star.
Here, we report on archival X-ray and new Keck LGS-AO observations that reveal an X-ray source with a NIR counterpart in the center of G70.71.2 which is unassociated with the Be-star. We suggest that the object known as G70.71.2 is the result of the interaction of a luminous Be-star and an X-ray emitting B-star/pulsar binary with dense molecular material. If correct the resulting study of this object will be an interesting laboratory for the study of plasma processes. The observations and results are presented in §2. In §3 we discuss the implications of this source as it relates to resolving the mystery surrounding G70.71.2.
2 Observations and Analysis
2.1 X-ray
G70.71.2 was observed 2003 October 11.33 UT with the ACIS-S detector on Chandra in the standard, timed exposure mode. The archival data were analyzed with CIAO version 3.2111http://www.cxc.harvard.edu/ciao/. We reprocessed the level 1 events from the Chandra X-ray Center (CXC) in order to make use of the latest calibration and removed pixel randomization. The level 2 event file was created by filtering grades 0,2,3,4,6 and good-time intervals. The total exposure time after filtering periods higher than 3- above the mean background level was 37.6 ksec.
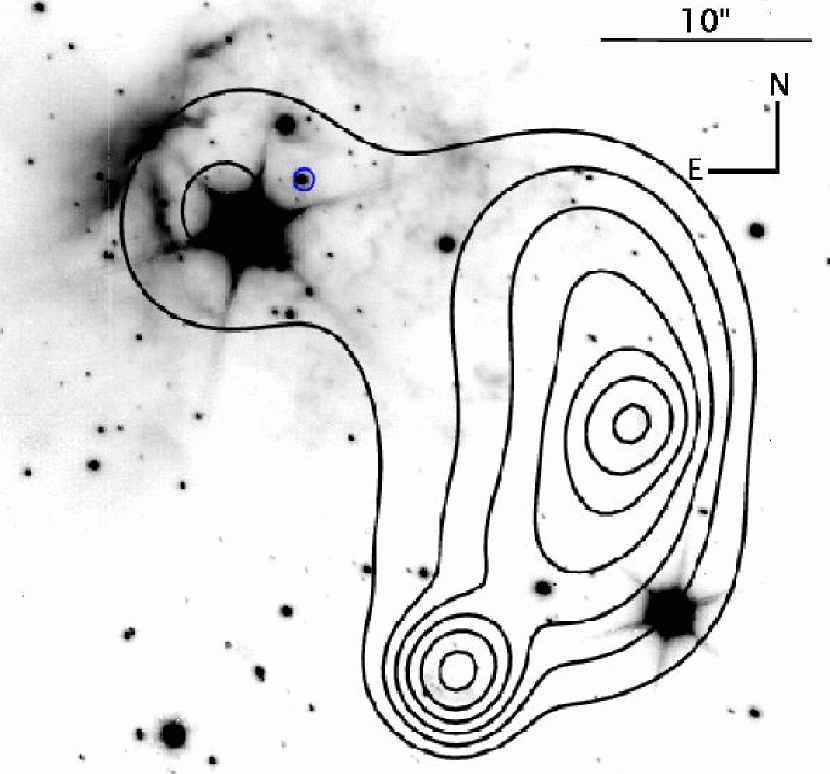
Diffuse emission and a point source (hereafter CXO J200423.4333907; Figure 1) are detected at the position of G70.71.2 (as first noted by Arzoumanian et al. 2004). We compared the positions of 27 X-ray sources on the S3 chip with counterparts in the 2MASS point source catalog to correct the native astrometry (Cutri et al., 2003). This comparison showed evidence for a small systematic shift, -013 011, -008 011. The best-fit position of CXO J200423.4333907 including this offset is (J2000)20h04m23.430s and (J2000) with measurement uncertainty of 003 and 008 in each coordinate, respectively. Combining the measurement and transformation errors in quadrature gives an uncertainty of 018 (1-) for the X-ray position of CXO J200423.4333907 relative to 2MASS. This position lies 36 from the nearby luminous NIR star, which implies the two are not associated (Kulkarni et al., 1992; Arzoumanian et al., 2004).
We applied the adaptive smoothing algorithm CSMOOTH to highlight the diffuse emission after subtraction of CXO J200423.4333907 and produced a flux-calibrated image by applying an exposure map as outlined in the CIAO threads. The contours of this emission are overlaid on an NIR image (see §2.2) of the nebula in Figure 1. Evidently, most of the diffuse X-ray emission is not coincident with the diffuse NIR emission.
We extracted photons within a 15 circle (corresponding to 90% of the expected counts at 1.4 keV) around CXO J200423.4333907 to perform spectral and variability analyses. The source contains only 33 counts. Upon examination of regions both inside the diffuse emission and in a source-free area, we expect only two of these to be background photons. A Kolmogorov-Smirnov test shows that the arrival times of the source photons differed from a constant rate at only the 1- level, thus the source cannot be considered variable.
We begin our spectral analysis by noting that all the photons from CXO J200423.4333907 fall in the range 1.0–4.5 keV, suggesting a hard spectrum. After calculating the response matrix and effective area of this portion of the CCD, we fit an absorbed power-law model to the spectrum using Cash statistics (due to the limited number of counts; Cash 1979). The best-fit parameters in Table 1 show a relatively hard photon index, , and low luminosity, erg s-1 (2.0–10.0 keV) for an assumed distance of 4.5 kpc (Bally et al., 1989). These values are consistent with known accreting neutron stars in quiescence (e.g. Rutledge et al. 2001; Campana et al. 2005). In addition, we fit two absorbed power-law models with fixed parameters (see Table 1). The first has the photon index set to a typical value for quiescent neutron stars, , while the second has the column density fixed to the best fit value of the diffuse emission, = cm-2 (see below).
The probability of finding a source as bright or brighter than CXO J200423.4333907 within the extent of G70.71.2 can be determined from the local source density. A WAVDET analysis of the active CCDs (ACIS-I2,3 and ACIS-S1,2,3,4) finds that 12 sources are as bright or brighter than CXO J200423.4333907. The inferred density is then 112 sources/deg2. This density is consistent with observations taken as part of the ChaMPlane Survey (Grindlay et al., 2005), which predicts 100 sources/deg2 with fluxes as bright or brighter than CXO J200423.4333907 (Hong et al., 2005). Consequently, there is a 0.3% probability that such a source would be found within G70.71.2 by chance.
The diffuse emission presented enough counts for basic spectroscopy with statistics. We extracted events from a region of dimension ″″ surrounding the diffuse emission (excluding the point source) and a source-free background region immediately east of the nebula with the same shape. This yielded source counts, of which 320 are expected to be due to the background. The resulting source plus background photons were grouped such that each bin contained at least 25 counts.
The background subtracted spectrum was analyzed using XSPECv11222See http://heasarc.nasa.gov/docs/xanadu/xspec/. We fit two models modified by absorption to the spectrum: a power-law and a Raymond-Smith plasma (see Table 1). The unphysically steep photon index of the power-law model and the lower value lead us to adopt the Raymond-Smith model for the remainder of our analysis. The derived value of is reasonably consistent with that of CXO J200423.4333907 and estimated value of cm-2 from Dickey & Lockman (1990). Integrating this model over the 0.5–2.5 keV bandpass implies a luminosity of 8.1 1032 s-1 at the distance of G70.71.2, although it is not clear that this emission is associated with the nebula (see §3).
2.2 Near-Infrared LGS-AO
G70.71.2 was observed under photometric conditions on 2005 April 30 UT with Laser Guide Star Adaptive Optics (LGS-AO; Wizinowich et al. 2006; van Dam et al. 2006) on the Keck II telescope and the Near-Infrared Camera 2 (NIRC2). We imaged the field in the , and -bands with the wide camera of NIRC2, which provides a 40″40″ field of view and a 004 pixel scale. The and -band data sets consisted of five frames in each band. Each frame was exposed for 5 sec with 10 additions performed on the chip at five dither positions separated by 30″. The -band data consisted of two images at the center of the chip.
Each frame was flat-fielded, background subtracted, and repaired for bad pixels using custom PyRAF software333PyRAF is a product of Space Telescope Science Institute, which is operated by AURA for NASA.. We then performed a second round of sky subtraction using a median combination of similarly processed frames of a nearby field. We used these processed images of G70.71.2 for photometric analysis, but produced a separate set of images for astrometry due to optical distortion in the NIRC2 camera. The distortion in the second set was corrected using algorithms derived from the preshipment review documents444available at http://www2.keck.hawaii.edu/inst/nirc2/ with the IDL procedure provided by the Keck Observatory555See http://www2.keck.hawaii.edu/optics/lgsao/software/. The correction does not conserve flux, and thus is not suitable for photometry.
We registered a median combination of the distortion corrected -band frames to the 2MASS point source catalog using 8 stars that were not over-exposed. We find residuals of 004 and 009 in right ascension and declination, respectively. Registering the and -band frames to this image yielded negligible residuals. Combining these errors with those in the X-ray position of CXO J200423.4333907 yields an uncertainty of 019 (1-) of the X-ray image with respect to the NIR images. Figure 1 shows the registered -band frame with the Chandra error circle (99% confidence). We clearly identify a single bright NIR counterpart in all filters within the X-ray error circle. The best fit position of this source is (J2000)20h04m23.446s and (J2000) with an uncertainty of 004 and 009 (relative to 2MASS), respectively. The centroiding errors are negligible. This position lies 023 from the Chandra position.
We performed aperture photometry of the source in each band on each individual frame relative to 2MASS stars in the field with the IRAF package APPHOT. We assume that the color term used to transform from the 2MASS filter to the is negligible for our purposes. The uncertainties were determined with the 2MASS photometric uncertainty, the standard deviation of the zero-point determinations from the same 2MASS star in multiple frames and the photometric error of the NIR source itself added in quadrature. We find magnitudes of , and .
The probability of finding a star with magnitude in our Chandra error circle by chance is very low. To quantify this we extracted all sources present in the 2MASS catalog within 20′ of G70.71.2. We find that the differential number of sources per magnitude per square arcsecond is well described by a single power-law with index 0.35 over the magnitude range 3 15. We can conservatively assume (based on Galactic star count models by Nakajima et al. 2000) that this can be extrapolated to our 5- detection limit of magnitude. From this we calculate that there is a 25% percent chance of finding a source brighter than our detection limit in a circular region with a 049 (99% confidence) radius. However, the probability of finding a source with magnitude or brighter is 0.1%. Thus it is unlikely that our NIR counterpart is drawn from the background population, and we assume that it associated with CXO J200423.4333907.
The key issue in determining the nature of this source is the assumed extinction. Based on the colors of the luminous NIR star, Becker & Fesen (1988) estimate . This agrees well with the value of obtained by taking as determined from the spectrum of the diffuse X-ray emission and translating it into extinction (Predehl & Schmitt, 1995). If we plot the NIR counterpart on a color-magnitude diagram (see Figure 2) using this reddening we find that the star is consistent with a late G/early K giant spectral type at a distance of kpc. Consequently, the star is under luminous if it is associated with G70.71.2 at a distance of 4.5 kpc.
The spectral fitting of the point source spectrum itself, albeit with poor statistics, implies a higher extinction of . This allows for the possibility that the NIR counterpart is a heavily obscured main sequence B-star with at the distance of G70.71.2. We prefer this interpretation when we consider the probabilistic arguments and existing multifrequency observations of G70.71.2 (see §3).
3 Discussion and Conclusions
We identify a low-luminosity, hard X-ray point source with a NIR counterpart at the center of G70.71.2 using high resolution imaging. Both the measured X-ray luminosity, s-1, and the photon index, , of CXO J200423.4333907 are consistent with quiescent neutron star systems (e.g. Rutledge et al. 2001; Campana et al. 2005). The magnitude and - color in combination with the X-ray column density suggests the NIR counterpart is either an evolved background star or a heavily extincted B-star. However, an isolated background late-G/early-K giant cannot explain the observed X-ray flux. These stars have deep convective zones that power coronal X-ray emission, but it is typically s-1(Güdel, 2004). This is an order of magnitude below the required s-1calculated assuming the observed X-ray flux at a distance of 11 kpc. In addition, spectral types later than B2 have have observed X-ray luminosities s-1(Berghoefer et al., 1997). This suggests that the NIR source and CXO J200423.4333907 constitute an X-ray binary, and probabilistic arguments suggest that this binary is associated with G70.71.2.
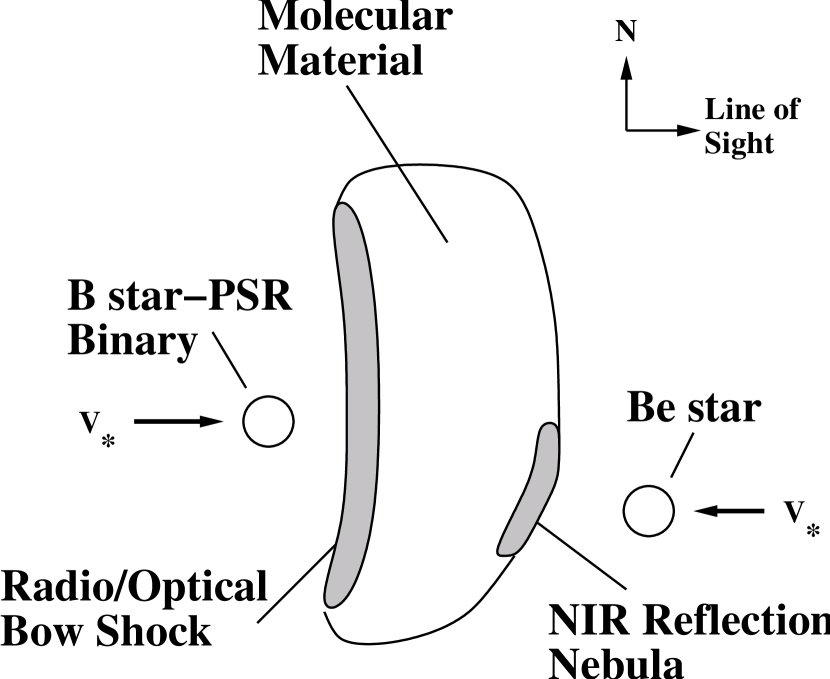
A simple geometric model can explain the existing multifrequency data (Figure 3). The velocity of the molecular gas as measured by CO observations is with respect to the local standard of rest (Bally et al., 1989). The stellar H line profile from the bright Be-star is redshifted with respect to the CO with a velocity of 20–60, while H reflected by dust in the eastern region is also redshifted with respect to the CO, but is blueward of the stellar H by 10–50. This implies that the bright NIR star is moving into the cloud, away from the Earth. However, the [O I] and H throughout the rest of nebula traces the non-thermal radio emission and is uniformly blue-shifted by 10–120 with respect to CO, suggesting that the source responsible for the shock is moving into the cloud, toward the Earth.
The cloud size, as inferred from CO, is 3 pc on the sky, where is the distance to G70.71.2 in units of 4.5 kpc. If the cloud is roughly spherical and has cm-3, then objects will have an additional 5 magnitudes of extinction with respect to objects on the near side. Thus, a natural explanation for the geometry of G70.71.2 is that the bright Be-star is moving into the near side of the cloud creating a reflection nebula, while on the far side, a heavily extincted B-star/pulsar binary is moving into the cloud creating a bow shock and powering the nebula (Figure 3).
One remaining puzzle is the origin and impact of the hot gas powering the diffuse X-ray emission. Figure 1 shows that the radio/optical and diffuse X-ray morphologies are substantially different, and the peak of the diffuse X-ray emission is separated ″from the center of the radio/optical emission (which contains the Be-star and X-ray binary). Thus, it is apparent that this hot gas does not play an important dynamic nor, given the its luminosity is s-1, energetic role in shaping G70.71.2. Two viable explanations for the origin of the hot gas are, given the quasi-shell like morphology, that it is the result of a previous explosive event that the X-ray binary is overtaking or it may be unassociated with the G70.71.2. In any case, the origin of this plasma — either related or unrelated to G70.71.2 — is unknown.
The definitive proof of the proposed model (Figure 3) would be the discovery of a pulsar associated with G70.71.2. A search for pulsations with the Green Bank Telescope at 2.2 GHz is underway. If a pulsar is found, G70.71.2 will be an important laboratory for studying plasma processes taking place between the pulsar/B-star wind and the interaction of that mixture with the cold molecular gas.
References
- Arzoumanian et al. (2004) Arzoumanian, Z., Cordes, J., Van Buren, D., Corcoran, M., Safi-Harb, S., & Petre, R. 2004, AAS/High Energy Astrophysics Division, 8,
- Bally et al. (1989) Bally, J., Pound, M. W., Stark, A. A., Israel, F., Hirano, N., Kameya, O., Sunada, K., Hayashi, M., Thronson, H. J., & Hereld, M. 1989, ApJ, 338, L65
- Becker & Fesen (1988) Becker, R. H. & Fesen, R. A. 1988, ApJ, 334, L35
- Bessell & Brett (1988) Bessell, M. S. & Brett, J. M. 1988, PASP, 100, 1134
- Berghoefer et al. (1997) Berghoefer, T. W., Schmitt, J. H. M. M., Danner, R., & Cassinelli, J. P. 1997, A&A, 322, 167
- Campana et al. (2005) Campana, S., Ferrari, N., Stella, L., & Israel, G. L. 2005, A&A, 434, L9
- Cash (1979) Cash, W. 1979, ApJ, 228, 939
- Cutri et al. (2003) Cutri, R. M., Skrutskie, M. F., van Dyk, S., Beichman, C. A., Carpenter, J. M., Chester, T., Cambresy, L., Evans, T., Fowler, J., Gizis, J., Howard, E., Huchra, J., Jarrett, T., Kopan, E. L., Kirkpatrick, J. D., Light, R. M., Marsh, K. A., McCallon, H., Schneider, S., Stiening, R., Sykes, M., Weinberg, M., Wheaton, W. A., Wheelock, S., & Zacarias, N. 2003, 2MASS All Sky Catalog of point sources. (The IRSA 2MASS All-Sky Point Source Catalog, NASA/IPAC Infrared Science Archive. http://irsa.ipac.caltech.edu/applications/Gator/)
- de Muizon et al. (1988) de Muizon, M., Strom, R. G., Oort, M. J. A., Claas, J. J., & Braun, R. 1988, A&A, 193, 248
- Dickey & Lockman (1990) Dickey, J. M. & Lockman, F. J. 1990, ARA&A, 28, 215
- Green (1986) Green, D. A. 1986, MNRAS, 219, 39P
- Grindlay et al. (2005) Grindlay, J. E., Hong, J., Zhao, P., Laycock, S., van den Berg, M., Koenig, X., Schlegel, E. M., Cohn, H. N., Lugger, P. M., & Rogel, A. B. 2005, ApJ, 635, 920
- Güdel (2004) Güdel, M. 2004, A&A Rev., 12, 71
- Hong et al. (2005) Hong, J., van den Berg, M., Schlegel, E. M., Grindlay, J. E., Koenig, X., Laycock, S., & Zhao, P. 2005, ApJ, 635, 907
- Kulkarni et al. (1992) Kulkarni, S. R., Vogel, S. N., Wang, Z., & Wood, D. O. S. 1992, Nature, 360, 139
- Nakajima et al. (2000) Nakajima, T., Iwamuro, F., Maihara, T., Motohara, K., Terada, H., Goto, M., Iwai, J., Tanabe, H., Taguchi, T., Hata, R., Yanagisawa, K., Iye, M., Kashikawa, N., & Tamura, M. 2000, AJ, 120, 2488
- Onello et al. (1995) Onello, J. S., Depree, C. G., Phillips, J. A., & Goss, W. M. 1995, ApJ, 449, L127+
- Phillips et al. (1993) Phillips, J. A., Onello, J. S., & Kulkarni, S. R. 1993, ApJ, 415, L143+
- Predehl & Schmitt (1995) Predehl, P. & Schmitt, J. H. M. M. 1995, A&A, 293, 889
- Reich et al. (1985) Reich, W., Fürst, E., Altenhoff, W. J., Reich, P., & Junkes, N. 1985, A&A, 151, L10
- Rutledge et al. (2001) Rutledge, R. E., Bildsten, L., Brown, E. F., Pavlov, G. G., & Zavlin, V. E. 2001, ApJ, 559, 1054
- van Dam et al. (2006) van Dam, M. A., Bouchez, A. H., Le Mignant, D., Johansson, E. M., Wizinowich, P. L., Campbell, R. D., Chin, J. C. Y., Hartman, S. K., Lafon, R. E., Stomski, Jr., P. J., & Summers, D. M. 2006, PASP, 118, 310
- Wizinowich et al. (2006) Wizinowich, P. L., Le Mignant, D., Bouchez, A. H., Campbell, R. D., Chin, J. C. Y., Contos, A. R., van Dam, M. A., Hartman, S. K., Johansson, E. M., Lafon, R. E., Lewis, H., Stomski, P. J., Summers, D. M., Brown, C. G., Danforth, P. M., Max, C. E., & Pennington, D. M. 2006, PASP, 118, 297
| Model | / | Flux | ||
|---|---|---|---|---|
| ( cm-2) | (keV) | ( erg cm-2 s-1) | ||
| (1) | (2) | (3) | (4) | (5) |
| Diffuse Emission | ||||
| Power-law | 18.2/13 | |||
| Raymond-Smith Plasma | 9.75/13 | |||
| CXO J200423.4333907 | ||||
| Power-law | 1.8 | 1.7 | — | |
| Power-law () | (2.0) | 1.6 | — | |
| Power-law () | (1.0) | — |
Note. — All errors are 68% confidence levels. Values in parentheses are held fixed. (1) – Absorbed spectral model. (2) – Best-fit column density. (3) – Measured photon index for power-law models and for the Raymond-Smith plasma. (4) – The unabsorbed flux in the 0.5–2.5 keV band for the diffuse emission and 2–10 keV band for CXO J200423.4333907. (5) – The value of for diffuse emission models and the number of degrees of freedom, . This column is not applicable to CXO J200423.4333907 since the spectral fitting was performed with Cash statistics.