An Inner Hole in the Disk around TW Hydrae Resolved in 7 millimeter Dust Emission
Abstract
We present Very Large Array observations at 7 millimeters wavelength that resolve the dust emission structure in the disk around the young star TW Hydrae at the scale of the 4 AU ( 016) radius inner hole inferred from spectral energy distribution modeling. These high resolution data confirm directly the presence of an inner hole in the dust disk and reveal a high brightness ring that we associate with the directly illuminated inner edge of the disk. The clearing of the inner disk plausibly results from the dynamical effects of a giant planet in formation. In an appendix, we develop an analytical framework for the interpretation of visibility curves from power-law disk models with inner holes.
Subject headings:
circumstellar matter — planetary systems: protoplanetary disks — stars: individual (TW Hydrae)1. Introduction
The TW Hya system is thought to be a close analog of the early Solar nebula. At a distance of 514 pc (Mamajek, 2005), it is the closest known classical T Tauri star, and a suite of observational studies have shown that TW Hya harbors a massive disk of gas and dust. Scattered light observations at optical and near-infrared wavelengths reveal a surface brightness profile consistent with a nearly face-on, optically thick, flared disk extending to 200 AU in radius (Roberge et al., 2005; Weinberger et al., 2002; Krist et al., 2000; Trilling et al., 2001). Observations at millimeter wavelengths have detected thermal dust emission and a variety of molecular species, including 13CO, 12CO, CN, HCN, HCO+, and DCO+ (Weintraub et al., 1989; Zuckerman et al., 1995; Kastner et al., 1997; van Dishoeck et al., 2003; Wilner et al., 2003; Qi et al., 2004). The dust also displays signatures of grain growth up to centimeter scales (Wilner et al., 2005), and perhaps substantially larger sizes.
Detailed models of the TW Hya spectral energy distribution (SED) provide constraints on many aspects of the disk structure (Calvet et al., 2002), including the radial dependence of outer disk surface density and temperature, and a clearing of the inner disk within 4 AU radius. Resolved interferometric observations of millimeter and submillimeter dust emission are in good agreement with the structure inferred from the irradiated accretion disks models that match the SED (Qi et al., 2004; Wilner et al., 2000), though the resolution and sensitivity at these wavelengths have not been sufficient to address the presence of the inner hole.
The inner hole is indicated by two features of the SED (Calvet et al., 2002): (1) a flux deficit from 2-20m, indicative of low (dust) surface density in the inner disk, and (2) a flux excess at 20-60 m, thought to originate from the truncated inner edge of the disk, directly illuminated by the star. Similar spectral features have been recognized in other T Tauri star SEDs (e.g. GM Aurigae and DM Tauri; see Calvet et al., 2005) and may signify an important phase in the evolution of circumstellar disks. One exciting possibility is that a discontinuity in the inner disk is a consequence of the perturbative gravity field of a giant planet. Theories of planet-disk interaction predict the opening of gaps in a disk as a result of the formation of massive planets (e.g. Lin & Papaloizou, 1986; Bryden et al., 1999). However, Boss & Yorke (1993, 1996) show that the interpretation of infrared flux deficits as central clearings is not unique and reproduce SEDs of accreting disks around low-mass, pre-main sequence stars with a combination of opacity and geometry effects in the unresolved system. Spatially resolved observations of disk structure are required to confirm the inference from spectral deficits of inner disk clearing.
To probe the disk morphology on size scales commensurate with the 4 AU transitional radius of Calvet et al. (2002), we have used the Very Large Array111 The National Radio Astronomy Observatory is a facility of the National Science Foundation operated under cooperative agreement by Associated Universities, Inc. to observe thermal dust emission from TW Hya at a wavelength of 7 millimeters. These observations show clearly a deficit of dust emission in the inner disk consistent with the predicted hole.
2. Observations
We used the Very Large Array to observe TW Hya at 7 millimeters in the most extended (A) configuration. The observations used 23 VLA antennas (several were unavailable due to eVLA upgrades) that gave baseline lengths from 130 to 5200 k. The observations were conducted for four hours per night on 10, 11 February 2006 and 7 March 2006, from 7 and 11 UT (0 to 4 MST), during the late night when atmospheric phases on long baselines are most likely to be stable. Both circular polarizations and two 50 MHz wide bands were used to obtain maximum continuum sensitivity. The calibrator J1037-295 was used to calibrate the complex gains, using an 80-second fast switching cycle with TW Hya. The calibrator J1103-328, closer to TW Hya in the sky, was also included in a few minutes of fast switching each hour to test of the effectiveness of the phase transfer from J1037-295. The phase stability was good during the observations of 11 February, worse on 10 February, and much worse on 7 March. Using the AIPS task SNFLG, we pruned the data with phase jumps of more than 70∘ between phase calibrator scans. This procedure passed about 80% of the data from the night of 11 February but substantially less from the other nights. Therefore, in the subsequent analysis we have used data only from 11 February, the most stable night. The calibrator 3C286 was used to set the absolute flux scale (adopting 1.45 Jy, from the AIPS routine SETJY), and we derived 1.95 Jy for J1037-295. The uncertainty in the flux scale should be less than 10%.
3. Results
3.1. 7 mm Image
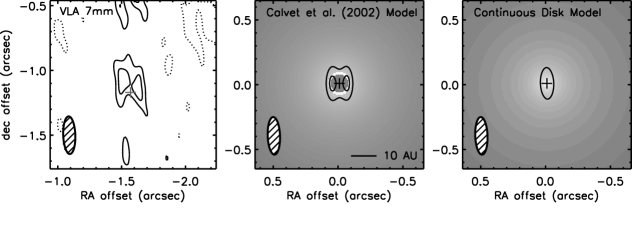
Figure 1 shows an image of the TW Hya 7 millimeter emission, where a Gaussian taper (FWHM 2000 k) has been used in the imaging process to obtain an angular resolution matched to the surface brightness sensitivity. The rms noise level in this image is 0.23 mJy, and the peak flux of 0.88 mJy corresponds to a brightness temperature of 46 K. Because of the southern declination of the TW Hya and the VLA antenna geometry, the beam is elliptical and the resolution is higher east-west than north-south. Inspection of Figure 1 shows that the 7 millimeter emission is clearly not centrally peaked, as would be expected for a disk that extends continuously inwards towards the central star. Instead, the image exhibits a double-peaked morphology, consistent with a nearly face-on disk with a central hole observed with an elliptical beam. An image of the test calibrator J1103-328 made with the same parameters is point-like, as expected.
3.2. Radially Averaged 7 mm Visibilities
The central hole in the TW Hya emission may be identified even more clearly in the visibility domain, free from the effects of the Fourier transform process and non-linear deconvolution. To better show the brightness distribution, we averaged the visibility data in concentric annuli of deprojected (u,v) distance, , as described in Lay et al. (1997). We use the TW Hya disk position angle and inclination found by Qi et al. (2004) from CO line imaging of the outer disk (-45∘ and 7∘, respectively). These values may not be valid in the inner disk, if e.g. the disk warps in the interior. However, as long as the disk remains close to face-on at all radii, the deprojection correction is small and therefore insensitive to the exact values of these parameters.
For each visibility, the coordinates were redefined in terms of , the distance from the origin of the (u,v) plane, and , the polar angle from the major axis of the disk (defined by the position angle, , measured east of north). Assuming circular symmetry and taking into account the disk inclination , the deprojected (u,v) distances parallel to the major and minor axes of the disk, are , , respectively, and the deprojected (u,v) distance is .
An important parameter in the averaging process is the position of the star, or the center of the disk. To examine the radial distribution of flux at the smallest scales permitted by the data, particularly in the east-west direction of highest resolution, we must know the phase center to within a fraction of the radius set by the resolution, i.e., the position of the star must be specified to within a few hundredths of an arcsecond, which is better than the absolute astrometric accuracy of the data (typical positional accuracies in the A array are due to baseline uncertainties and uncorrected tropospheric phase fluctuations; see, e.g. the 2004 VLA Observational Status Summary). To the extent that the disk is symmetric, the process of deprojecting and averaging at the correct star position will minimize the scatter within each deprojected radial bin and bring the average of the imaginary parts of the visibilities (the average phase) to zero. Therefore, we chose the star position to be that which minimized the absolute value of the mean of the imaginary visibility bins. This position is indicated by the cross in the left panel of Figure 1.
Figure 2 shows the annularly averaged visibility amplitude as a function of . The width of each bin is 430 k, chosen to be narrow enough to sample the shape of the visibility function and also wide enough to have sufficient signal-to-noise ratio. Although the visibility data are still noisy when divided up in this way, it is evident that the visibility function passes through a null near of 1000 k, indicative of a sharp edge in the emission.

4. Discussion
The most striking feature of the new 7 millimeter observations is the central depression in the image, which is also indicated by the presence of the null in the deprojected visibility function. We identify this feature with a clearing of the inner dust disk. A continuous disk that extends inward to the dust destruction radius at 0.01 AU would show sharply centrally peaked emission and would not show a null at the observed baselines. Figure 1 compares the 7 millimeter image (left panel) with an image generated for a model with a continuous disk (right panel). Figure 2 also shows the visibility function of continuous disk (dashed line); this is clearly not compatible with the 7 mm observations (or the infrared SED ).
Independent of detailed modeling, the size scale of this inner hole can be estimated simply from the separation of the peaks in the image. These peaks are sensitive primarily to inner edge of the disk, where the 7 millimeter brightness is highest. The separation of the peaks is , or AU. This separation is slightly smaller than the diameter of the inner hole, since the bright emission from the inner edge to the north and to the south of the star, combined with the lower angular resolution in the north-south direction, tend to draw the image peaks together. This effect is evident in the right panel of Figure 1, in which the contoured peaks can be seen to lie interior to the inner edge of the disk. The null in the visibility function provides a corroborating estimate of the size of the inner hole in the disk. In appendix A, we show how the angular scale of the null in the visibility function of a power law disk depends on the density and temperature power law indices and the radius of the inner hole. If we assume that the outer disk emission contributes little on these long baselines, and that the total emission is dominated by a bright, thin ring associated with the inner edge of the disk, as discussed in §4.1.1 below, then we can estimate the radius of the inner hole hole with equation A11. A linear fit to the binned visibilities gives a null position of 93060 k and implies an inner hole radius 4.30.3 AU. Thus the resolved dust emission shows an inner hole in the disk at a size scale very similar to that inferred from SED modeling.
4.1. Comparison with Disk Models
4.1.1 Power Law Disk Models
The dust emission from the outer disk of TW Hya has been shown to be a good match to the structure of an irradiated accretion disk model, approximated by power laws in temperature and surface density with indices and , respectively, over a wide range of radii. However, an extrapolation of this very simple power law model to an inner disk truncated at AU radius is not compatible with the new long-baseline 7 millimeter data. For these power laws, the null in the visibility function of the 4 AU hole should appear at k, which is a factor of two smaller than observed (equation A9). In order for a 4 AU hole to be consistent with a 1000 k null, the power law model requires a much steeper emission gradient, with the sum of the radial power law indices approaching . Such steep power laws are inconsistent with observations of the outer disk. In addition, this power law model fails to reproduce the flux in the image peaks by nearly an order of magnitude. Another possibility is that the radius of the hole is smaller than that predicted by the SED. A power law disk with and radius 2 AU does reproduce the 1000 k null and observed peak separation; however, this model still fails to reproduce the observed peak flux by more than a factor of five. These discrepancies indicate that a more complex model of the disk is needed. In general, reproducing the observed peak flux in the new high resolution observations requires a greater concentration of material at the inner edge of the disk than that of power-law disk models.
A natural modification to the power law disk model with an inner hole is the addition of a bright, thin, inner edge, or “wall” component. This “wall” component corresponds to the frontally illuminated inner edge of the disk in the calculations of Calvet et al. (2002), who show that a small range of temperatures is required to reproduce the narrow spectral width of the mid-infrared excess. The presence of this additional compact component to the model shifts the angular scale of the null in the visibility function to larger and raises the flux at long baselines. In this composite model, for a given power law description, the angular scale of the null in the composite “disk+wall” visibility function depends on (1) the radius of the inner hole, and (2) the relative brightness of the disk and wall. The effect of the second dependency is to move the angular scale of the null between the limiting positions from the “disk” alone and from the “ wall” alone. In fact, the position of the null in the 7 millimeter data is close to that expected from an infinitesimally thin ring of 4 AU radius (equation A11). A bright, thin ring also reproduces the separation of the image peaks. Thus it appears that the high resolution observations show primarily the directly illuminated wall at the inner edge of the disk. At these long baselines, the extended emission from the outer disk that dominates at larger size scales is weak and effectively not detected.
4.1.2 Irradiated Accretion Disk Model
The irradiated accretion disk model of Calvet et al. (2002) provides a more realistic description of disk structure than a simple power-law model. To compare the data to this more sophisticated disk model, we simulate numerically the expected emission at 7 millimeters, including the detailed visibility sampling of the Very Large Array observations.
For the frontally illuminated component of the inner edge of the disk, we follow the prescription of Calvet et al. (2002), adopting a shape given by
| (1) |
and temperature
| (2) |
where is the radius from the star, is the height of the wall, subscript refers to the boundary between the wall and the outer disk, and , and we assume that at 7 millimeters the radial brightness tracks the temperature. To set the absolute flux of this component, we normalized the intensity distribution to match the peak flux of the image and the total flux of the disk determined from previous, lower resolution imaging (Wilner et al., 2000). Since is not well constrained by our data, except that the wall must be narrow compared to the size of the hole () and the resolution of the data (, or 4.6 AU at 51 pc), we use the value AU which Calvet et al. (2002) find to be consistent with the shape of the mid-IR SED. We choose to be 4.5 AU so that the peak of the wall emission occurs near 4.0 AU, causing the null of the model to match the position indicated by the data. For the dust mass opacity, we use the power law form where , , and (D’Alessio et al., 2001).
We used the Monte Carlo radiative transfer code RATRAN (Hogerheijde & van der Tak, 2000) to calculate a sky-projected image from the model continuum emission, with frequency and bandwidth appropriate for the observations, and the miriad task uvmodel to simulate the observations, using the appropriate antenna positions and visibility weights. Figure 2 shows the visibility function from this model (heavy solid line), which matches well the observations. The light solid line shows the contribution from the outer disk, which accounts for only a small fraction of the flux observed at long baselines, and the dotted curve shows contribution from the thin wall component, which dominates the outer disk at beyond k. The long baseline data are sensitive to the total flux and thin width of the wall, and are compatible with the assumptions of the wall structure used in the previous SED modeling. In the image domain, we have compared the 7 millimeter data to the Calvet et al. (2002) model using RATRAN to generate images of a disk with an inner hole of radius 4.5 AU and a bright wall of width 0.5 AU and total flux 1.7 mJy (Figure 1, center panel), which Calvet et al. (2002) find to be consistent with the mid-infrared SED. For comparison, we also generate an image of a continuous disk extending inward to the dust destruction radius at 0.01 AU (Figure 1, right panel). The data are inconsistent with this continuous disk model, while the SED-based model of Calvet et al. (2002) with an inner hole and bright wall matches the observed structure well.
In short, the 7 millimeter data suggest an outer dust disk extending inward to AU, where there is wall of radial extent 0.5 AU that is much brighter than the surrounding disk on account of direct illumination by the star. Interior to the wall, a sharp transition occurs to a region of lower dust surface density and correspondingly weak or absent 7 millimeter emission.
4.2. Disk Clearing
The resolved observations bolster the inference from SED models that the TW Hya disk has an inner hole of much reduced dust column density of radius AU. Theories of disk-planet interaction have long predicted the opening of gaps in circumstellar disks as a consequence of the formation of giant planets (e.g. Lin & Papaloizou, 1986; Bryden et al., 1999), and numerical simulations of such interactions produce these gaps in a consistent way across differing architectures and computational algorithms (de Val-Borro et al., 2006). Recent work by Varnière et al. (2006) has shown that in turbulent disks with -viscosity, inner holes are in fact more likely than gaps as a consequence of the formation of Jupiter-mass planets around solar mass stars, as the process of outward angular momentum transfer mediated by spiral density waves can cause clearing of the inner disk on time scales an order of magnitude shorter than the viscous timescale.
While the inner disk is largely cleared, it is not entirely devoid of gas and dust. Optical emission lines indicate gas accretion (Muzerolle et al., 2000), albeit at the low rate of M☉ yr-1. Rettig et al. (2004) detect g of warm CO at distances of 0.5-1 AU from the star, and Herczeg et al. (2004) infer the presence of warm H2 within 2 AU of the star by modeling the HST and FUSE H2 emission spectrum. The 10 m silicate feature (Sitko et al., 2000; Uchida et al., 2004) indicates that there must be at least a few tenths of a lunar mass of dust grains present in the otherwise largely cleared inner disk (Calvet et al., 2002). The region within 0.3 AU has been spatially resolved by Eisner et al. (2006) at 2 m using the Keck interferometer, detecting emission from optically thin, submicron-sized dust populating the inner regions. This small amount of material may be the result of a restricted flow through the transition region at AU from the massive reservoir of the outer disk. A population of micron-sized grains in the inner disk is consistent with the predictions of Alexander & Armitage (2006), who show that planet-induced gaps tend to filter out and confine large grains at the gap edge while allowing small grains to migrate across the gap with accreting gas and populate the inner disk. Our data are consistent with an inner region devoid of 7mm dust emission; however, the degree of clearing is difficult to constrain due to both the low signal-to-noise ratio at long baselines and the dependence on the wall model adopted.
The dynamical effect of a planet is not the only possible explanation for the observed central flux deficit at millimeter wavelengths. Photoevaporation of gas by ultraviolet radiation has also been invoked to explain inner disk clearing (Clarke et al., 2001), if the evaporation rate at the gravitational radius dominates the accretion rate. As discussed by Alexander et al. (2006), TW Hya is at best marginally consistent with a photoevaporation scenario, since the outer disk mass is larger than predicted for photoevaporation, and the observed accretion should occur only for the brief period while the inner disk is draining onto the star. In contrast with the case of a planet-induced gap, photoevaporation should also clear the inner disk of all but the largest grains, as noted by Alexander & Armitage (2006). Other mechanisms, such as photophoretic effects (Krauss & Wurm, 2005), could also aid in clearing the inner disk region, if gas densities are high enough.
5. Conclusions
We present new, spatially resolved observations of the TW Hya disk at 7 millimeters that provide direct evidence for a sharp transition in dust surface density at AU radius, a feature consistent with the inner hole inferred from SED modeling by Calvet et al. (2002). The interpretation of the mid-infrared flux deficit as a central clearing of material is robust. The TW Hya system is ideally suited to future observations that will be able to distinguish between the various scenarios invoked to explain central clearing in the disks around young stars. Signatures diagnostic of planets in formation, in particular spiral density waves in the disk and thermal emission from circumplanetary dust, should be within the detection capabilities of the Atacama Large Millimeter Array operating at the shortest submillimeter wavelengths (300 m) and at the longest baselines ( km) to achieve the necessary angular resolution (Wolf & D’Angelo, 2005). Such observations will benefit from the close proximity of TW Hya, the nearly face-on viewing geometry, and the size scale of the inner hole now confirmed by direct observation at millimeter wavelengths.
Appendix A Protoplanetary Disk Visibility Functions
We analyze a simplified disk model parameterized by power law distributions in surface density and temperature and including a central hole, to illustrate how the model parameters affect the shape of the visibility function. We also discuss the visibility function of a model consisting of a thin ring. For both cases, we provide analytical expressions for calculating the position of the null in the (deprojected) visibility function, which is an easily observed feature.
A.1. Power-Law Disk with a Central Hole
For a flat, optically thin disk described by power-law distributions in temperature and surface density, assumed to be radiating in the Rayleigh-Jeans limit and viewed face-on, the intensity of radiation as a function of radial angular scale from the center of the disk is
| (A1) |
The visibility as a function of (u,v) distance, , is given by the Fourier transform of the intensity:
| (A2) |
where is a zeroeth order Bessel function. The integral term in the above expression can be evaluated as
| (A3) |
where
| (A4) |
and is a generalized hypergeometric function of one variable. For a disk with an inner hole, the limits of integration and are the inner and outer angular radii of the disk, respectively.
For characterizing the visibility function on angular scales between and , we can make the approximation and . In these limits, the hypergeometric function attains manageable analytic forms.
For , appropriate for the inner disk of radius , the function has the following series expansion:
| (A5) |
and in this limit the quantity goes to
| (A6) |
with the limit approximated by the sum in A5 above.
In the limit of , appropriate for the outer radius , the quantity approaches the analytical form
| (A7) |
The total visibility function (A2, with integral A3) is then the difference between a smooth power-law disk without a hole (, equation A7) and the contribution of the evacuated inner region (, equation A6 with limit A5).
A.1.1 Position of the Null


For a disk with an inner hole, the position of a null in the visibility function is an easily observed quantity. Here we show how the angular scale of the first null depends on the disk model parameters. Substituting expansion A5 and equation A7 into A3 and setting the result equal to zero, we obtain the following expression which can be solved for the position of the first null:
| (A8) |
Since and always appear in tandem in this expression, .
The dependence of the null position on the power law indices and is illustrated in Figure 3, which shows the null position as a function of for a fixed inner disk radius. Several orders of the power series expansion (A5) are shown. For typical values of the power law indices, the null position shifts monotonically to longer baselines as increases, exhibiting an essentially linear relationship in the vicinity of =2. As increases, the temperature and surface density distributions (and therefore the intensity) become more sharply centrally peaked, and so the position of the null, which is effectively the angular scale on which the inner disk contribution to the visibility equals that of the outer disk, moves to smaller and smaller angular scales (i.e., larger ).
These approximations begin to lose validity longwards of the vicinity of the first null, which occurs at for all . The series expansion quickly diverges past . However, it should be also noted that this constraint places no limit on the size of the hole that can be investigated by this method, i.e., for any disk with a central hole there will always be at least one null shortward of =1, and so this method is robust for any case in which is large compared to . It is also valid for an inclined (symmetric) disk, as long as the deprojection is handled appropriately, as in §3.2.
For ease of use, it is possible to approximate the dependence by a linear fit of the curve in the region , which results in the following formula for the position of the null, good to within 4%:
| (A9) |
A.2. Thin Wall
A thin wall ( R) can be described by a ring of constant brightness at a distance from the star, with a visibility function which is a zeroeth order Bessel function:
| (A10) |
where is the angular radius of the hole and is the intensity of emission from the wall. The position of the null in the visibility function of a thin wall will then be
| (A11) |
A.3. Application to TW Hya
The TW Hya disk has an outer radius of 196 AU (CO emission, Qi et al. (2004)) and an inner hole with radius 4 AU (SED models, Calvet et al. (2002); imaging, this paper). These size scales correspond to (u,v) distances of 54 k 2600 k, a range well matched to the coverage of the Very Large Array 7 millimeter observations, and we may apply the method of §A.1 to generate the visibility function based on the simple power-law disk model. Approximating the Calvet et al. (2002) model with power laws in surface density and temperature yields the profile and where = 28 K, =0.44, =3.7, and =0.90 For the dust opacity, we adopt a power-law distribution with , where , Hz, and (D’Alessio et al., 2001). Figure 4 shows the visibility function calculated according to equation A2 with the limits as in equations A5 and A7, expanding to third order in . The resulting curve agrees well with the visibility function derived for the power law disk model obtained with the full radiative transfer calculation, shown in Figure 2 (light solid line). Figure 4 also shows the visibility function of a thin ring interior to the disk (dotted line), as in §A.2, with radius 4 AU and flux 1.7 mJy.
References
- Alexander & Armitage (2006) Alexander, R. D. & Armitage, P. J. 2006, ArXiv Astrophysics e-prints
- Alexander et al. (2006) Alexander, R. D., Clarke, C. J., & Pringle, J. E. 2006, MNRAS, 369, 229
- Boss & Yorke (1993) Boss, A. P. & Yorke, H. W. 1993, ApJ, 411, L99
- Boss & Yorke (1996) —. 1996, ApJ, 469, 366
- Bryden et al. (1999) Bryden, G., Chen, X., Lin, D. N. C., Nelson, R. P., & Papaloizou, J. C. B. 1999, ApJ, 514, 344
- Calvet et al. (2002) Calvet, N., D’Alessio, P., Hartmann, L., Wilner, D., Walsh, A., & Sitko, M. 2002, ApJ, 568, 1008
- Calvet et al. (2005) Calvet, N., et al. 2005, ApJ, 630, L185
- Clarke et al. (2001) Clarke, C. J., Gendrin, A., & Sotomayor, M. 2001, MNRAS, 328, 485
- D’Alessio et al. (2001) D’Alessio, P., Calvet, N., & Hartmann, L. 2001, ApJ, 553, 321
- de Val-Borro et al. (2006) de Val-Borro, M., et al. 2006, MNRAS, 370, 529
- Eisner et al. (2006) Eisner, J. A., Chiang, E. I., & Hillenbrand, L. A. 2006, ApJ, 637, L133
- Herczeg et al. (2004) Herczeg, G. J., Wood, B. E., Linsky, J. L., Valenti, J. A., & Johns-Krull, C. M. 2004, ApJ, 607, 369
- Hogerheijde & van der Tak (2000) Hogerheijde, M. R. & van der Tak, F. F. S. 2000, A&A, 362, 697
- Kastner et al. (1997) Kastner, J. H., Zuckerman, B., Weintraub, D. A., & Forveille, T. 1997, Science, 277, 67
- Krauss & Wurm (2005) Krauss, O. & Wurm, G. 2005, ApJ, 630, 1088
- Krist et al. (2000) Krist, J. E., Stapelfeldt, K. R., Ménard, F., Padgett, D. L., & Burrows, C. J. 2000, ApJ, 538, 793
- Lay et al. (1997) Lay, O. P., Carlstrom, J. E., & Hills, R. E. 1997, ApJ, 489, 917
- Lin & Papaloizou (1986) Lin, D. N. C. & Papaloizou, J. 1986, ApJ, 309, 846
- Mamajek (2005) Mamajek, E. E. 2005, ApJ, 634, 1385
- Muzerolle et al. (2000) Muzerolle, J., Calvet, N., Briceño, C., Hartmann, L., & Hillenbrand, L. 2000, ApJ, 535, L47
- Qi et al. (2004) Qi, C., et al. 2004, ApJ, 616, L11
- Rettig et al. (2004) Rettig, T. W., Haywood, J., Simon, T., Brittain, S. D., & Gibb, E. 2004, ApJ, 616, L163
- Roberge et al. (2005) Roberge, A., Weinberger, A. J., & Malumuth, E. M. 2005, ApJ, 622, 1171
- Sitko et al. (2000) Sitko, M. L., Lynch, D. K., & Russell, R. W. 2000, AJ, 120, 2609
- Trilling et al. (2001) Trilling, D. E., Koerner, D. W., Barnes, J. W., Ftaclas, C., & Brown, R. H. 2001, ApJ, 552, L151
- Uchida et al. (2004) Uchida, K. I., et al. 2004, ApJS, 154, 439
- van Dishoeck et al. (2003) van Dishoeck, E. F., Thi, W.-F., & van Zadelhoff, G.-J. 2003, A&A, 400, L1
- Varnière et al. (2006) Varnière, P., Blackman, E. G., Frank, A., & Quillen, A. C. 2006, ApJ, 640, 1110
- Weinberger et al. (2002) Weinberger, A. J., et al. 2002, ApJ, 566, 409
- Weintraub et al. (1989) Weintraub, D. A., Sandell, G., & Duncan, W. D. 1989, ApJ, 340, L69
- Wilner et al. (2003) Wilner, D. J., Bourke, T. L., Wright, C. M., Jørgensen, J. K., van Dishoeck, E. F., & Wong, T. 2003, ApJ, 596, 597
- Wilner et al. (2005) Wilner, D. J., D’Alessio, P., Calvet, N., Claussen, M. J., & Hartmann, L. 2005, ApJ, 626, L109
- Wilner et al. (2000) Wilner, D. J., Ho, P. T. P., Kastner, J. H., & Rodríguez, L. F. 2000, ApJ, 534, L101
- Wolf & D’Angelo (2005) Wolf, S. & D’Angelo, G. 2005, ApJ, 619, 1114
- Zuckerman et al. (1995) Zuckerman, B., Forveille, T., & Kastner, J. H. 1995, Nature, 373, 494