IRAC Observations of CO High-Velocity Cloud in the 30 Doradus Complex in the Large Magellanic Cloud
Abstract
We present the results of 12CO observations of the X-ray bright giant shell complex 30 Doradus in the Large Magellanic Cloud (LMC) using the Antarctic Submillimeter Telescope and Remote Observatory (AST/RO). This is the one of the largest H II complexes in the Local Group. We compare the 12CO observations against previously taken 12CO observations and analyze the spatial distribution of young stellar objects (YSO’s) within the cloud using the Spitzer IRAC observations of the 30 Doradus complex. Both peaks of 12CO and emitting clouds coincide with the densest region of the filaments where multiple shells are colliding. We find that the YSO’s are clustered in the southern ridge of the warm and dense molecular gas clouds traced by 12CO , indicating a filamentary structure of star formation throughout the 30 Doradus. We also find that some of Class I YSO’s candidates which are likely to be Associated with a high-velocity component of 12CO emitting clouds are present. This is a bona fide place where the triggered star formation had happened and newly formed stars may have produced such a high-velocity outflow interacting with the surrounding molecular cloud material.
1 Introduction
The Large Magellanic Cloud (LMC) provides an excellent opportunity to study the effects of radiation from young star objects (YSO’s) on their multi-phase interstellar medium (ISM). The LMC has a 27-degree incline to the line-of-sight and has small foreground and internal extinctions, making it possible to map the gas and dust of the ISM in the LMC without confusion with extraneous matter along the line-of-sight. The LMC stars are at a common distance from the Earth, unlike stars inside of the Milky Way’s galactic plane, but are still close enough that individual stars and their stellar ejecta can be studied in great detail. We have chosen the 30 Doradus nebula inside of the LMC in particular given that Kim et al. (2005) detected a high-velocity molecular emission associated with the H II and H I shells, indicating that this is a very active region of star formation. Additionally, the LMC provides an excellent opportunity to study the effects of different UV radiation from stars on their environments in the multi-phase ISM, as well as to apply their observed mechanisms to studies of the early evolution of high-redshift, metal-poor galaxies. CO is the chosen species to trace the general distribution of molecular gas because it is the most abundant observable tracer of H2 and is sensitive to a density regime prevalent in the diffuse molecular gas surrounding dark clouds, molecular cores, and star-forming regions. For Galactic work, the 12CO line is usually saturated and an isotope replacement molecule such as 13CO is needed to obtain better information on column densities and cloud sizes. In the LMC, and therefore in 30 Doradus as well, the diffuse CO component is weaker due to lower abundance and higher photodissociation rates, so 12CO is a less-biased molecular tracer which leads an assumption that the cloud is virialized and a reliable estimate of X conversion factor (Dickman 1978).
The present study aimed to characterize the relationship between the warm and dense core of the molecular clouds traced with 12CO and the distribution of young stars across the clouds in the 30 Doradus nebula. The mid- CO emissions in the 30 Doradus region have recently been observed with the Antarctic Submillimeter Telescope and Remote Observatory (AST/RO) and 12CO emission from the 30 Doradus reveal the extended structure beyond the 12CO emitting region. With the advent of the Spitzer Space Telescope, the distribution of young stellar objects across the region can be mapped with the Spitzer/IRAC photometry (Meixner et al. 2006). Jones et al. (2005) provide comprehensive study of protostars in the giant H II region complex N159 in the LMC with the Spitzer IRAC observations. In this paper, color-color and color-magnitude diagram for Spitzer/IRAC sources have been used to study the nature of distributed populations and their locations in the molecular clouds in the 30 Doradus in conjunction with the mid- CO emissions observed with the AST/RO.
2 Observations
The observations of 12CO emission lines were performed during the austral winter season of 2002 and 2003 at the Antarctic Submillimeter Telescope and Remote Observatory (AST/RO), a 1.7-m diameter, offset Gregorian telescope. AST/RO is located at 2847 m altitude at the Amundsen-Scott South Pole Station and capable of observing at wavelengths between 200 m and 1.3 mm (Stark et al. 2001). This site is very dry, so it is therefore a very good position from which to make submillimeter observations (Chamberlin, Lane, & Stark 1997). Since the observations of 12CO emission line are described in Kim et al. (2005), we mention only the observations of 12CO emission taken with the AST/RO in this paper.
Emission from the 12CO line was mapped over a 30′ 30′ region centered on R.A.=, Dec.=-69 (J2000) with 90′′ spacing and a beam size of about 180′′. The position switching mode was used and observation time at each position was typically 7 minutes and 20 seconds. The receiver used was a 230 GHz superconductor-insulator-superconductor (SIS) waveguide receiver with 7990 K double-sideband (DSB) noise temperature. Two acousto-optical spectrometers (Schieder, Tolls, and Winnewisser 1989) were used as backends. AST/RO had four available acousto-optical spectrometers (AOSs). An array AOS having four low-resolution spectrometer (LRS) channels with a bandwidth of 1 GHz (bandpass 1.62.6 GHz) and a resolution of 1 MHz corresponding to a velocity resolution of 1.3 km/s has been used for 230 GHz observation. LRS has 2048 channels. AST/RO suffers pointing errors of the order of , and the beam sizes (FWHM) were – at 230 GHz. Atmosphere-corrected system temperatures ranged from 309 to 364 K at 230 GHz.
The standard chopper wheel calibration technique was employed, implemented at AST/RO by way of regular (every few minutes) observations of the sky and two blackbody loads of known temperature (Stark et al. 2001). Atmospheric transmission was monitored by regular skydips, and known, bright sources were observed every few hours to further check calibration and pointing. At periodic intervals and after tuning, the receivers were manually calibrated against a liquid-nitrogen-temperature load and the two blackbody loads at ambient temperature and about 100 K. The latter process also corrects for the dark current of the AOS optical CCDs. The intensity calibration errors became as large as % during poor weather periods.
Once taken, the data in this survey were reduced using the COMB data reduction package. After elimination of scans deemed faulty for various instrumental or weather-related reasons ( of the total dataset), the data were Fourier transformed and the second highest amplitude channel was zeroed out, so well-defined baseline component was removed. Then, linear baselines were removed from the spectra. This is shown in Figure 1. The Fourier transforms are done using fast Fourier transform techniques and the spectrum is padded with zeros on the right to the next biggest power of 2 (e.g. 2048 channels). After a Fourier transform of the plotted channels of the original full spectrum were done and then selected high amplitude channel was removed, the data were re-transformed and inserted back into the original spectrum. Since the operations are all done in double precision, there is no loss of accuracy.
In order to detect young stellar objects (YSOs), we used the Spitzer archival data of 30 Doradus nebula (AORKEY 4379904) observed with the Infrared Array Camera (IRAC). IRAC data consist of four broadband images, each of which has a central wavelength of 3.6, 4.5, 5.8, and 8.0m (Fazio et al. 2004). (catalog ADS/Sa.Spitzer#0004379904) First, we performed an array-location-dependent photometric correction on the Basic Calibrated Data (BCD) processed by the IRAC pipeline (version S13.2.0). This correction is required because the pipeline flat-fielding based on the zodiacal background is not appropriate for point source analysis. In the next step, we corrected “muxbleed” and “column pulldown” effects, which are image artifacts that appear around bright sources, and matched background levels of overlapping frames. Finally, mosaicked images were made from these corrected images using MOPEX mosaicker which is provided by the Spitzer Science Center (SSC).
Source extraction and aperture photometry were performed using the Spitzer Astronomical Point Source Extractor(APEX) with 5 pixel aperture radius and 5-10 pixel background annulus. Pixel phase corrections, which correct the dependence of photometry on the location of a source within its peak pixel, were applied on the photometry of channel 1, and aperture corrections were applied on all channels. Then, we converted flux densities into magnitudes using the IRAC zero-magnitude flux densities. All the values used for corrections and calculations were obtained from the IRAC Data Handbook version 3.0 (http://ssc.spitzer.caltech.edu/irac/dh/).
3 Results
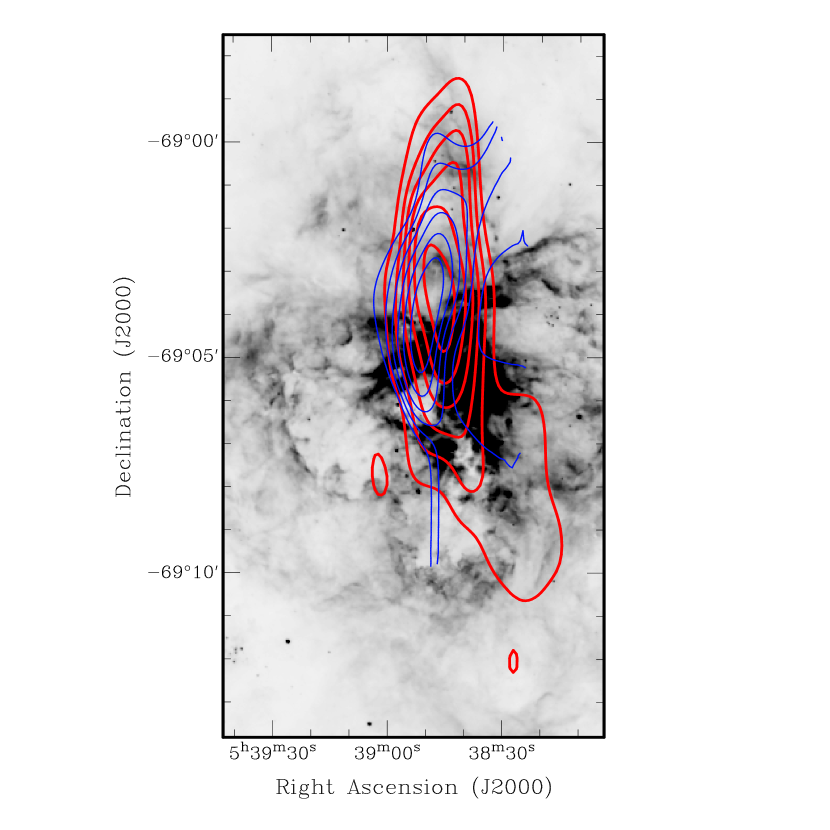
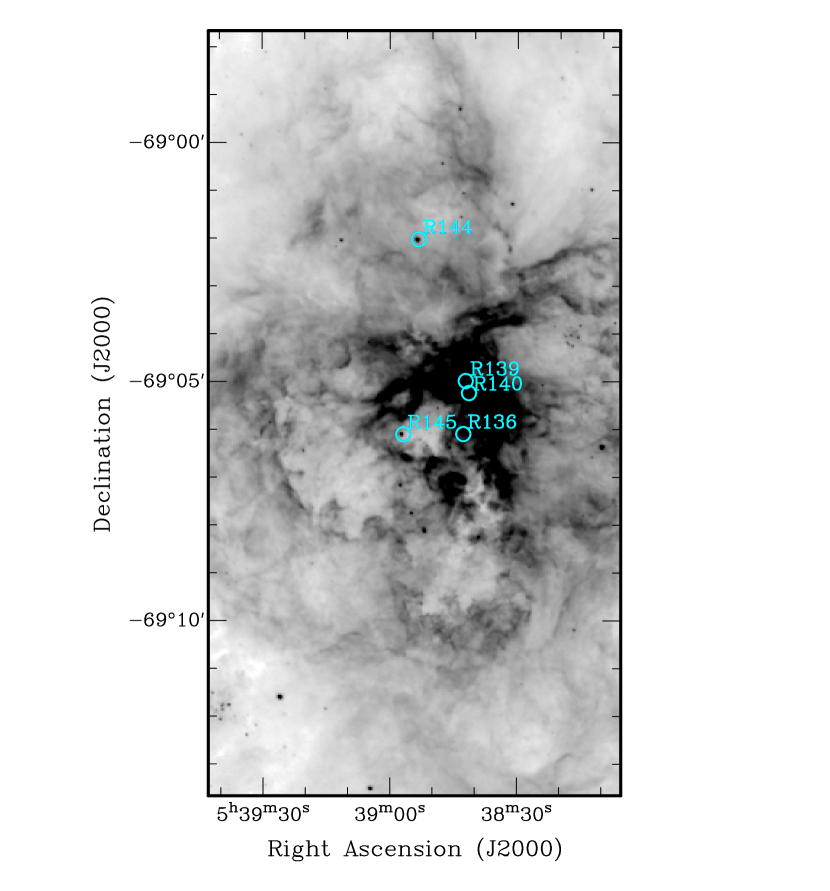
We have observed 12CO line emission associated with the 30 Doradus nebula in the LMC (Figure 2). The peak of 12CO emission is only 40′′ away from the peak of 12CO emission. Including the pointing error and the beam size of 12CO emission, the peak in 12CO emission is very close to that in 12CO emission. Both peaks are not associated with the R136 cluster. Instead they are surrounded by R145 (WN6h), R139 (O6Iaf/WN)/R140 (WN6), and R144 (WN6h) multiple system north of the R136 cluster (see Figure 2).
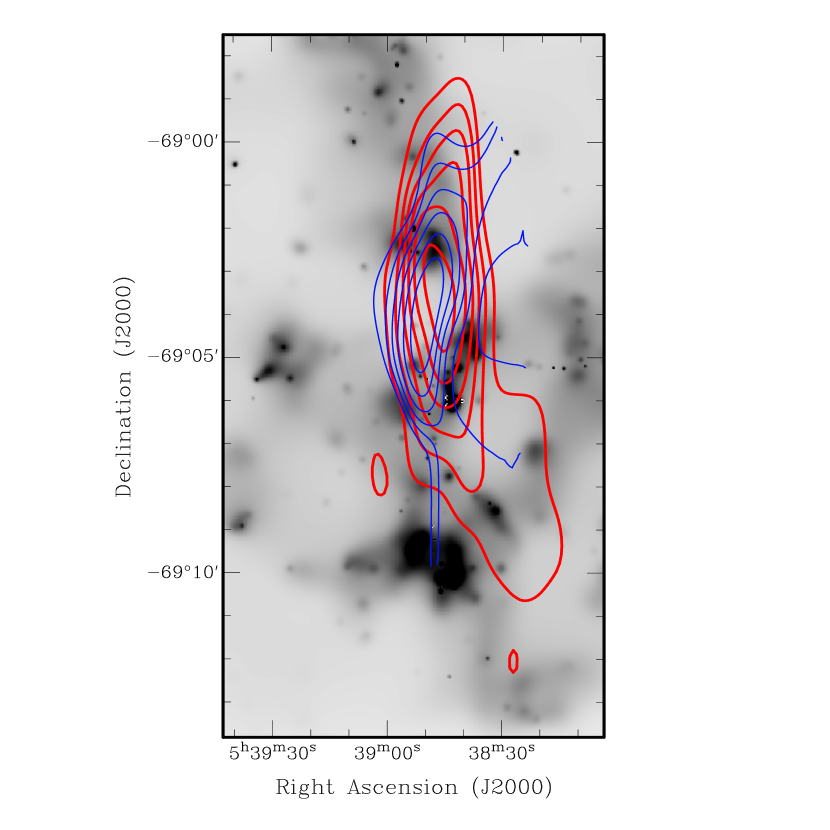
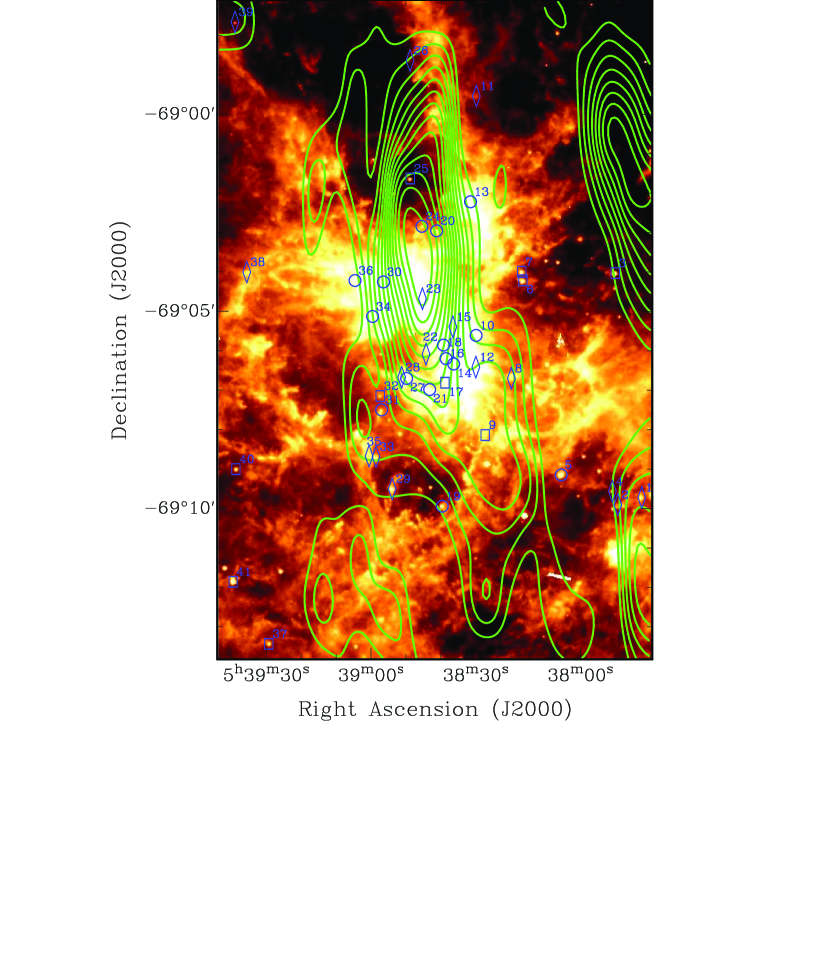
The peaks of 12CO and 12CO emissions are spatially distanced from the peaks of H and X-ray emissions as seen in Figure 2 and Figure 3 as it is expected. The apparent H II regions and the bright X-ray counterparts in this region indicate that both the fully ionized regions close to the massive stars, with the related ionizing radiation escaping from the H II regions, heat the H molecules and keep them dissociated. The morphology of H emission is almost identical to that of 8 m emission (Figure 4), tracer of Polycyclic Aromatic Hydrocarbon (PAH) emission, indicating that the PAH is only partially destroyed in the H II region. This is in contrast to the pretty good correlation shown in the SAGE study by Meixner et al. (2006) and SINGS study by Regan et al. (2006). High-velocity 12CO emitting gas detected in this region (Kim et al. 2005; Kim 2006) and the morphology of 12CO emission indicate that the bulk of the CO emission must come from the entrainment of ambient atomic and molecular cloud gas by the stellar winds colliding with one another seen in the H image (Figure 2). Using the best estimate of the luminosity mass for 12CO outflow (Kim et al. 2005), 2.61.6 104 , and the dynamical age of the shells, 10 Myr, we estimate the rate of ambient gas entrainment to be =2.6 10-3 yr-1 with the product of preshock density and velocity, approximately 18 cm-3 km s-1. The momentum injection rate is km s-1yr-1 and the mechanical luminosity is to be =5.4 102 .
We detected the near-IR sources associated with the molecular cloud core in the 12CO and 12CO emitting clouds in the 30 Doradus nebula by utilizing Spitzer GTO IRAC observations. We identified YSO candidates among these sources from the color-color diagram of 3.6 m 4.5 m versus 5.8 m 8.0 m (Figure 5a), and classified them into three groups based on the criterion suggested by Allen et al. (2004). Since the reddening vector for 30 Doradus is about 1.3 mag, it can only change the colors of [3.6 m][4.5 m]=0.01 mag and [5.8 m][8.0 m]=0.02 mag (Rieke and Lebofsky 1985). This is too small to affect the classification. These classes show the evolutionary sequence from Class I to Class III. Class I objects are surrounded by infalling envelopes, Class II objects have accretion disks, and Class I/II objects are in an intermediate state between Classes I and II (Kenyon & Hartmann 1995, Megeath et al. 2004). They are denoted by open circles (Class I), squares (Class II), and diamonds (Class I/Class II) respectively in Figure 5. Class III objects were excluded from the classification because they have the SEDs of stellar photospheres and cannot be distinguished from foreground or background stars. Since the brightness of 8 m emission can be affected by PAH emission arising from the 30 Doradus nebula, we present the color-color diagram of 3.6 m 4.5 m versus 4.5 m 5.8 m in Figure 6. It confirms that the classified objects in Figure 5a fall in a relatively well-defined region of the colorcolor diagram in Figure 6. The distinction is clear. The only problem is that the 30Dor-09 object identified as Class II in Figure 5a shows much redder [4.5 m][5.8 m] color 1.7. This object was identified as M red supergiant star, Dor IR 10 by McGregor & Hyland (1981) using the photometry and IR spectroscopy. They also found 11 other M red supergiants in the 30 Doradus, but we could not find any corresponding sources associated with our classified YSO’s catalog. Previous study by Brandner et al. (2001) reports 20 Class I protostars and Herbig Ae/Be candidates near R136 cluster in the 30 Doradus complex using color-color diagram. 8 of these sources could be matched with the YSO population traced by present IRAC data analysis. Figure 5b shows the location of these objects on the color-magnitude diagram of 3.6 m 8.0 m versus 8.0 m using the above symbols. Class I objects show strong 3.6 m 8.0 m color excess with color indices of approximately 4, while most of Class II objects show relatively weak 3.6 m 8.0 m color excess with indices from 1 to 2.
4 Discussion
An HI aperture synthesis mosaicked map of the LMC with a spatial resolution of 50′′, created by combining 1344 separate pointings of the Australia Telescope Compact Array (ATCA), shows an overall clumpy HI distribution featuring holes, shells, loops, filaments, and bubbles (Kim et al. 2003; Kim et al. 1998; Kim et al. 1999). The HI supergiant shells occupy a large volume of the ISM and a large number of giant shells, contained within each supergiant, are colliding with one another. The many shells observed often overlap and are interacting with one another, such as in the vicinity of the 30 Doradus complex where very active star formation has been happening simultaneously in many different centers.
A number of the smaller shells formed on the rims of supergiant shells and are found in regions of very active star formation in the LMC (Kim et al. 1999). Recent submillimeter observations of the LMC supershells and superbubbles in the LMC using the Antarctic Submillimeter Telescope and Remote Observatory (AST/RO) aimed to look for the place where the triggered star formation had happened and found the 12CO emission toward the rim of the expanding giant H II complex in the 30 Doradus (Kim et al. 2005). They detected a possible high-velocity molecular emission associated with the H II and H I shells in the 30 Doradus nebula. This observational fact has been understood as the result of self-propagating star formation, where gravitational instabilities in the swept-up material of the supergiant shell caused fragmentation and a new round of star formation. Newly formed stars may have produced such a high velocity molecular outflows interacting with the surrounding molecular cloud material. Outflows and jets are commonly seen in the ambient medium of young stellar objects.
It is commonly accepted that stars form in molecular clouds by the gravitational collapse of dense gas. Both low and high mass young stellar objects are embedded in the parent molecular and cause the heating of the surrounding gas. Often outflows from young stellar objects accelerate gas and are observed as molecular outflows. The radiative heating and magnetic fields are likely to be the main energy sources driving outflows for both low and high mass young stellar objects. Using the recent Spitzer IRAC observations of 30 Doradus complex, we examine young stellar objects traced by IRAC data which might be associated with the high-velocity components of 12CO emitting clouds.
A total of 41 YSO candidates, which fall close to the core of the 12CO and 12CO emitting clouds, were detected and classified from the IRAC survey of 30 Doradus . We present our photometry results and classes in Table 1. Figure 4 presents the spatial distribution of detected YSO candidates towards the relatively dense molecular cloud core found in the 12CO and 12CO emitting gas. A strong association is not found between the location of YSO candidates and of dense molecular cloud core as seen in Figure 4. However, Class I candidates which are thought to be protostars surrounded by dusty infalling envelopes and exhibit significant near-infrared extinction from their envelopes are very close to the peaks of 12CO and 12CO emissions. Conspicuously, Class I YSO 30 Dor-30 is detected near the high-velocity component of 12CO emission. 13 YSO candidates are concentrated in the southern region of the 12CO emitting cloud, about 30 pc away from the molecular cloud core. Association densities are likely to be as low as 10-4 stars pc-3 at the distance of the LMC (Feast 1991) and correspond to the number density of molecular hydrogen () of 104 molecules cm-3 (Kim 2006). It is notable that the relationship between the number of YSO candidates And their radial distribution from the core (Figure 4) reveals that more recently formed stars (Class I objects) are distributed more closely to the molecular cloud core.
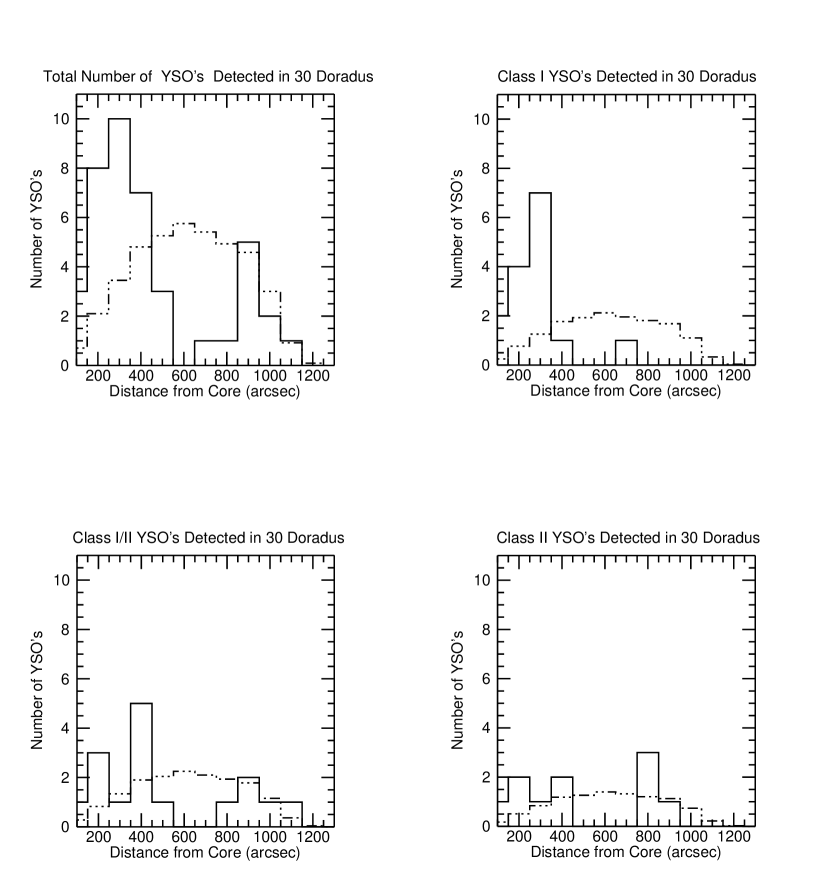
Figure 7 presents an analysis that measures the distance of the YSO’s to the core of the CO cloud. The method performed was similar to one present in the paper by Teixeira et al. (2006), except that the measured variable is different. We utilized a Monte Carlo simulation to analyze the difference between the observed spatial distribution and a randomly generated star field. We created 10,000 star fields with an equal number of randomly and uniformly placed YSO’s in an equal observing area. The average distance to the cloud core of these objects was calculated and presented in a histogram to be compared with the distances of the observed YSO’s. These comparisons show that there is a structural arrangement of YSO’s with respect to the core of the CO cloud in the 30 Doradus Nebula, likely to be a filamentary distribution. In the total distribution of all classes, we find that there is a probability of 0.15% of having more than 9 objects placed between 200 and 300 arcseconds from the core. This seems to be mostly due to the Class I YSO’s given that there is a 0.02% probability of finding more than six Class I YSO’s at that same distance. We can see that Class I/II YSO’s are absent at this distance, but using the next bin (300-400 arcsec) we find that at its peak the Class I/II YSO’s have a probability of 3.41% of having more than 4 objects. Class II objects also follow the general distribution of the other two previous classes, but are too few and therefore tests are inconclusive.
5 Conclusion
AST/RO observations have revealed that the peaks of 12CO and 12CO emission are located at the rims of colliding H II shells (Chu and Kennicutt 1994) in the very active star-forming region in the 30 Doradus complex in the LMC. Previous studies by Kim et al. (2005) show that 12CO emission has a high-velocity component corresponding to the peak of the emission. This region must be the place where the triggered star formation had happened since newly formed stars may have produced such a high-velocity molecular outflow interacting with the surrounding molecular cloud material. Using the recent Spitzer IRAC observations of 30 Doradus complex, we find that Class I YSO’s candidates are prone to be associated with the high-velocity component of 12CO emitting clouds. We also discover that the YSO’s are clustered in the southern ridge of the relatively warm and dense molecular cloud cores traced by 12CO , indicating a filamentary structure of star formation.
References
- (1) Allen, L. E., et al. 2004, ApJS, 154, 363
- (2)
- (3) Brandner, W., Grebel, E.K., Barba, R.H., Walborn, N.R., Moneti, A. 2001, AJ, 122, 858
- (4)
- (5) Chamberlin, R., Lane, A. P., Stark, A. A. 1997, ApJ, 476, 428
- (6)
- (7) Dickman, R.L. 1978, ApJS, 37, 407
- (8)
- (9) Fazio, G. G., et al. 2004, ApJS, 154, 10
- (10)
- (11) Feast, M. W. 1991, IAU Symposium, 148, 1
- (12) Appl. Superconductivity, 7, 2582
- (13)
- (14) Jones, T.J., Woodward, C.E., Boyer, M.L., Gehrz, R.D., & Polomski, E. 2005, ApJ, 620, 731
- (15) Kenyon, S. J., & Hartmann, L. 1995, ApJS, 101, 117
- (16)
- (17) Kim, S., Martin, C., Stark, A. A., & Lane, A. P. 2002, ApJ, 580, 896
- (18)
- (19) Kim, S. Staveley-Smith, L., Dopita, M.A., Freeman, K.C., Sault, R.J., Kesteven, M.J., McConnell, D. 1998, ApJ, 503, 674
- (20)
- (21) Kim, S., Dopita, M.A., Staveley-Smith, L., & Bessell, M. 1999, AJ, 118, 2797
- (22)
- (23) Kim, S., Staveley-Smith, L., Dopita, M. A., Sault, R. J., Freeman, K. C., Lee, Y., &
- (24) Chu, Y.-H. 2003, ApJS, 148, 473
- (25)
- (26) Kim, S., Walsh, W., Xiao, K. 2004, ApJ, 616, 865
- (27)
- (28) Kim, S., Walsh, W., Xiao, K., & Lane, A.P. 2005, AJ, 130, 1635
- (29)
- (30) Kim, S. 2005, JKAS, 38, 365
- (31)
- (32) Kim, S. 2006, PASP, 118, 94
- (33)
- (34) McGregor, P., & Hyland, A.R. 1981, ApJ, 250, 116
- (35)
- (36) Megeath, S. T., et al. 2004, ApJS, 154, 367
- (37)
- (38) Meixner, M. et al. 2006, AJ, 132, 2268
- (39)
- (40) Rieke, G.H., Lebofsky, M.J. 1985, ApJ, 288, 618
- (41)
- (42) Schieder, R., Tolls, V., & Winnewisser, G. 1989, Experimental Astronomy, 1, 101
- (43)
- (44) Stark, A. A. et al. 2001, PASP, 113, 567
- (45)
| ID | RA (J2000) | DEC (J2000) | 3.6 m | 4.5 m | 5.8 m | 8.0 m | Class |
|---|---|---|---|---|---|---|---|
| 30Dor-01 | 05 37 42.70 | -69 09 43.20 | 12.38 0.02 | 12.17 0.03 | 9.89 0.02 | 8.19 0.02 | I/II |
| 30Dor-02 | 05 37 49.50 | -69 09 54.20 | 11.51 0.02 | 11.82 0.03 | 10.46 0.02 | 9.19 0.02 | I/II |
| 30Dor-03 | 05 37 50.50 | -69 04 01.80 | 9.25 0.02 | 8.63 0.03 | 8.01 0.02 | 7.47 0.02 | II |
| 30Dor-04 | 05 37 51.10 | -69 09 33.70 | 12.67 0.02 | 12.46 0.03 | 11.68 0.02 | 9.73 0.02 | I/II |
| 30Dor-05 | 05 38 05.70 | -69 09 09.50 | 11.06 0.02 | 10.35 0.03 | 8.92 0.02 | 7.13 0.02 | I |
| 30Dor-06 | 05 38 16.70 | -69 04 13.60 | 8.35 0.02 | 8.22 0.03 | 7.91 0.02 | 7.50 0.02 | II |
| 30Dor-07 | 05 38 17.00 | -69 04 00.60 | 8.79 0.02 | 8.62 0.03 | 8.41 0.02 | 7.77 0.02 | II |
| 30Dor-08 | 05 38 20.00 | -69 06 42.40 | 12.60 0.02 | 12.89 0.03 | 9.59 0.02 | 7.84 0.02 | I/II |
| 30Dor-09 | 05 38 27.40 | -69 08 09.00 | 12.99 0.02 | 12.27 0.03 | 10.59 0.02 | 9.83 0.02 | II (?) |
| 30Dor-10 | 05 38 30.00 | -69 05 37.40 | 10.91 0.02 | 10.05 0.03 | 9.15 0.02 | 6.87 0.02 | I |
| 30Dor-11 | 05 38 30.00 | -68 59 33.00 | 12.27 0.02 | 12.45 0.03 | 11.20 0.02 | 9.82 0.02 | I/II |
| 30Dor-12 | 05 38 30.10 | -69 06 25.60 | 11.43 0.02 | 11.18 0.03 | 8.65 0.02 | 6.87 0.02 | I/II |
| 30Dor-13 | 05 38 31.60 | -69 02 13.80 | 9.78 0.02 | 9.03 0.03 | 7.06 0.02 | 5.23 0.02 | I |
| 30Dor-14 | 05 38 36.40 | -69 06 21.00 | 10.63 0.02 | 9.28 0.03 | 8.53 0.02 | 6.88 0.02 | I**These sources correspond to the YSO candidates studied by Brandner et al. (2001). |
| 30Dor-15 | 05 38 36.60 | -69 05 24.30 | 10.74 0.02 | 10.42 0.03 | 8.29 0.02 | 6.98 0.02 | I/II |
| 30Dor-16 | 05 38 38.60 | -69 06 12.50 | 13.29 0.03 | 11.08 0.03 | 9.46 0.02 | 7.02 0.02 | I**These sources correspond to the YSO candidates studied by Brandner et al. (2001). |
| 30Dor-17 | 05 38 38.90 | -69 06 49.30 | 11.08 0.02 | 10.42 0.03 | 9.64 0.02 | 8.75 0.02 | II |
| 30Dor-18 | 05 38 39.30 | -69 05 52.20 | 11.21 0.02 | 10.28 0.03 | 8.81 0.02 | 6.87 0.02 | I**These sources correspond to the YSO candidates studied by Brandner et al. (2001). |
| 30Dor-19 | 05 38 39.60 | -69 09 57.20 | 11.76 0.02 | 11.06 0.03 | 9.40 0.02 | 7.88 0.02 | I |
| 30Dor-20 | 05 38 41.30 | -69 02 58.20 | 12.62 0.02 | 11.86 0.03 | 10.60 0.02 | 8.52 0.02 | I |
| 30Dor-21 | 05 38 43.20 | -69 06 59.80 | 10.54 0.02 | 9.67 0.03 | 8.75 0.02 | 6.52 0.02 | I**These sources correspond to the YSO candidates studied by Brandner et al. (2001). |
| 30Dor-22 | 05 38 44.30 | -69 06 05.80 | 10.89 0.02 | 10.72 0.03 | 10.50 0.02 | 8.44 0.02 | I/II**These sources correspond to the YSO candidates studied by Brandner et al. (2001). |
| 30Dor-23 | 05 38 45.30 | -69 04 41.50 | 11.08 0.02 | 10.91 0.03 | 8.33 0.02 | 6.62 0.02 | I/II**These sources correspond to the YSO candidates studied by Brandner et al. (2001). |
| 30Dor-24 | 05 38 45.40 | -69 02 51.30 | 13.87 0.02 | 13.43 0.04 | 11.06 0.02 | 9.00 0.02 | I |
| 30Dor-25 | 05 38 48.80 | -69 01 38.60 | 9.90 0.02 | 9.59 0.03 | 9.45 0.02 | 9.00 0.02 | II |
| 30Dor-26 | 05 38 48.80 | -68 58 39.00 | 13.63 0.02 | 13.69 0.03 | 12.01 0.02 | 10.60 0.02 | I/II |
| 30Dor-27 | 05 38 49.80 | -69 06 42.80 | 10.64 0.02 | 9.81 0.03 | 9.04 0.02 | 6.84 0.02 | I**These sources correspond to the YSO candidates studied by Brandner et al. (2001). |
| 30Dor-28 | 05 38 51.20 | -69 06 41.00 | 9.87 0.02 | 9.74 0.03 | 9.18 0.02 | 7.32 0.02 | I/II |
| 30Dor-29 | 05 38 53.90 | -69 09 31.10 | 11.57 0.02 | 11.33 0.03 | 8.94 0.02 | 7.28 0.02 | I/II |
| 30Dor-30 | 05 38 56.40 | -69 04 16.10 | 10.95 0.02 | 9.01 0.03 | 7.52 0.02 | 6.25 0.02 | I**These sources correspond to the YSO candidates studied by Brandner et al. (2001). |
| 30Dor-31 | 05 38 56.90 | -69 07 30.70 | 12.48 0.02 | 11.87 0.03 | 10.26 0.02 | 8.41 0.02 | I |
| 30Dor-32 | 05 38 57.30 | -69 07 09.50 | 10.68 0.02 | 10.22 0.03 | 10.02 0.02 | 9.62 0.02 | II |
| 30Dor-33 | 05 38 58.50 | -69 08 42.10 | 12.42 0.02 | 12.42 0.03 | 9.63 0.02 | 7.88 0.02 | I/II |
| 30Dor-34 | 05 38 59.50 | -69 05 08.60 | 11.05 0.02 | 10.18 0.03 | 9.66 0.02 | 7.69 0.02 | I |
| 30Dor-35 | 05 39 00.50 | -69 08 41.00 | 12.28 0.02 | 12.42 0.03 | 10.13 0.02 | 8.48 0.02 | I/II |
| 30Dor-36 | 05 39 04.50 | -69 04 13.80 | 11.71 0.02 | 10.98 0.03 | 9.20 0.02 | 7.71 0.02 | I |
| 30Dor-37 | 05 39 29.20 | -69 13 26.60 | 9.58 0.02 | 9.17 0.03 | 8.76 0.02 | 8.34 0.02 | II |
| 30Dor-38 | 05 39 35.20 | -69 04 00.40 | 12.59 0.02 | 13.16 0.03 | 10.60 0.02 | 8.92 0.02 | I/II |
| 30Dor-39 | 05 39 38.30 | -68 57 39.90 | 13.93 0.02 | 13.84 0.03 | 12.68 0.02 | 10.26 0.02 | I/II |
| 30Dor-40 | 05 39 38.50 | -69 09 00.30 | 10.56 0.02 | 9.78 0.03 | 9.26 0.02 | 8.64 0.02 | II |
| 30Dor-41 | 05 39 39.40 | -69 11 51.80 | 8.11 0.02 | 7.88 0.03 | 7.49 0.02 | 6.98 0.02 | II |