Systematics of threshold incident energy for deep sub-barrier fusion hindrance
Abstract
We systematically evaluate the potential energy at the touching configuration for heavy-ion reactions using various potential models. We point out that the energy at the touching point, especially that estimated with the Krappe-Nix-Sierk (KNS) potential, strongly correlates with the threshold incident energy for steep fall-off of fusion cross sections observed recently for several systems at extremely low energies. This clearly indicates that the steep fall-off phenomenon can be attributed to the dynamics after the target and projectile touch with each other, e.g., the tunneling process and the nuclear saturation property in the overlap region.
pacs:
25.60.Pj, 24.10.Eq, 25.70Jj,25.70.-zRecently, for medium-heavy mass systems, it has become possible to measure fusion cross sections down to extremely low incident energies. In those measurements, unexpected steep fall-off of fusion cross sections, as compared to a standard theoretical calculation, have been observed at deep sub-barrier energies Jiang et al. (2002, 2004a, 2004b, 2005, 2006, 2006). Although the steep fall-off phenomenon, referred to as the fusion hindrance, may be accounted for if one uses an anomalously large diffuseness parameter in the Woods-Saxon potential Hagino et al. (2003), the physical origin of the phenomenon has yet to be clarified Dasgupta et al. (2006).
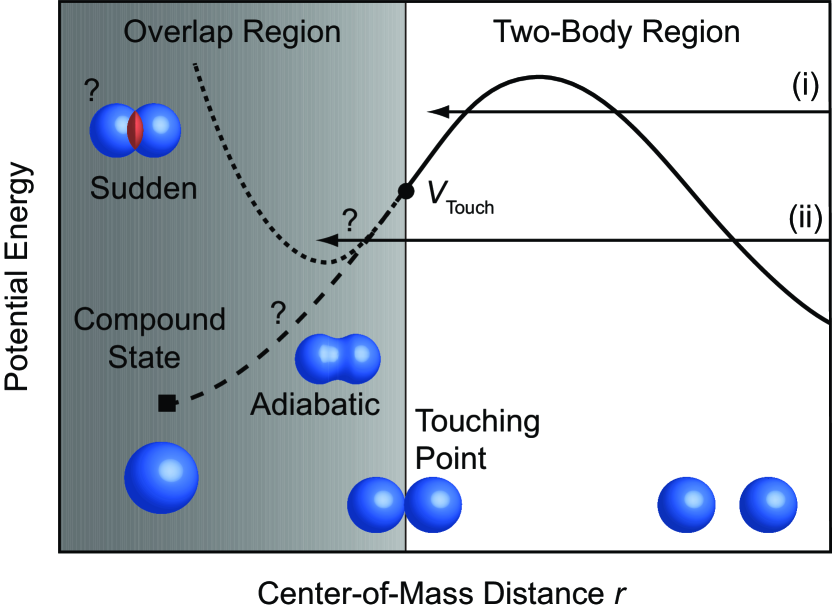
One important aspect of fusion reactions at deep subbarrier energies is that the inner turning point of the potential may be located far inside the touching point of the colliding nuclei. We show this schematically in Fig. 1. At energies close to the Coulomb barrier, the inner turning point is still far outside of the touching point Dasgupta et al. (1998) (see the line (i) in Fig. 1). At these energies, one usually assumes that a compound nucleus is automatically formed once the projectile penetrates the Coulomb barrier, due to the strong nuclear attractive force in the classically allowed region. In contrast, at energies below the potential energy at the touching point, , the inner turning point appears more inside of the touching point (see the line (ii) in Fig. 1). That is, the projectile nucleus is still in the classically forbidden region when the two colliding nuclei touch with each other. After the touching, an elongated composite system is formed, which evolves in the classically forbidden region towards a compound nucleus by overlapping between the projectile-like and the target-like fragments. Since this involves the penetration of the residual Coulomb barrier, naturally the fusion cross sections are hindered by the tunneling factor.
In this paper, we evaluate the potential energy at the touching configuration for several systems, and investigate whether the dynamics after the touching point is responsible for the steep fall-off phenomenon. In this respect, it is interesting to notice that the authors of Refs. Jiang et al. (2002, 2005) have argued that the steep fall-off phenomenon systematically takes place below a certain threshold incident energy, . We will show below that there is a strong correlation between the touching energy and the threshold energy , indicating that the density overlap in the classically forbidden region indeed plays an important role. We mention that one would have to settle a model in the overlap region, such as the adiabatic or sudden models, or some combination of these two, in order to clarify the whole dynamics of deep subbarrier fusion reactions. However, our analysis is independent of these modellings, since both the adiabatic and the sudden approaches provide a similar potential energy to each other as long as the touching point is concerned.
| System | |||||||
|---|---|---|---|---|---|---|---|
| (MeV) | (MeV) | (MeV) | (MeV) | (MeV) | (MeV) | ||
| (Type I) | |||||||
| 90Zr + 90Zr | 10733 | 0.705 | 175 1.8 | 179.9 | 169.6 | 167.6 | 175.2 |
| 90Zr + 89Y | 10436 | 0.692 | 171 1.7 | 175.2 | 164.8 | 162.4 | 170.4 |
| 90Zr + 92Zr | 10792 | 0.698 | 171 1.7 | 179.1 | 168.8 | 166.4 | 174.4 |
| 58Ni + 58Ni | 4222 | 0.536 | 94 0.9 | 93.4 | 80.8 | 79.2 | 87.5 |
| 60Ni + 89Y | 6537 | 0.592 | 123 1.2 | 125.4 | 113.6 | 111.1 | 119.8 |
| 32S + 89Y | 3026 | 0.457 | 72.6 0.7 | 72.2 | 59.7 | 56.7 | 65.4 |
| (Type II) | |||||||
| 64Ni + 100Mo | 7343 | 0.582 | 121 1.2 | 131.7 | 120.0 | 115.9 | 126.2 |
| 64Ni + 64Ni | 4435 | 0.486 | 87.3 0.9 | 89.0 | 76.1 | 71.9 | 82.9 |
| (Type III) | |||||||
| 48Ca + 48Ca | 1960 | 0.331 | 48.1 0.9 | 42.2 | 27.7 | 21.9 | 35.4 |
| 28Si + 64Ni | 1729 | 0.364 | 47.3 0.9 | 43.9 | 30.5 | 27.1 | 36.7 |
| 16O + 76Ge | 930.5 | 0.282 | 27.6 0.8 | 26.1 | 13.1 | 9.6 | 18.3 |
| (Type IV) | |||||||
| 16O + 16O | 181.0 | 0.159 | 7.1 0.8 | 2.2 | -11.4 | -13.4 | -5.4 |
| 12O + 16O | 125.7 | 0.137 | 0.2 | -13.2 | -14.8 | -7.4 | |
| 12O + 14N | 106.8 | 0.129 | -0.5 | -13.9 | -15.4 | -8.1 | |
| 12O + 13C | 89.9 | 0.114 | -1.5 | -14.9 | -16.6 | -9.3 | |
| 11O + 12C | 71.9 | 0.104 | -2.2 | -15.5 | -16.9 | -9.9 | |
| 10B + 10B | 55.9 | 0.099 | -2.2 | -15.3 | -16.0 | -9.9 |
In order to estimate the potential energy at the touching point, , we employ the Krappe-Nix-Sierk (KNS) Krappe et al. (1979), the Bass Bass (1980), the proximity Myers and Świa̧tecki (2000) and the Akyüz-Winther (AW) Broglia and Winther (1991) models. Assuming the spherical shape for both the projectile and target nuclei, the KNS potential energy at the touching point reads
| (1) |
where the functions and are defined as and , respectively. In this model, the nuclear radius is given by , and the depth constant by
| (2) |
where the effective surface energy constant is given by with . We take the parameters to be fm, MeV and from FRLDM2002 Myers and Świa̧tecki (2000), except for the radius parameter for which we slightly adjust to be fm in order to fit the experimental fusion cross sections for the 64Ni+64Ni reaction at energies above the Coulomb barrier.
The proximity potential energy at the touching point is given by
| (3) |
where . In this model, the nuclear radius is given by
| (4) |
with
| (5) | |||||
| (6) |
The value of the parameters are taken to be =1 fm, fm, =32.65 MeV, =0.757895 MeV and =35.4 MeV. The surface energy coefficient in Eq. (3) is given by . In order to fit the experimental data, we use the same prescription as in Refs. Siwek-Wilczyńska and Wilczyński (2004); Świa̧tecki et al. (2005) and subtract 3.00 MeV from the original proximity model (the last term in Eq. (3)).
The Bass potential energy at the touching point is given by
| (7) |
where the parameters and are taken as =0.0300 MeV-1 fm and =0.0061 MeV-1 fm, respectively. In the Bass model, the nuclear radius is given by . The AW potential energy at the touching point, on the other hand, reads
| (8) |
where the average surface tension is given by MeV fm-2. In this model, the nuclear radius is given by fm and the diffuseness parameter is given by fm.
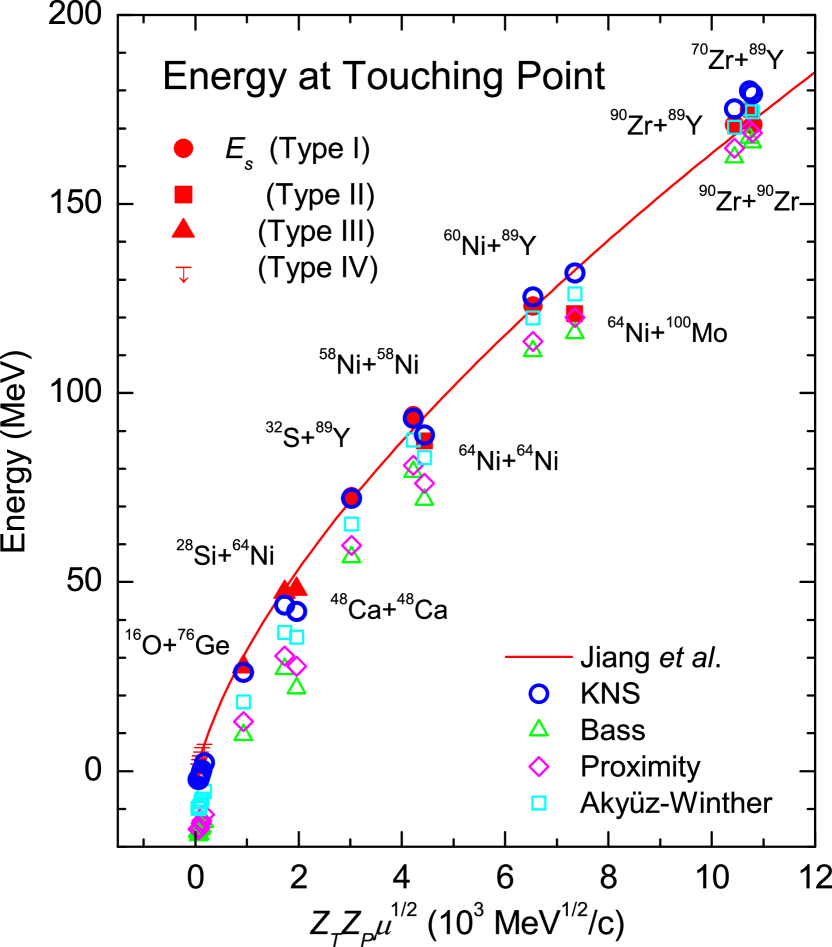
In order to estimate the total potential energy at the touching point, , one has to add the Coulomb potential to the nuclear potential energies given by Eqs. (3) - (8). To this end, we use the Coulomb potential for two point charges, , where the touching radius is specified for each model for the nuclear potential, . The resultant touching energy for the systems discussed in Ref. Jiang et al. (2006) is shown in Fig. 1 as a function of , where is the reduced mass of the colliding nuclei. The results of the KNS, the Bass, the proximity and the AW models are denoted by the open circle, the open triangle, the open diamond and the open square, respectively. All the results are summarized in Table 1. These touching energies are compared with the energy , at which the experimental fusion cross section is maximum when it is plotted in terms of the astrophysical S-factor Jiang et al. (2006). These “experimental” energies are shown in Fig. 2 by the filled circles, the filled squares, the filled triangles, and the horizontal lines, depending on the types of the system as defined in Ref. Jiang et al. (2006). Notice that the energy for the type III was estimated by extrapolation, and that for the type IV is only an upper limit. The systematics for the energy proposed by Jiang et al. Jiang et al. (2006) is also shown by the solid line.
Althogh the physical significance for the energy is not clear, because the S-factor representation for fusion cross sections would be useful only at much lower energies than the lowest energies of the current measurements, at which the outer turning point is much larger than the inner turning point (see e.g., Refs. MS73 ; SRR07 for a discussion on the modified S-factor, that takes into account the effect of the inner turning point), it is remarkable that the result of the KNS model follows closely to the energy , and thus the systematics shown by the solid line (an exceptional case of 64Ni+100Mo will be discussed in the next paragraph). The good correspondence between and may be due to the fact that the KNS model partly takes into account the saturation of nuclear matter when two nuclei come inside the Coulomb barrierIHI07 (in fact, the KNS model has been shown to be consistent with the energy density formalism with the Skyrme SkM∗ interaction Vaz et al. (1981); V. Yu. Denisov and Nörenberg (2002)). The result of the AW potential is similar to that of the KNS model, although the deviation from is slightly larger. For the Bass and the proximity models, although the dependence of the touching energy on the parameter is similar to that of the KNS and the AW models, there is a large discrepancy between the touching energy and the threshold energy .
| System | Ref. | ||||
|---|---|---|---|---|---|
| (MeV) | (MeV) | (MeV) | |||
| 34S + 89Y | 3095 | 0.444 | 72.6 | 70.9 | Jiang et al. (2004a) |
| 28Si + 58Ni | 1704 | 0.383 | 49 | 45.3 | Jiang et al. (2004a) |
| 28Si + 62Ni | 1722 | 0.370 | 48.6 | 44.3 | Jiang et al. (2004a) |
| 16O + 208Pb | 2529 | 0.413 | 69.6 | 70.5 | Jiang et al. (2004b) |
| 16O + 144Sm | 1882 | 0.384 | 57.7 | 54.6 | Jiang et al. (2004b) |
| 19F + 208Pb | 3079 | 0.431 | 75.5 | 78.8 | Jiang et al. (2004b) |
| 40Ca + 90Zr | 4210 | 0.524 | 93.2 | 93.6 | Jiang et al. (2004b) |
| 50Ti + 208Pb | 11454 | 0.683 | 181.2 | 191.9 | Jiang et al. (2004b) |
| 58Ni + 60Ni | 4258 | 0.527 | 92 2 | 92.5 | Jiang et al. (2005) |
| 58Ni + 64Ni | 4325 | 0.511 | 89 2 | 91.1 | Jiang et al. (2005) |
| 58Ni + 74Ge | 5109 | 0.542 | 98.5 2.0 | 103.9 | Jiang et al. (2005) |
| 64Ni + 74Ge | 5249 | 0.517 | 97.5 2.0 | 101.5 | Jiang et al. (2005) |
For the asymmetric 64Ni+100Mo reaction, the experimental threshold energy deviates largely from the systematics curve. The calculations with the KNS and AW models are consistent with the systematics curve but not to the value of . In order to check how the touching energy compares with the threshold energy for other asymmetric systems, we also examine the 16O+208Pb reaction. For this system, we find that the KNS model leads to the touching energy that is consistent with the experimental threshold energy Jiang et al. (2004b) (see Table II). Therefore, it is unlikely that the large difference between and for the 64Ni+100Mo system can be attributed to the model assumption of the KNS potential. Notice that for this system, there may exist some peculiar nuclear structure effect, because the coupled-channels calculation reported in Ref. Esbensen (2005) does not seem to account well for the experimental fusion cross sections even above the threshold energy . A further investigation is necessary for this system concerning the threshold energy.
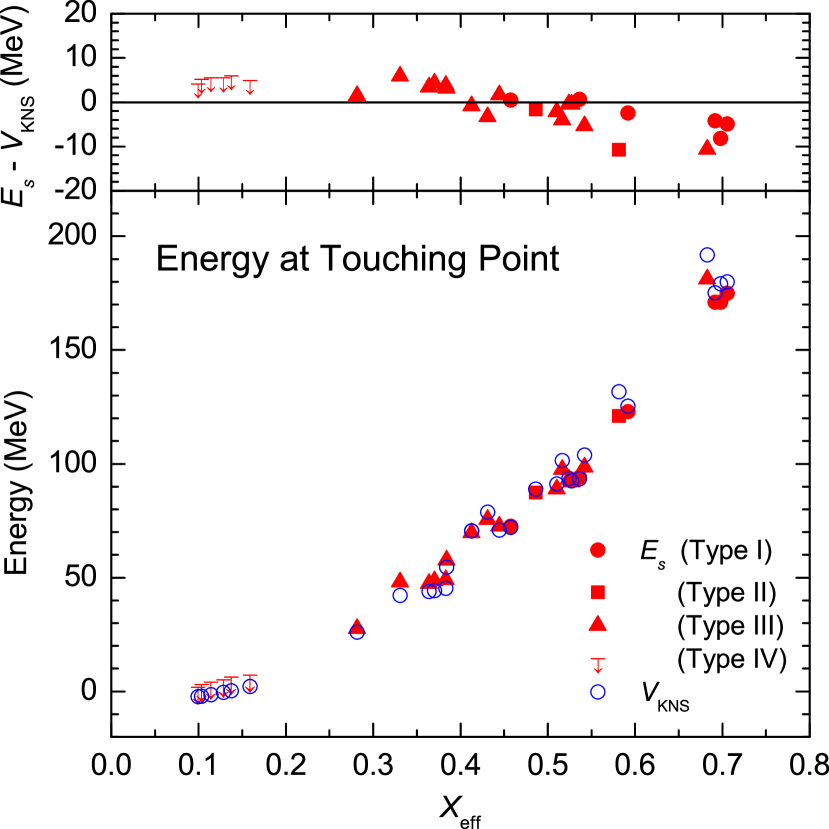
In order to see more clearly the correlation between and , the lower panel of Fig. 3 shows these energies as a function of the effective fissility parameter defined as Bass (1980). The figure includes also a few more systems than shown in Fig. 2, which are taken from Refs. Jiang et al. (2004a, b, 2005) (see Table II for the additional data). With this representation, all the data points distribute more uniformly than in Fig. 2. The difference between and is also shown in the upper panel of Fig. 3. One observes that the difference between and is indeed small except for large , clearly indicating that there is a strong correlation between these two values. The large discrepancy for systems with large may be due to the ambiguity of the experimental data, because the measurements were only for the fusion-evaporation cross sections and the fusion-fission cross sections were estimated using the statistical model Jiang et al. (2004a, b, 2005).
In summary, we have shown that the potential energy at the touching point strongly correlates with the threshold incident energies for the steep fall-off of the fusion cross sections. The systematics of the threshold energy can be rather naturally explained by the present approach in terms of the touching energy. This strongly suggests that the overlap process after the touching is responsible for the steep fall-off of the fusion cross section. For such overlap process, the sudden and adiabatic approaches have been often employed Balantekin and Takigawa (1998); Hagino and Washiyama (2006). In the former, the frozen density approximation while overlapping with the colliding nuclei is applied, and in the latter, the dynamical change in the density of the colliding nuclei is taken into account. These two approaches are in the opposite limit to each other, and there is not yet a definite consensus regarding which limit better describes the realistic situation at deep subbarrier energies. In this respect, the threshold energy discussed in this paper will provide a useful constraint to modelling of the overlap process as the touching configuration is a doorway of such process.
Acknowledgements.
This work was supported by the Grant-in-Aid for Scientific Research, Contract No. 19740115 from the Japanese Ministry of Education, Culture, Sports, Science, and Technology.References
- Jiang et al. (2002) C. L. Jiang, H. Esbensen, K. E. Rehm, B. B. Back, R. V. F. Janssens, J. A. Caggiano, P. Collon, J. Greene, A. M. Heinz, D. J. Henderson, et al., Phys. Rev. Lett. 89, 052701 (2002).
- Jiang et al. (2004a) C. L. Jiang, K. E. Rehm, R. V. F. Janssens, H. Esbensen, I. Ahmad, B. B. Back, P. Collon, C. N. Davids, J. P. Greene, D. J. Henderson, et al., Phys. Rev. Lett. 93, 012701 (2004a).
- Jiang et al. (2004b) C. L. Jiang, H. Esbensen, B. B. Back, R. V. F. Janssens, and K. E. Rehm, Phys. Rev. C 69, 014604 (2004b).
- Jiang et al. (2005) C. L. Jiang, K. E. Rehm, H. Esbensen, R. V. F. Janssens, B. B. Back, C. N. Davids, J. P. Greene, D. J. Henderson, C. J. Lister, R. C. Pardo, et al., Phys. Rev. C 71, 044613 (2005).
- Jiang et al. (2006) C. L. Jiang, B. B. Back, H. Esbensen, R. V. F. Janssens, and K. E. Rehm, Phys. Rev. C 73, 014613 (2006).
- Jiang et al. (2006) C. L. Jiang, B. B. Back, H. Esbensen, R. V. F. Janssens, Ş. Mişicu, K. E. Rehm, P. Collon, C. N. Davids, J. Greene, D. J. Henderson, et al., Physics Letters B 640, 18 (2006).
- Hagino et al. (2003) K. Hagino, N. Rowley, and M. Dasgupta, Phys. Rev. C 67, 054603 (2003).
- Dasgupta et al. (2006) M. Dasgupta, D. J. Hinde, C. Low, and J. O. Newton, AIP Conf. Proc. 853, 21 (2006).
- Dasgupta et al. (1998) M. Dasgupta, D. J. Hinde, N. Rowley, and A. M. Stefanini, Annu. Rev. Nucl. Part. Sci. 48, 401 (1998).
- Krappe et al. (1979) H. J. Krappe, J. R. Nix, and A. J. Sierk, Phys. Rev. C 20, 992 (1979).
- Bass (1980) R. Bass, Nuclear reactions with heavy ions (Springer-Verlag New York, 1980).
- Myers and Świa̧tecki (2000) W. D. Myers and W. J. Świa̧tecki, Phys. Rev. C 62, 044610 (2000).
- Broglia and Winther (1991) R. A. Broglia and A. Winther, Heavy Ion Reactions, Lecture Notes, Volume I: The Elementary Processes (Addison-Wesley, Reading, MA, 1991).
- Möller et al. (2004) P. Möller, A. J. Sierk, and A. Iwamoto, Phys. Rev. Lett. 92, 072501 (2004).
- Siwek-Wilczyńska and Wilczyński (2004) K. Siwek-Wilczyńska and J. Wilczyński, Phys. Rev. C 69, 24611 (2004).
- Świa̧tecki et al. (2005) W. J. Świa̧tecki, K. Siwek-Wilczyńska, and J. Wilczyński, Phys. Rev. C 71, 014602 (2005).
- (17) M.G. Mazarakis and W.E. Stephens, Phys. Rev. C7, 1280 (1973).
- (18) T. Spillane et al., Phys. Rev. Lett. 98, 122501 (2007).
- (19) T. Ichikawa, K. Hagino, and A. Iwamoto, to be published.
- Vaz et al. (1981) L. C. Vaz, J. M. Alexander, and G. R. Satchler, Phys. Rep. 69, 373 (1981).
- V. Yu. Denisov and Nörenberg (2002) V. Yu. Denisov and W. Nörenberg, Eur. Phys. J. A 15, 375 (2002).
- Esbensen (2005) H. Esbensen, Phys. Rev. C 72, 054607 (2005).
- Balantekin and Takigawa (1998) A. B. Balantekin and N. Takigawa, Rev. Mod. Phys. 70, 77 (1998).
- Hagino and Washiyama (2006) K. Hagino and K. Washiyama, AIP Conf. Proc. 853, 86 (2006).