The SAURON project - XI. Stellar Populations from Absorption Line Strength Maps of 24 Early-Type Spirals
Abstract
We present absorption line strength maps of a sample of representative early-type spiral galaxies, mostly of type Sa, obtained as part of the SAURON survey of nearby galaxies using our custom-built integral-field spectrograph. Using high-quality spectra, spatially binned to a constant signal-to-noise, we measure several key age, metallicity and abundance ratio sensitive indices from the Lick/IDS system over a contiguous two-dimensional field including bulge and inner disc. We present maps of H, Fe 5015, and Mg , for each galaxy. We find that Sa galaxies on the average have slightly smaller Mg and Fe 5015 line strengths than ellipticals and S0s, and higher H values, but with a much larger scatter.
The absorption line maps show that many galaxies contain some younger populations ( 1 Gyr), distributed in small or large inner discs, or in circumnuclear star forming rings. In many cases these young stars are formed in circumnuclear mini-starbursts, which are dominating the light in the centres of some of the early-type spirals. These mini-starburst cause a considerable scatter in index-index diagrams such as Mg – H and Mg – Fe 5015, more than is measured for early-type galaxies. We find that the central regions of Sa galaxies display a wide range in ages, even within the galaxies. We find that the central regions of early-type spirals are often dusty, with a good correlation between the presence of young central stellar populations and a significant amount of dust extinction. 50% of the sample show velocity dispersion drops in their centres.
All of the galaxies of our sample lie on or below the Mg – relation for elliptical galaxies in the Coma cluster, and above the H absorption line – relation for elliptical galaxies. If those relations are considered to be relations for the oldest local galaxies we see that our sample of spirals has a considerable scatter in age, with the largest scatter at the lowest . This is in disagreement with highly inclined samples, in which generally only old stellar populations are found in the central regions.
The discrepancy between our sample and highly inclined samples, and the presence of so many stellar velocity dispersion dips, i.e., so-called -drops, in these spiral galaxies with large bulges (type Sa) can be understood if the central regions of Sa galaxies contain at least 2 components: a thin, disc-like component, often containing recent star formation, and another, elliptical-like component, consisting of old stars and rotating more slowly, dominating the light above the plane. These components together form the photometrically defined bulge, in the same way as the thin and the thick disc co-exist in the solar neighbourhood. In this picture, consistent with the current literature, part of the bulge, the thicker component, formed a very long time ago. Later, stars continued to form in the central regions of the disc, rejuvenating in this way the bulge through dynamical processes. This picture is able to explain in a natural way the heterogeneous stellar populations and star formation characteristics that we are seeing in detailed observations of early-type spiral galaxies.
keywords:
galaxies: bulges – galaxies: spiral – galaxies: spirals – galaxies: evolution – galaxies: formation – galaxies: kinematics and dynamics – galaxies: structure1 INTRODUCTION
The measurement of absorption line strengths in combination with stellar population models has been used for many years to probe the age, metallicity and abundance ratios of certain elements in integrated stellar populations of galaxies (e.g., Faber 1973, Burstein et al. 1984, González 1993, Davies et al. 1993, Kauffmann et al. 2003). Up to recently, this was done using long-slit spectroscopy. Now two-dimensional absorption line maps are starting to emerge. Kuntschner et al. (2006, Paper VI) recently published line strength maps for the SAURON sample of 48 ellipticals and S0s. One of the main advantages of having maps is that one can easily identify two-dimensional structures, so that one can isolate areas of e.g., high Mg/Fe ratio, or young stellar populations, and then understand better their origin by looking at their morphology or kinematics. Kuntschner et al. used the Lick/IDS system (Faber et al. 1985, Gorgas et al. 1993, Worthey et al. 1994), in order to allow an easy comparison with existing data. Here we present similar data, but for the inner regions of the SAURON sample of Sa galaxies. Since this type of spiral galaxies consists, amongst others, of a bulge and an exponential disc, one might wonder which fraction of the bulge is covered by the SAURON field. In this paper we will use the practical definition, which has been often used in the literature, that the bulge is the central component causing the excess in light above the exponential disc (e.g. MacArthur et al. 2003, de Jong 1996, Graham 2002). This so-called bulge is often much brighter than the disc in the centre of the galaxy (up to factors of 100 or more). In a following paper (Falcón-Barroso et al., in preparation) we will present a photometric bulge-disc decomposition for this sample, into a Sérsic bulge and an exponential disc. Here we just use the fact that for all galaxies in the sample the whole region in which the bulge dominates the disc is included in the SAURON field.
Contrary to ellipticals, for which absorption line indices are available for many galaxies, there are very few spiral galaxies with good literature measurements. The reason is probably that spirals are more complicated, with much more star formation and dust, with several clearly distinguishable morphological components such as bulge and disc, and more difficult to observe, given their generally lower surface brightness. While for elliptical galaxies one can obtain a significant amount of useful information from broadband colours, for spiral galaxies these colours are hard to interpret due to the much more ubiquitous presence of dust. It is therefore timely and important that more absorption line strength observations of spirals become available.
We will now briefly summarize the literature on absorption line strengths in spiral galaxies. Note that the galaxies for which measurements are available are almost all early-type spirals (type Sbc or earlier). Spinrad & Taylor (1971) already noticed the strong lines (i.e. high metallicity) in the central regions of M 31, and the complicated spectrum of M 81 with emission and absorption lines. Bica (1988) fitted spectra of several spiral galaxies to a library of star clusters and found that young stellar populations occur more often in spirals than in ellipticals. While calibrated Mg2 indices for large samples of early-type galaxies were already available in the beginning of the nineties (Faber et al. 1989, Bender et al. 1993), only in 1996 calibrated Mg2 indices and a number of other uncalibrated line indices were published for a sample of S0 and spiral galaxies by Jablonka, Martin & Arimoto (1996). They found a reasonably tight relation between Mg2 and central velocity dispersion. They also found that the Mg/Fe ratio in the centre is higher than solar for bright galaxies, and close to solar for the faintest galaxies (MR -19). Idiart, de Freitas Pacheco & Costa (1996) observed Lick indices in the centres of early type spirals. They found correlations of the small number of indices observed with both bulge luminosity and velocity dispersion. Proctor & Sansom (2002) published a large number of Lick indices for a sample containing 15 spirals. They found that bulges are less enhanced in light (-capture) elements and have lower average age than early-type galaxies. A detailed comparison with this sample is given in Section 4. Afanasiev & Sil’chenko (2005) show aborption line maps of two early-type spirals in the Leo group: NGC 3623 and NGC 3627, partly using the same SAURON data that we present here, but reduced in a different way. Gorgas, Jablonka & Goudfrooij (2007) and Jablonka, Gorgas & Goudfrooij (2007) comment on observations of 31 spirals that they observed on the minor axis. They find that their vertical line strength gradients are generally negative, and agree very well with the results found for elliptical galaxies and S0s from González & Gorgas (1995). We conclude that there is a concensus that Mg/Fe ratios for spirals seem to be somewhat lower than for ellipticals. The results for the ages of the stellar populations in the centres of spirals are still under discussion. Fisher et al. (1996) investigated major and minor axis line strength gradients of S0 galaxies. Interestingly enough, they found much larger gradients along the minor axis than along the major axis. Along the minor axis, they found negative gradients, consistent with stellar population gradients from colours, that are larger than those in typical elliptical galaxies. Very recently Moorthy & Holtzman (2006) published a large absorption line strength study of long-slit spectra of 38 spirals of type S0-Sbc. They separated their sample in red (B–K 4) and blue bulges. According to them red bulges of all Hubble types have stellar populations similar to luminous elliptical galaxies. Blue bulges consist of metal-poor bulges with low velocity dispersion, and young, metal-rich bulges that contain all Hubble types and velocity dispersions. Bulges and ellipticals show a continuous and overlapping sequence in index - diagrams. Most blue bulges have solar /Fe ratios.
The star formation (SF) history of spirals has traditionally been studied using their H ionised gas emission. Massive SF can be convincingly traced by the accompanying H emission and is very easily observed with standard telescopes and cameras (Kennicutt 1998). H is mainly produced in the HII regions surrounding massive B and O stars, although shocks and non-stellar activity can also lead to H emission. Knapen et al. (2006) recently studied the morphology of the H emission in the circumnuclear regions, as well as from the nucleus per se, using a sample with some prior evidence for the presence of H. These authors conclude that H is often found in circumnuclear regions such as inner rings, with diameter smaller than 2 kpc. Such low-luminosity starbursts are found in around one fifth of spiral galaxies (Knapen 2005, hereafter K05), and are believed to be directly related to the dynamics of the host galaxy and its stellar bar (e.g., Buta & Combes 1996; Knapen 2005). Can this phenomenon also be seen from the absorption line indices? What is the distribution of young stellar populations?
This question is important when one wants to study the origin of bulges and discs. At present, there are a number of theories about the origin of bulges. One is the theory of dissipative collapse (Eggen, Lynden-Bell, & Sandage 1962), where the bulge assembled from a primordial proto-galaxy on a short timescale. Such a collapse is thought to create a bulge that looks like an elliptical galaxy, also sometimes called a classical bulge (e.g. Carollo 1999). However, since bulges live inside discs, some of which are much larger than them, there must be interactions with them. There are also theories predicting that bulges are made from disc material. In those so-called secular evolution scenarios, in which the bulge is formed by dynamical instabilities of the disc, these instabilities are often bar-driven. Bars might lead to radial inflow of material, buckle and thicken in the vertical direction, and may even be destroyed by sufficiently massive central mass concentrations (e.g. Combes et al. 1990; Pfenniger and Norman 1990; Norman et al. 1996). Those processes may occur repetitively, especially in the presence of gas infall, gradually building a bulge (e.g. Bournaud & Combes 2002; Martínez-Valpuesta, Shlosman & Heller 2006). One might possibly be able to distinguish between both models by looking at the stellar populations (a bulge made from disc material should be younger than a classical bulge), the morphology (a disc-like bulge should be thinner) or the kinematics (it should be more supported by rotation). A detailed discussion about the different formation models, and their comparison with data is given in Kormendy & Kennicutt (2004). In this paper we consider what the SAURON data, and especially the stellar populations can tell us about the formation of spirals.
The paper is structured as follows. In Section 2 we briefly summarize our observations and data reduction. In Section 3 we present the absorption line maps. In Section 4 we discuss central ages, metalicities and abundance ratios, determined assuming that the stellar populations can be represented by SSPs. In Section 5 we discuss the central indices, and their correlations with various relevant galaxy parameters. In Section 6 we discuss the relation between the indices and the dynamics, as derived in particular from the central velocity dispersion. In Section 7 we discuss the implications of these data to our understanding of spiral galaxies, bulges and discs. Conclusions are given in Section 8. Finally, in the appendix the individual objects are discussed. In a forthcoming paper, we will discuss line strengths as a function of radius.
2 Integral-field spectroscopic observations
The SAURON survey is a study of the two-dimensional kinematic and stellar population properties of a representative sample of 48 early-type galaxies (E + S0) and 24 early-type spirals. Details about the definition and properties of the survey sample can be found in de Zeeuw et al. (2002) (Paper II). The observations were carried out using the Integral Field Spectrograph SAURON on the 4.2m William Herschel Telescope of the Observatorio del Roque de los Muchachos at La Palma, Spain, and were performed during 6 runs from 1999 to 2004. Paper VII (Falcón-Barroso et al. 2006a) presents the kinematics of gas and stars of the sample of 24 early-type spirals for which we present the absorption line strength distribution here. Most of these galaxies have been classified as Sa in the RC3, although a few have S0+, S0/a, Sab or Sb classifications. In this paper also practical details about the sample of this paper are given, showing the total integration time, the observing run and the number of pointings for each object. The sample is summarised in Table 1. The field of SAURON is 33 41, with a spatial sampling of 094 094. Although for most galaxies we only observed one position, we performed two pointings for three of the largest galaxies. Details about the instrument are given in Paper I (Bacon et al. 2001). The data and maps presented in this paper will be made available via the SAURON WEB page http://www.strw.leidenuniv.nl/sauron/.
The data reduction was performed with the XSAURON package, providing cubes of spectra covering a narrow wavelength range 4800 – 5300 Å at a resolution of 4.2 Å(FWHM) and a sampling of 1.1 Å/pix. In this wavelength range one finds the Lick indices H Fe 5015 , Mg and Fe 5270, and the emission lines H [OIII] at 4959 and 5007 Å and the [NI] doublet at 5199 Å. More details about the data reduction are given in Paper VII. In this paper the Fe 5270 index is not used, since its maps cover only slightly more than half the field of the other indices.
To allow for a good calibration of the line indices, also from run to run, we observed during each run a number of stars covering a broad range of spectral types. Specifically, we included stars from the Lick stellar library catalogue (Worthey et al. 1994) and the MILES library (Sánchez-Blázquez et al. 2006) in order to calibrate our line strength measurements to the flux-calibrated Lick/IDS system and its associated models (e.g. Worthey 1994, Vazdekis et al. 1996). Spectrophotometric standard stars were observed to calibrate the response function of the system (Paper VI), where the observations of stars and elliptical galaxies are compared with observations from resp. Worthey et al. (1994) and Trager et al. (1998), showing that these measurements can be reproduced within the errors of the Lick system. In Paper II a detailed comparison with the literature is made for two ellipticals: NGC 3384 and NGC 5813, showing good agreement.
The spectra were fitted with the stellar population models of Vazdekis (1999), allowing us to separate the emission lines from the absorption line spectrum (for details about this procedure see Papers V and VII). On the cleaned spectra we obtained the line indices (see Paper VI for details on how this was done). The simulations in Appendix A of Paper V show that the accuracy in recovering the emission-line fluxes does not depend on the strength of the emission, as quantified by the A/N ratio between the line amplitude and the noise level in the stellar continuum. This is because the errors in matching the line amplitudes do not depend on the A/N ratio but only on the amount of noise in the continuum. Considering only statistical fluctuations, the uncertanties in the fluxes of the emission lines will therefore increase with increasing S/N in the stellar continuum but the uncertainties in the equivalent width of the lines will decrease.
For the worst S/N=60, the typical uncertainties in the line fluxes in Appendix A of Paper V (see Fig. A1 of that paper) translates in errors in the emission line equivalenth width of Å, which will correspond to similar errors in the H,Fe 5015 and Mg line indices. The fact that the spectra are packed so close together implies that neighbouring spectra, at wavelengths by a few hundred angstroms, will affect the absorption lines discussed here. Although our reduction programs have been optimized to get rid of this contaminating emission, it is unavoidable that some effects can not be removed. This is the case in particular when the galaxy has strong emission lines. Other, smaller errors arise because of template errors between the galaxy and the input spectra of the stellar library of Vazdekis (1999). Considering these points, we presume throughout the rest of this paper that the uncertainty in the data points amounts to more conservative values of 0.2 Å for Mg and H and 0.3 Å for Fe 5015.
A few of the galaxies (NGC 4369, NGC 4383) have emission lines that are stronger by a factor of about 100, relative to the absorption lines, than the elliptical or lenticular of paper V with the strongest emission lines. We have done some extra simulations, similar to the ones of Appendix A of Paper V, with A/N now ranging up to 100. Since the results are such that the errors in the line indices H,Fe 5015 and Mg do not increase noticibly, we use the same errors in this paper. As a test we also used the MILES stellar population models (Sánchez-Blazquez et al. 2006) to separate absorption and emission. The resulting line strengths are the same as using the Vazdekis (1999) models within the errors.
3 Absorption-line strength maps
3.1 The data
Figure 1 present maps of the absorption line strengths of the 24 objects, ordered by increasing NGC number. In the first row, we show the measured two-dimensional line strength distributions of H, Fe5015 and Mg . In the second row, the total intensity map reconstructed from the SAURON spectra is followed by the age, metallicity and Mg/Fe overabundance maps derived from single stellar population (SSP) models (see Section 3.2). The relative directions of North and East are indicated by the orientation arrow next to the galaxy title (the orientation is identical to Paper VII). The maximum and minimum of the plotting range is given in the tab attached to each parameter map, and the colour bar indicates the colour table used.
| Galaxy | Type | SF Type | MB | Activity | W | |||
|---|---|---|---|---|---|---|---|---|
| (1) | (2) | (3) | (4) | (5) | (6) | (7) | (8) | (9) |
| NGC | RC3 | RC3 | RC3 | Paper II | H97 | RC3 | Paper VII | Paper VII |
| 1056 | Sa: | CR | 0.44 | -19.44 | Sy2∗ | 311 | 0.83 | 52 |
| 2273 | SBa(r): | CS | 0.25 | -20.21 | Sy2 | 513 | 0.83 | 70 |
| 2844 | Sa(r): | R | 0.55 | -18.38 | HII∗ | 334 | 0.94 | 34 |
| 3623 | SABa(rs) | N (D) | 0.76 | -20.82 | L2:: | 520 | 0.80 | 100 |
| 4220 | S0+(r) | LR | 0.61 | -19.01 | T2 | – | 0.99 | 16 |
| 4235 | Sa(s)sp | N (D) | 0.78 | -19.20 | Sy1.2 | 335 | 0.84 | 90 |
| 4245 | SB0/a(r) | R | 0.17 | -18.72 | HII | – | 0.92 | 36 |
| 4274 | (R)SBab(r) | R | 0.63 | -20.08 | HII | 481 | 0.68 | 100 |
| 4293 | (R)SB0/a(s) | CS | 0.48 | -20.37 | L2 | 424 | 0.92 | 42 |
| 4314 | SBa(rs) | R | 0.05 | -19.55 | L2 | – | 0.93 | 43 |
| 4369 | (R)Sa(rs) | CR | 0.01 | -18.96 | HII | – | 0.99 | 10 |
| 4383 | Sa pec | CR | 0.49 | -18.93 | HII∗ | 237 | 1.00 | 0 |
| 4405 | S0/a(rs) | CR | 0.34 | -18.54 | HII | 187 | 0.91 | 25 |
| 4425 | SB0+:sp | N | 0.64 | -18.83 | – | 0.93 | 28 | |
| 4596 | SB0+(r) | N (D) | 0.13 | -19.94 | L2:: | – | 0.92 | 59 |
| 4698 | Sab(s) | N (D) | 0.31 | -20.05 | Sy2 | 544 | 1.00 | 10 |
| 4772 | Sa(s) | N (D) | 0.42 | -19.56 | L1.9 | 531 | 0.99 | 15 |
| 5448 | (R)SABa(r) | CS | 0.48 | -20.78 | L2 | 464 | 0.86 | 65 |
| 5475 | Sa sp | N | 0.74 | -19.39 | – | 0.99 | 14 | |
| 5636 | SAB(r)0+ | N | 0.32 | -18.42 | 430 | 0.99 | 8 | |
| 5689 | SB00(s) | N (D) | 0.71 | -20.32 | 381 | 1.00 | 0 | |
| 5953 | Sa:pec | R | 0.26 | -19.61 | L1/Sy2∗ | 363 | 0.66 | 81 |
| 6501 | S0+ | N | 0.10 | -20.38 | L2:: | 503 | 0.99 | 27 |
| 7742 | Sb(r) | R | 0.05 | -19.76 | T2/L2 | 267 | 1.00 | 0 |
Notes to Table 1: Some global parameters for our galaxies. (1): NGC number; (2) Morphological type (from RC3, de Vaucouleurs et al. 1991); (3) Morphology of the central star formation region (see text: CR = central region; CS = central starburst; R = ring, LR = large ring, N = no signs of significant recent star formation. (D) indicates the presence of a central disc) (4): Ellipticity 1-b/a (RC3); (5) Absolute blue magnitude (Paper II), (6) Activity class (Ho et al. 1997). Asteriscs indicate that the galaxy is not included in H97 and that the classification is from NED. Column (7) gives the inclination corrected HI velocity width at 20% of the peak (from NED), in km/s. In column (8) the central stellar velocity dispersion is given divided by the maximum velocity dispersion in the SAURON field, and in column (9) a similar quantity, in km/s, not scaled by the central velocity dispersion.
3.2 Stellar Population Structures in the SAURON maps
In our sample of 24, we distinguish two kinds of galaxies: those with smooth line strength gradients, and those with features for which Mg and Fe 5015 are considerably lower than the surrounding areas and H higher, i.e. areas with younger stellar populations. These younger stellar populations are generally found either in rings, or everywhere in the central regions; the presence of young stars always comes with the presence of dust.
Starting with the second category: we find rings of younger stars in NGC 2844, 4220, 4245, 4274, 4314, 5953 and 7742. The appearance of the line strength maps in e.g. NGC 2844 and 4220 is different from those in e.g. NGC 4314, because of the effects of inclination.
| Galaxy | H | Mg b | Fe 5015 | ||||
|---|---|---|---|---|---|---|---|
| 1.2′′ | 10′′ | 1.2′′ | 10′′ | 1.2′′ | 10′′ | ||
| NGC 1056 | 3.16 | 2.85 | 1.63 | 1.55 | 2.65 | 2.25 | |
| NGC 2273 | 3.33 | 2.71 | 2.07 | 2.88 | 2.88 | 4.30 | |
| NGC 2844 | 2.13 | 2.54 | 2.72 | 2.01 | 4.27 | 3.25 | |
| NGC 3623 | 1.78 | 1.70 | 4.13 | 3.96 | 5.80 | 5.00 | |
| NGC 4220 | 2.53 | 2.52 | 3.05 | 2.81 | 5.67 | 5.00 | |
| NGC 4235 | 1.27 | 1.84 | 3.02 | 3.42 | 3.75 | 4.74 | |
| NGC 4245 | 2.08 | 2.12 | 3.80 | 3.27 | 5.66 | 4.57 | |
| NGC 4274 | 2.24 | 2.06 | 3.53 | 3.29 | 5.96 | 4.58 | |
| NGC 4293 | 3.64 | 2.59 | 2.33 | 2.79 | 4.68 | 4.97 | |
| NGC 4314 | 1.81 | 2.29 | 3.89 | 2.87 | 5.50 | 4.16 | |
| NGC 4369 | 4.37 | 3.52 | 1.20 | 1.46 | 3.03 | 2.47 | |
| NGC 4383 | 2.69 | 3.11 | 0.89 | 1.27 | 0.31 | 1.25 | |
| NGC 4405 | 3.54 | 3.32 | 1.72 | 1.78 | 3.56 | 3.05 | |
| NGC 4425 | 2.00 | 1.96 | 3.47 | 3.17 | 5.44 | 4.51 | |
| NGC 4596 | 1.86 | 1.71 | 4.20 | 3.90 | 5.79 | 4.79 | |
| NGC 4698 | 1.55 | 1.66 | 4.08 | 3.56 | 5.28 | 4.48 | |
| NGC 4772 | 1.52 | 1.50 | 4.23 | 3.87 | 4.59 | 4.32 | |
| NGC 5448 | 2.77 | 2.10 | 2.69 | 3.27 | 4.66 | 4.38 | |
| NGC 5475 | 2.40 | 2.20 | 3.33 | 3.14 | 5.54 | 4.81 | |
| NGC 5636 | 2.56 | 2.34 | 2.02 | 2.23 | 3.63 | 3.20 | |
| NGC 5689 | 2.05 | 1.98 | 3.73 | 3.28 | 5.83 | 4.86 | |
| NGC 5953 | 2.28 | 3.24 | 2.04 | 1.45 | 3.14 | 2.42 | |
| NGC 6501 | 1.37 | 1.55 | 4.94 | 4.11 | 5.86 | 4.99 | |
| NGC 7742 | 2.41 | 2.90 | 3.05 | 2.28 | 4.63 | 3.56 | |
Notes to Table 2: Here we present central line indices in apertures of 1.2 and 10 radius. The numbers are given in the Lick system, i.e., corrections of -0.13 Å and 0.28 Å resp. have been added to H and Fe 5015 (Paper VI).
In the same category we find a class of galaxies with young stellar populations in the central regions. Here we distinguish again two subgroups. The first group, consisting of NGC 2273, 4293, and 5448, contains a compact central region with diameter of about 10 arcsec or 1 kpc, inside an otherwise old stellar population. The other group contains galaxies for which the stellar populations are young across the whole SAURON field (NGC 1056, 4369, 4383, 4405). These are amongst the faintest galaxies of our sample, but HST images show that there is very little star formation further out in the disc. If there had been, they probably would not have been classified as Sa in the RC3. The [OIII]/H emission line ratio in these objects is generally low, indicating the presence of star formation (Paper V). For this category the presence of young stars is always accompanied by large amounts of dust (see the unsharp masked images from HST and MDM in Paper VII). Seven galaxies in total (29 9 %) belong to this class. At higher spatial resolution some of these might change to the previous category.
The remaining galaxies, NGC 3623, 4235, 4425, 4596, 4698, 4772, 5475, 5636, 5689 and 6501 show generally smooth line strength maps, similar to elliptical and lenticular galaxies. In six of those ten there are clear indications of dust in the central regions.
The young stellar populations that we see in the absorption line strength maps are always detected in the H emission line maps (shown in Paper VII). Features in the line strength maps are often, but not always seen in the stellar and gaseous kinematics. In galaxies with a ring at high inclination (e.g. NGC 4274) we see that the ring rotates rapidly, and is associated with gas, dust, and regions of young stellar populations. Here one can clearly see that the young stellar populations are confined to a flat, disc-like region. Another correlation between the presence of young population and the kinematics can be found in galaxies with central young stellar populations. For example, in NGC 2273 we find a thin disc in the stellar kinematics in the inner regions. A region with the same size as this disc along the major axis, but more extended on the minor axis shows evidence of younger stellar populations. In the galaxies with rings, sometimes stellar discs are seen inside the ring (e.g. NGC 4245, 4314). In NGC 4293 we see central young populations associated with abnormally low gas velocities, indicating possibly ionised gas in outflow. In NGC 4698 we clearly see a central peak in both the Mg and Fe 5015 maps, indicating a high metallicity. This galaxy has a central stellar disc rotating perpendicular to the rest of the galaxy (Pizzella et al. 2002, Sarzi 2000). This combination of a kinematically decoupled core and an enhanced central metallicity is also seen in several central discs in elliptical and S0 galaxies (NGC 3414, 3608, 4458, 4621, 5198, 5813, 5831, 5982 and 7332; Paper VI, and NGC 4365 (Davies et al. 2001)). NGC 5953, part of an interacting pair, shows a ring of young stellar populations. The stars inside this ring rotate perpendicular to those outside of it. In Paper VII we suggest that we are seeing here a kinematically decoupled core being formed. Finally, in NGC 7742 the data in Paper VII show that the ionised gas is not only counter-rotating to the stars inside the ring (as was shown in Paper II), but also outside of it. In the ring itself, dominated by young stellar populations, the rotation velocity is lower than immediately inside and outside of it.
How do these Sa galaxies relate to earlier-type galaxies, e.g. S0s? In Paper VI we mention in Section 5.1 that in NGC 3032, 3156, 4150 and 4382 central depressions in Mg are found, corresponding to regions of enhanced H. All 4 galaxies are lenticulars. We can compare them to the spirals with central starbursts. In the S0 galaxies NGC 524 and NGC 3608 there is some evidence for rings, associated with younger stellar populations (Paper V, Paper VI), although the amount of light from the young stars is much smaller than in the ring galaxies in this paper. Also, this paper contains a case of a galaxy with young stars in a ring (NGC 4526), similar to NGC 4274.
4 SSP Ages, Metallicities and Abundance Ratios
In the way we described in Paper VI and in McDermid et al. (2006, Paper VIII) we determined ages, metallicities and abundance ratios in each bin, assuming that the stellar populations there could be represented by a single-age, single metallicity stellar population. In practice, we determined the SSP for which the line strengths Fe 5015 , H and Mg fitted best in the sense. These maps are shown in the second row of Figure 1. Although we know that it is a great over-simplification to represent the stellar populations (even locally) of a galaxy by a SSP (e.g., Allard et al. 2006), in some, especially elliptical galaxies (e.g. NGC 5128, Rejkuba et al. 2005) the locally averaged metallicity and age do not vary very much across the galaxy, so that the errors that one makes when representing the local stellar population by an SSP are the same everywhere. For that reason by far the large majority of papers dealing with stellar populations in ellipticals treats these as SSPs. In Paper VI one can see that among the S0 galaxies some have stellar populations with different ages, such as NGC 3032 in the very nucleus (see also OASIS data of this galaxy in Paper VIII). In this galaxy a representation in terms of SSPs removes a considerable amount of information and can lead to wrong results. Such young stellar populations, however, are rare in the survey of elliptical galaxies and S0s (see Paper VI). The line strength maps of Fig. 1 show that for Sa-galaxies the situation is different. Several galaxies show features in their age distribution, indicating younger stellar populations. Apart from the absorption line maps, the emission line maps also show that H is sometimes strong, indicating stars of around 108 years. Some galaxies have absorption line strength maps without features, just like elliptical galaxies. Others are very different. For the former objects the SSP approach might give results that are close to reality. For the latter objects, where the line strength maps show features, one should just consider the age, metallicity and alpha-enhancement maps as tools, and interpret them with the caveats given here.
In some objects an unconstrained SSP-fit gives rather inappropriate results. This is illustrated in Allard et al. (2006) for the star formation ring in NGC 4321. Allard et al. (their Fig. 12) show that in the ring Mg , Fe 5015 and H are such that the stellar populations there have to consist at least of two components: a young one, and an old, metal-rich stellar population. If one forces only one Single Stellar Population, it will have low metallicity and old age. Since metallicities of HII regions in this galaxy are likely to be higher than solar (Zaritsky et al. 1994) the SSP solution looks clearly wrong. This seems to be the case in particular for NGC 4314, 4369, 4383, 5953, and 7742. For these especially one has to understand the limitations of the ages obtained here.
5 Central stellar populations
In this section we analyse the central line strength indices, calculated in the central aperture with a radius of 1.2, and their corresponding SSP-metallicities, ages and /Fe ratios, and discuss their dependence on other galaxy parameters.
5.1 Index-index relations
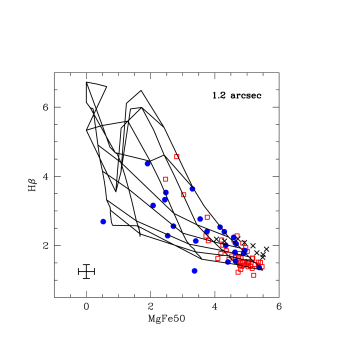
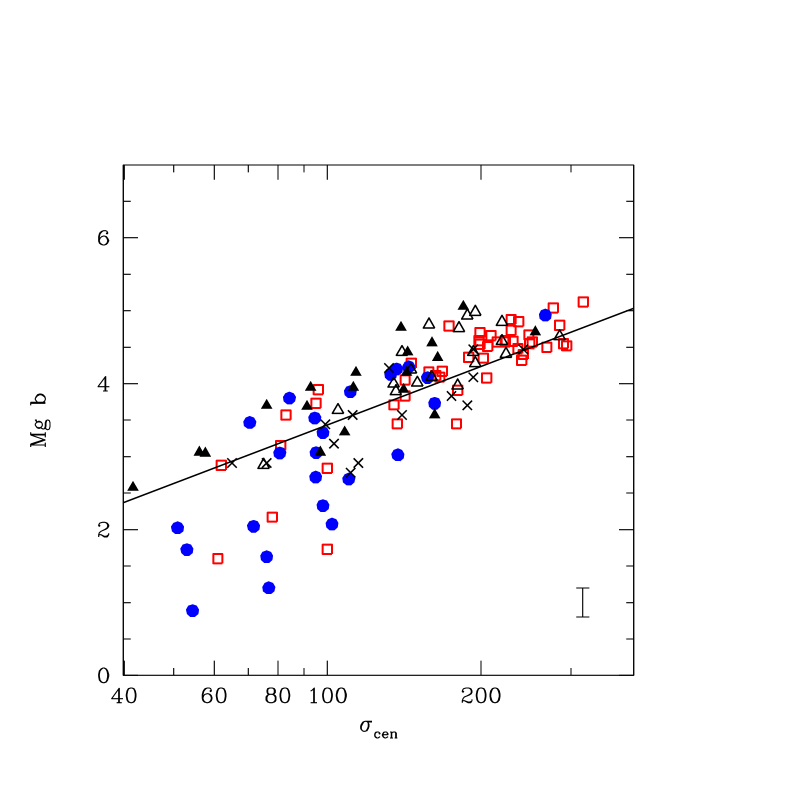
In Fig. 2 and 3 we show two different index-index diagrams. The first (Fig. 2) is a metal line indicator (MgFe50) against an age indicator (H). The numbers used in these figures are given in Table 2. Indices are measured in a central aperture with radius 1.2. MgFe50 is defined to be (Kuntschner 2000), and has been shown to be a good metallicity indicator, relatively unaffected by the effects of the overabundance of Mg with respect to Fe. In red squares are indicated the elliptical and lenticular galaxies of Paper VI (at re/8), and in filled blue circles the central apertures of the Sa galaxies of this paper. The choice of aperture is not arbitrary. If we would take the same aperture of re/8 as in Paper VI we would have to make a choice of either performing a bulge-disc decomposition and taking re/8 of the bulge, or taking re/8 of the whole galaxy. For the spiral galaxies we have taken the approach that we would concentrate our efforts on the inner regions, and therefore only observed one SAURON field per galaxy, as opposed to many of the early-type galaxies of paper VI, for which 2 or 3 fields were observed. Consequently re/8 of the bulge would be the natural choice for the inner aperture. For bulges, the effective radius generally would be smaller than 10 (Andredakis et al. 1995), so re/8, corrected for the effects of the seeing, would be comparable to 1.2.
From Fig. 2 one can see that
there is a smooth transition between E and S0 galaxies on one hand and Sa galaxies on the
other. Most early-type galaxies can be
found in the lower right part of the diagram, while the Sa galaxies have lower
MgFe50 and higher H values. Added to the diagram is a grid of SSP
models by Thomas, Maraston & Bender (2003). Most early-type galaxies can
be interpreted as having old, metal rich stellar populations (similar to
galaxies in the Fornax cluster, see Kuntschner 2000), but some are clearly
younger in their central regions. The Sa galaxies apparently have a large
range in age, and have metallicities generally lower than the ellipticals, if we
assume that we are dealing with SSPs. One
of the galaxies, NGC 4383, has a much lower metallicity than the other
galaxies, or is dominated by very young stellar populations. NGC 4235 lies slightly below the grid. The line strength maps of
Figure 1 indicate a central dip in H, which makes one suspect that this
Seyfert 1 galaxy has some non-thermal emission in its very centre.
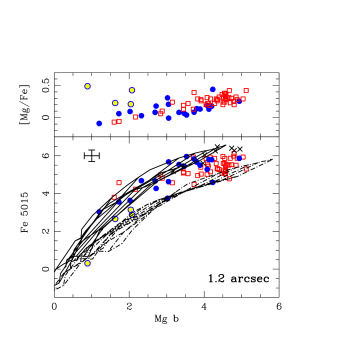
In Figure 3 we investigate the [Mg/Fe] overabundance in spirals. Since some elliptical galaxies are known to be over-abundant in -elements, compared to the Sun (Peletier 1989, Worthey et al. 1992), we have plotted in the bottom panel models by Thomas et al. (2003) with =0.5 (dotted lines) and 0 (solid lines). There is a general tendency for Sa galaxies with a given velocity dispersion to have the same abundance ratio [Mg/Fe] (in the center) as elliptical galaxies. The fact that the abundance ratios of the two types of galaxies are the same shows that the star formation history in the centers of these galaxies has been very similar. At low velocity dispersion the scatter for spirals is large, but this is most likely due to the fact that these galaxies consist of a mix of young and old stellar populations, implying that our method to derive the abundance ratio breaks down here. One can illustrate this as follows: 4 of the spirals have been indicated with blue-yellow open symbols. These four are the objects that deviate most from the early-type galaxies and show apparently high [Mg/Fe] for low central velocity dispersion. The objects are NGC 1056, 2273, 4383 and 5953. Inspection of their line strength maps shows that all 4 have large central H values, indicating objects in which a significant fraction of the light comes from young ( 1 Gyr) stellar populations. These objects most likely cannot be fitted with SSP models, so for those we cannot use the Mg - Fe 5015 diagram to derive their [Mg/Fe] abundance ratio.
Following the currently most popular explanation of nucleosynthesis models Mg predominantly comes from Supernovae type II, while Fe mainly comes from type Ia (Worthey et al. 1992, Weiss, Matteucci & Peletier 1995). The star formation history of elliptical galaxies is thought to be such that most of the stars are formed in the first Gyr, while this timescale for spirals is supposed to be much longer. Note however that there are several modes of star formation in spirals. If star formation is quiescent, which is generaly the case for late type spirals, solar Mg/Fe ratios would be expected. Indeed, some of the galaxies seem to have [Mg/Fe]=0. If star formation occurs in bursts, which is clearly happening often as well, star formation timescales will be short, since the gas will be exhausted, and Mg/Fe could climb to larger values. For fainter galaxies, bursts are relatively more important (see above), so that the scatter in Mg/Fe is also expected to be larger. The fact that the Mg/Fe ratios for massive galaxies are large shows that the stars must have formed from massive stars, in strong bursts, consistent with H measurements. For fainter galaxies star formation must have happened more slowly.
5.2 Comparison with the literature
Very few papers have presented absorption line strengths for spiral galaxies. One of them is the paper of Proctor & Sansom (2002), which contains data for 15 spirals (type S0a-Sb). Their central data is also shown in Figs. 2 and 3. Not shown are the galaxies for which Proctor & Sansom claim that their H absorption line is unreliable because of uncertainties in removing the emission. In general it seems as if the sample of Proctor & Sansom has an offset in Fe 5015 and in H, as compared to ours. There is one galaxy in common: NGC 3623, for which their measurements are quite different: H (PS) = 1.664 Å 0.080; (PS – SAURON) = –0.245 Å; Mg (PS) = 4.803 Å 0.065; (PS - SAURON) = 0.676 Å; Fe 5015 (PS) = 6.278 Å 0.165; (PS - SAURON) = 0.756 Å. It is unlikely that the difference in H is caused by errors in removing the H emission, since this galaxy contains very little emission (see Paper VII). The offsets in NGC 3623 are typical for the offsets that we see for the sample as a whole. We do see that the range in MgFe50 covered by the galaxies of the sample of Proctor & Sansom (2002) is much smaller than in our SAURON galaxies. As a result, Proctor & Sansom find fewer galaxies with recent star formation than we do. There is one galaxy in common with Proctor et al. (2000), NGC 5689. Here the comparison for the central aperture is better: ( (PS – SAURON) = – 0.07 Å, = 0.30 Å, and = – 0.09 Å. The fact that we don’t see any offset between the sample of E and S0’s of Paper VI and the current sample of Sa’s, and the good agreement between Paper VI and the literature make us believe that the data of Proctor & Sansom might be subject to a systematic offset.
A paper with line indices for a large number of galaxies is Moorthy & Holtzman (2006). Although there is only one galaxy in common, NGC 5689, the behaviour of the galaxies in the index-index diagram [MgFe]’ vs. H is similar to our galaxies in the MgFe50 vs. H diagram.
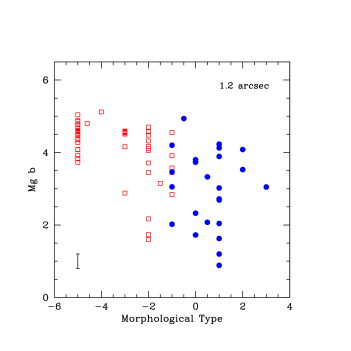
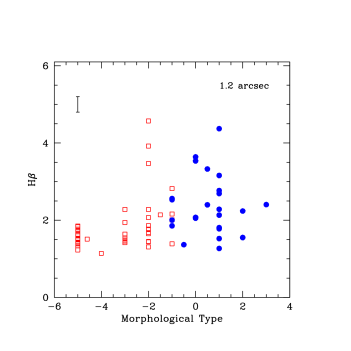
5.3 Relation with galaxy morphology
In Fig. 4 we show the central Mg and H line strength as a function of morphological type (T-type from the RC3). Here we see the same trends as in Figure 2 (overall Mg decreases as a function of type, H increases, Fe 5015 (not shown) decreases, with scatter increasing towards later types), but what can be seen very well here is that the scatter in line indices from galaxy to galaxy becomes large. While for elliptical galaxies line indices occupy a very small range in equivalent width or magnitude (e.g. Schweizer et al. 1990), the range becomes larger for S0 galaxies, and this trend increases for later-type galaxies. A commonly used explanation for this trend is that galaxy populations consist of multiple bursts (see e.g. Trager et al. 2000, Schweizer & Seitzer 1992). A burst of star formation causes a luminous stellar population with (after about 108 years) high Balmer indices, which slowly become weaker with time. It is thought that in the nearby Universe these bursts occur much more frequently in S0 galaxies than in elliptical galaxies, causing the larger scatter in the former. Here we show that the same is the case in the central regions of Sa galaxies. It is very important to realise that we are looking at luminosity-weighted indices. While most of the mass might be old, a young population, which always has a very low stellar ratio, could still dominate the light. Note that both the Mg – type and H – type diagram show envelopes: galaxies have a maximum Mg b and a minimum H. These envelopes represent old, metal rich stellar populations.
6 Linking stellar populations with galaxy dynamics
6.1 Index – relations
Early-type galaxies show a tight Mg2 – velocity dispersion relation (Terlevich et al. 1981, Guzmán et al. 1992, Jørgensen et al. 1996). This is one of the important relations linking galaxy mass with their stellar populations. Deviations from the relations correlate well with parameters indicating the presence of young stellar populations (Schweizer et al. 1990). In Falcón-Barroso et al. (2002, FB02) we used the relation to show that the stellar populations in a sample of inclined early-type spirals are generally old.
In Figs. 5, 6 and 7 we show the central Mg and H indices of our sample as a function of the central velocity dispersion . In the figure are shown the galaxies of this sample, together with the ellipticals and lenticulars of Paper VI (at re/8), and a number of literature samples of early-type spirals (see caption). The black line is a best fit to the ellipticals and S0 galaxies in the Coma cluster of Jørgensen et al. (1996). The Mg - relation of elliptical galaxies and S0’s acts as an upper envelope for the Sa galaxies. Although some Sa galaxy centre measurements lie close to the relation, a significant fraction of the galaxies falls below it. The same effect is seen for the H - relation. Here the line of ellipticals and S0 galaxies in Coma is not accurately known, since the H index of a galaxy is crucially dependent on its correction for emission, and very few emission-line corrected H indices have been published in the literature. One sees, however, a well-defined lower envelope in the red points. Using the argumentation of Schweizer et al. (1992), the line of galaxies in Coma would correspond to old stellar populations, while deviations would be caused by younger stars. The fact that our Sa bulges mostly lie below the Mg - relation or above the H - relation would indicate that the centres of Sa bulges generally are significantly younger than early-type galaxies in the Coma cluster.
This result appears to contradict the tight Mg2 – relation for bulges found by FB02 and also the relation by Jablonka et al. (1996). It confirms, however, the results of Prugniel et al. (2001), also described by FB02, who find several early-type spiral galaxies lying considerably below the Mg2 – relation. Notice that there are several S0 galaxies that are far away from the relation defined by elliptical galaxies, in the same location as the spirals with the lowest Mg values. We have converted the central Mg2 values of Jablonka et al. (1996) to Mg using the tight relation of the Vazdekis et al. (1996) models and plotted them as black crosses. The position of those black crosses is not very different from our bulges, ellipticals and lenticulars. The galaxies of Bender, Burstein & Faber (1993) have been selected to be lenticulars, so it is no surprise that they agree well with FB02. One should note that there is a small offset for the red points, since their central Mg indices are in general slightly higher than the value inside re/8. Since the velocity dispersion profiles of the ellipticals and S0 galaxies are generally rising inward they are probably moving slighly along the line. In FB02 some more details of this figure are discussed.
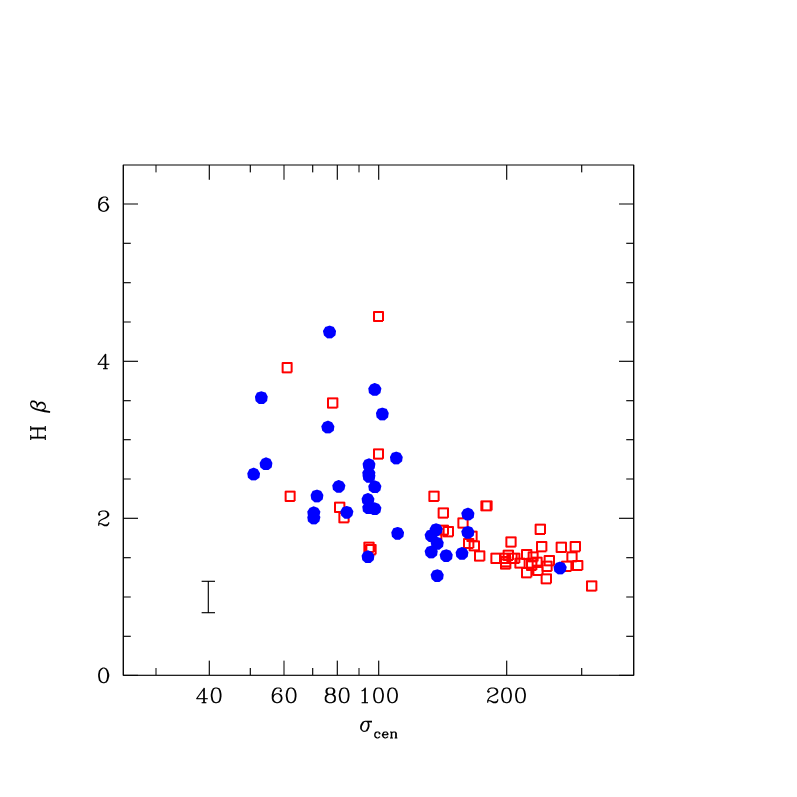
In the region of interest ( 120 km/s) the galaxies of FB02 generally have higher Mg than the galaxies of this sample. Why this difference? The only important difference between the two samples is the inclination distribution. If the young stellar populations would be concentrated in the plane we would see only old stellar populations in the inclined sample at 5 above the plane, if the radial extent of the young stellar populations would be limited to the very central regions, while this would not be the case for the SAURON sample. Fortunately, we know more about the sample of FB02. From colours from HST Peletier et al. (1999) found that the stellar populations at 5 on the minor axis of all these galaxies are old (9 2 Gyr), except for their 3 Sbc galaxies. The fact that we have two-dimensional stellar population information for the SAURON galaxies allows us to understand the position of the points in the Mg - diagram much better. We have therefore labeled three typical points in this diagram, one on the line, and two below it. For these three points we show the H absorption line maps in Figure 7. They indicate that the stellar populations for the galaxy on the line, NGC 4698, are old, while the H maps for the two galaxies below the line show signatures typical of galaxies with young stellar populations. In both the latter galaxies the regions with young stars are extended. Would NGC 4369, if seen at higher inclination, lie on the relation of FB02? Since the region dominated by young stellar populations is extended, going out to about 10′′ on the minor axis, one would see the old stellar populations at 5′′ on the minor axis if the inclination would be larger than 60o and the young populations would be distributed in a thin disc. NGC 2273 would look old at 5′′ on the minor axis at any inclination angle, since the region of young stars here is small. This qualitative comparison shows, although not very precisely, that the inclination distribution might be the only difference between the sample of FB02 and the SAURON Sa sample. Note that the Mg - relation for the Coma cluster is a relation for the oldest galaxies that not necessarily all have the same old age of 10 Gyr. This means that the distance of a galaxy from the line of Coma-galaxies is a measure of the age-difference between the galaxy and the oldest galaxy at the same , not of its absolute age. Since differences in metallicity almost do not affect H (e.g. Paper VI) the H - diagram is a much cleaner diagram to study these age-differences (Fig. 6). Here one can also see the large spread in age for galaxies with low central velocity dispersion. A comparison with the sample of FB02 is unfortunately not possible here.
One might wonder what determines the stellar populations in the centre. For elliptical galaxies there is a strong relation between the total luminosity and the central Mg2 index (Guzmán et al. 1992, Jørgensen et al. 1996), or the central velocity dispersion. Since also correlates with luminosity (e.g. Bender et al. 1993) there is a strong correlation between the total galaxy mass and the central stellar populations. It is not clear whether a similar relation also holds for spiral galaxies, although there is a tight relation between the central metallicity from the ionised gas and the mass of spiral galaxies (Zaritsky et al. 1994). For our objects, the Mg – MB relation (not shown) is much less tight than the Mg – relation, implying that the central stellar populations are probably determined more by the local concentration of matter than by the mass of the galaxy itself. In the same way, there is no good correlation between Mg and W, the inclination-corrected velocity width of the 21cm profile, generally considered a good mass indicator of galaxies. Or alternatively, one could say that central stellar populations are determined more by the central regions than by the galaxy itself. This indicates that the stellar populations in the bulge are probably determined more locally, e.g. by the Star Formation mode, than globally by the mass of the whole galaxy. This would be a relation similar to the one between bulge mass and black hole mass (e.g., Tremaine et al. 2002) which is tighter than the relation of black hole mass and total galaxy mass.
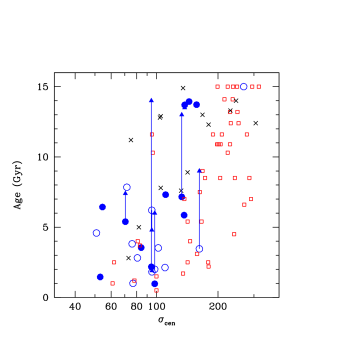
6.2 SSP age as a function of
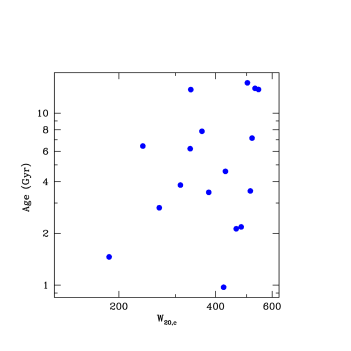
Up to this point most of the analysis is based purely on data, without invoking any stellar population modeling. We now look at the results of the SSP-analysis. In Fig. 8 we have plotted the central SSP-age versus the central velocity dispersion. Surprisingly, we find that below = 100 km/s none of the galaxies is old, and that the average age drops very fast when going to fainter galaxies. Compared to the early-type galaxies of Paper VI Sa galaxies are slightly older for a given or have a lower central velocity dispersion for a given age. One finds, however, an opposite effect when comparing the Sa galaxies with the elliptical galaxies in the Virgo cluster of Yamada et al. (2006), which for the same central velocity dispersion are younger. We might tentatively conclude that the morphological type of the galaxy is less tightly correlated with the central stellar populations than the central velocity dispersion, for the types of galaxies concerned (ellipticals, S0s and Sa galaxies). There are early-type galaxies with young central stellar populations, and also Sa galaxies. In the same way there are Sa galaxies with old central stellar populations. We see that for a given velocity dispersion the Virgo ellipticals are slightly older than our cluster Sa’s, which in turn are slightly older than our field Sa’s. The apparent differences in age with the sample of Yamada et al. might also be partly due to the slightly different method used to derive ages. Interesting also is that ages at 5 from the centre on the minor axis are generally older than central ages, strengthening our interpretation of Figs. 5, 6 and 7. If we use the central velocity dispersion as an indicator of mass, we find that our trend of galaxy mass with age is similar to the result of Kauffmann et al. (2003), based on Sloan Digital Sky Survey data, which says that there are two groups of galaxies, with the less massive galaxies much younger than the massive ones, separated at about 31010 M⊙. For the spirals galaxies as a whole we do not have a clear mass - age relation. Using the inclination-corrected 21-cm velocity width (Table 1), a mass-indicator based on the rotation velocity of the gas in the outer disc regions, we see that a clear mass-age trend, as indicated by Kauffmann et al. (2003) is probably not present (Fig. 9), although the oldest galaxies are indeed some of the largest ones. It looks as if bulge mass is a much more important parameter determining the central stellar populations, rather than total mass.
6.3 Sigma drops
Central velocity dispersion minima (i.e., sigma drops) are rather common in our sample (Paper VII). In this paper we observe distinct dispersion drops in 11 out of 24 galaxies (46%). This is probably a lower limit considering the medium spatial resolution of our SAURON data. In Table 1 we give the ratio of the velocity dispersion in the central aperture of radius 12 and the maximum stellar velocity dispersion in the SAURON field. For 14 of our 24 galaxies this ratio is significantly lower than 1 (lower than 0.96). For three of those, NGC 2844, 4245 and 4293, the scatter in the velocity dispersions in the individual bins is such that one discovers the sigma drop only after a more careful analysis of the velocity dispersion map, and for that reason they were not mentioned in paper VII. In later type galaxies this fraction is higher than 46%. In a paper by Ganda et al. (2006) we show that the velocity dispersion profiles of galaxies of morphological type Sbc and later are generally rising across the whole SAURON field. As a comparison, Chung & Bureau (2004) revealed a sigma drop frequency of about 40% in a sample of 30 nearly edge-on S0-Sbc galaxies, which is consistent with our findings. The first observed cases of central velocity dispersion minima date back to the late 80s and early 90s (e.g., Bottema 1989, 1993). However, this subject has started to gain significant attention in the last years. Emsellem et al. (2001) proposed that these were the result of gas forming stars in central discs (see also Márquez et al. 2003, and Emsellem 2006 for a recent review). The first modeling of this effect was presented in Wozniak et al. (2003). Here, the 2-dimensional data clearly confirm that the drops are caused by central discs (Paper VII). Since sigma drops are rarely seen in ellipticals, but common in spirals, this is one of the aspects in which spirals and ellipticals differ. Sigma drops could be caused by stars forming in central gas discs later on in the evolution of the galaxy. These discs are formed as dynamically cold systems, and slowly heat up. As long as they are cold, and are responsible for a significant fraction of the light, they will produce drops at any inclination, if they are dominating the light. This interpretation is consistent with N-body and SPH simulations of, e.g., Wozniak & Champavert (2006), who form discs from gas inflow towards the central regions of the galaxy and subsequent star formation. Note for example the central regions of NGC 4274. In the star formation ring the velocity dispersion is low, since the light is dominated by a young, cold, disc, causing the central sigma-drop. In the outer regions, where the velocity dispersion is higher, the light mainly comes from old stars.
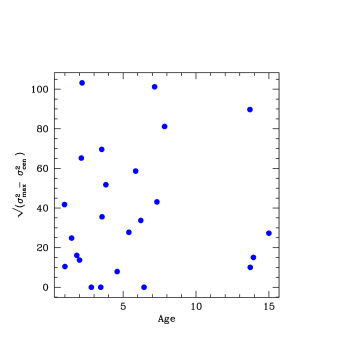
Having determined the stellar population age, we investigate how long a central disc that causes a -dip can survive. To quantify the sigma drops we azimuthally averaged the velocity dispersion along isophotes (in the same way as was done in Ganda et al. 2006) and used that to normalize the central velocity dispersion. We then plot the square root of the quadratic difference between the maximum and central velocity dispersion in Fig. 10 (with numbers tabulated in Table 1). This is a measure of the size of the central dip. If no dip is present this parameter is equal to zero. Here we see an interesting effect. Although the fraction of -drops for young galaxies is larger, very old central discs exist as well. The oldest galaxy with a -drop is NGC 4235. This galaxy has a Seyfert 1 nucleus, which shows up as a lower Mg and H value in the very centre. So, it is likely that the stellar age calculated there is not very accurate. However, in the rest of the inner disc (Paper VII) old ages are found (Figure 1). We conclude that central discs can survive long. This is consistent with the simulations of Wozniak & Champavert (2006), who, however, stop their simulation at 2.1 Gyr, but report that the amplitude of the -drop had remained the same for the last Gyr. Paper VIII shows the age distribution of kinematically-decoupled cores (KDCs). All large-scale KDCs (1 kpc), present in slow-rotating galaxies, appear old, while most small-scale KDCs ( 300 pc), present in fast-rotating galaxies, appear young. Their interpretation is that they are also discs, which like any stellar population will slowly fade, until the surface brightness is low enough to be totally overcome by the main galaxy body. The sigma drops we see here are extended (size 5), and mostly older than 1 Gyr. They might be similar to objects such as the central discs in giant ellipticals (see a discussion in paper VIII).
7 Discussion
7.1 Star Formation Modes
In Section 5 we have found that stellar populations in the centres of early-type spirals seem to consist of an underlying old stellar population, together with localized younger stellar populations, either in central discs, rings or more irregular structures. Is this consistent with what we know from previous work?
Current wisdom in the literature is that there are two modes of star formation (Kennicutt 1998). The first manifests itself by a strong relation between the morphological type and the amount of star formation, as measured from H. This causes the average star formation rate to increase monotonically with morphological T-type. There is however a real scatter in the star formation per galaxy of about a factor 10. Several factors contribute to the variations in the Star Formation Rate (SFR), including variations in gas content, nuclear emission, interactions, and possibly short-term variations in the SFR within individual objects.
The second mode can be found in the circumnuclear regions of many spiral galaxies, which harbor luminous star-forming regions. They have properties that are largely decoupled from those of the more extended star-forming discs (Morgan 1958, Sérsic & Pastoriza 1967). The physical conditions in the circumnuclear star-forming discs are distinct in many respects from the more extended star-forming discs of spiral galaxies. The circumnuclear star formation is especially distinctive in terms of the absolute range in SFRs, the much higher spatial concentrations of gas and stars, and its burst-like nature (in luminous systems) (Kennicutt 1998).
In contrast to the extended star formation in discs, which varies dramatically along the Hubble sequence, circumnuclear star formation occurs mostly in early-type spiral galaxies. Stauffer (1982), Keel (1983), Ho et al. (1997) investigated the dependence of nuclear H emission in star forming nuclei as a function of galaxy type. They found that the detection frequency of HII region nuclei is a strong monotonic function of type, increasing from 0% in elliptical galaxies to 8% in S0, 22% in Sa, 51% in Sb, and 80% in Sc - Im galaxies, although these fractions may be influenced somewhat by AGN contamination. Among the galaxies with nuclear star formation, the H luminosities show the opposite trend; the average extinction-corrected luminosity of HII region nuclei in S0 - Sbc galaxies is nine times higher than in Sc galaxies. Thus, the bulk of the total nuclear star formation in galaxies is weighted toward the earlier Hubble types, even though the frequency of occurence is higher in the late types. Kormendy & Kennicutt (2004) report that the central star formation accounts for 10 - 100% of the total SFR of spiral galaxies. The highest fractions occur in early-type spiral galaxies, which typically have low SFRs in their outer discs (Kennicutt & Kent 1983).
Although the picture described above was derived primarily from H images, we see exactly the behaviour described above in our current sample. Our galaxies, all early-type spirals, and most of them of type Sa, show a much larger range in age than ellipticals and S0s, derived both from the index-index diagrams and from the Mg (or H )- diagram. Also spatially, one sees that the younger stellar populations are concentrated near the centre or in annuli suggestive of resonance rings (e.g. Byrd et al. 1994). The picture is consistent with all star formation taking place in the disc, and close to the centre.
We find that 29 9 % of our galaxies shows younger stars in rings. This number is compatible with Knapen et al. (2006), who find 30 5%. The real fraction might be higher, since the detection rate also depends on the spatial resolution. The fact that galaxies form stars in rings is not new (see e.g. Benedict et al. 1992 for the beautiful case of NGC 4314 and Knapen et al. 1995 for NGC 4321). Gas surface densities often peak near the ILR (Inner Lindblad Resonance, Combes et al. 1992), lending support to the idea that the inward flow of gas along the bar slows down and as a result the gas piles up between the OILR and the IILR (Outer and Inner Inner Lindblad Resonance, Shlosman et al. 1989). Inner star forming rings are seen in many, predominantly barred, galaxies (Knapen et al. 2006). They find that a large fraction of spiral galaxies show central or circumnuclear H emission, indicating the presence of ionising O or B stars. The galaxies with rings are predominantly found in galaxies of types Sa-Sbc, while central star formation in later type galaxies is generally patchy.
We also find that the galaxies with lower values, or lower values of Mg i.e. generally the smaller galaxies, show a larger range in age than the larger ones. This is not just the case for the Sa galaxies, but also for the earlier types, mostly S0 galaxies. One can find evidence for this effect in several places in the literature. Yamada et al. (2006), from a study of elliptical galaxies in the Virgo cluster, find that the scatter in age is much larger at low than for the most massive galaxies. SDSS results for early-type galaxies (Gallazzi et al. 2006) show the same result. Gavazzi & Scodeggio (1996) and Gavazzi et al (1996) compiled UV, visible, and near-IR photometry for over 900 nearby galaxies. They found an anti-correlation between the SFR per unit mass and the galaxy luminosity, as indicated by broadband colors and H EWs. At least part of this trend seems to reflect the same dependence of SFR on Hubble type discussed above, but a mass dependence is also observed among galaxies of the same Hubble type. Also, a similar effect is seen in early-type galaxies. Kuntschner (2000) finds for elliptical and S0 galaxies in the Fornax cluster that the range in ages for faint galaxies is much larger than for the large galaxies, which all happen to be old. The fainter galaxies also seem to have a different star formation mode. NGC 4369, 4383 or 4405, all fainter than MB=–19, have star formation concentrated in a large central region, and not in rings, as is much more common is brighter galaxies. For spirals Bell & de Jong (2000) find a highly significant correlation between the K-band absolute magnitude and age, and also between the gas fraction and age, in the sense that fainter galaxies are younger and have a larger gas fraction (see also Kauffmann et al. 2003). They also find that there is a kind of ’saturation’ in the stellar metallicities: the metallicity of galaxies with an absolute K-band magnitude of –22 is very similar to the metallicity of galaxies with an absolute K-band magnitude of –26. The metallicity of galaxies fainter than an absolute K-band magnitude of –22 can be much lower.
7.2 Star Formation, Bars and Bulge Formation
In Section 6.1 we found that stellar populations in the central regions of highly-inclined galaxies behave differently from those in more face-on galaxies. From that we concluded that young stars must form in the plane of the galaxy, with a small scale height, rather than in the whole bulge. For these Sa galaxies, classified on the basis of their large bulge, this can only mean that in the radial region in which the central disc stars dominate, they are responsible for much, or most of the light that is usually attributed to the bulge (e.g. when doing a bulge-disc decomposition, e.g. Andredakis et al. 1995, de Jong 1996, McArthur et al. 2003).
An instructive example is the galaxy NGC 3623, which has a bright thin inner disc (see e.g. Paper VII), dominating the central stellar populations. The stellar kinematics show fast rotation and low velocity dispersion in this disc, i.e. disc-like kinematics. Outside the disc, the rotation drops and the velocity dispersion goes up. Obviously the central component, when doing the decomposition, is part of the bulge. Its appearance and kinematics however indicate that it is a disc. Our sample contains more cases like this.
Kormendy & Kennicutt (2004) repeatedly note that the central light distributions of some galaxies are very flat, based on observed axial ratios or spiral structure (see also Kormendy et al. 2006). Figure 8 in Kormendy (1993) shows that a majority of bulges appear rounder than their associated discs. These include the well-known classical bulges in M31, M81, NGC 2841, NGC 3115, and NGC 4594 (the Sombrero galaxy). Some bulges have apparent flattenings that are similar to those of their associated discs, as Kent (1985) noted. Some bulges, however, appear more flattened than their associated discs; these may be inner bars. Fathi & Peletier (2003) show that there is tentative evidence that in late-type spirals the flattening of bulges is larger than in early-type spirals.
When one considers the nuclear and circumnuclear star formation, one finds a strong correlation with bar structure, and the virtual absence of any other dependence on morphological type (Kennicutt 1998). This implies that the evolution of the circumnuclear region is largely decoupled from that of the disc at larger radii. The strong distinctions between early-type and late-type barred galaxies appear to be associated with the structural and dynamical properties of the bars. Bars in bulge-dominated, early-type spirals tend to be very strong and efficient at transporting gas from the disc into the central regions, while bars in late-type galaxies are much weaker and are predicted to be much less efficient in transporting gas (e.g. Athanassoula 1992, Friedli & Benz 1995). All of the results are consistent with a general picture in which the circumnuclear SFRs of galaxies are determined largely by the rate of gas transport into the inner regions. Kormendy & Kennicutt (2004) claim that in this way so called pseudo-bulges are formed, components that dominate the light in the centre, but have disc-like properties. They estimate a typical formation timescale for the central discs of 1 Gyr. Since circumnuclear star-forming rings of this type are seen in 10% of intermediate-type spiral galaxies (Sérsic 1973, Maoz et al. 1996) they suggest that about half of unbarred spirals and nearly all barred spirals may have formed central disks in this mass range.
According to the current literature there are several kinds of bulges. Bulges that photometrically (r1/4 surface brightness law) and kinematically (slowly rotating, but with high , Emsellem et al. 2007) resemble elliptical galaxies are often called classical bulges (Kormendy & Kennicutt 2004). A bulge consisting only of the fast-rotating component is called a pseudo-bulge in this reference. In making this classification Kormendy & Kennicutt rather simplify things, since e.g. Balcells et al. (2003) show that very few bulges have real r1/4 surface brightness profiles. Athanassoula (2005) claims that there are three types of bulges: the classical bulges, which form by collapse or merging, disc-like bulges, which result from the inflow of (mainly) gas to the centre-most parts, and subsequent star formation, and boxy and peanut bulges, which are seen in near-to-edge-on galaxies and which are in fact just a part of the bar seen edge-on, and therefore not part of the bulge in the definition of this paper (Section 1). Here we add another piece of the puzzle. From the stellar population distribution, by comparing a sample uniformly distributed in inclination with a sample biased towards high inclination we infer that galactic bulges have more than one physical component: generally they have a slowly-rotating, elliptical-like component, and one or more fast-rotating components in the plane of the galaxy. This picture also nicely explains the fact that bulge populations in general are very similar to those in the disc (e.g. Peletier & Balcells 1996, Terndrup et al. 1994). Fisher (2006) finds one more piece of evidence. In galaxies which he classifies as having a disc-like bulge the central star formation rate, as obtained from the Spitzer 3.6 - 8.0 m colour, is higher than in galaxies with classical bulges. This shows that the Spitzer colour measures similar things as our optical line indices. Our conclusions here is that we see classical and disc-like bulges, which in many cases co-exist in the same galaxy.
The Galactic Bulge also fits well into this picture. Zoccali et al. (2003) find that stars in the Galactic Bulge, measured 6 degrees above the Galactic plane, are as old as Galactic globular clusters, at least 10 Gyr. This indicates that our Galaxy probably has an old central bulge component, maybe similar to a classical bulge. We do not know of a component with disc-like kinematics in our Galaxy, but near the Galactic centre stars are currently being formed at a fast rate. The Galaxy has a significant bar, though (Binney et al. 1991; Weiland et al. 1994). Also, the Galaxy has a prominent molecular ring, and the radial velocity dispersion of the bulge and inner disc are the same ( 100 km/s; Lewis & Freeman 1989; Spaenhauer, Jones & Whitford 1992).
In the centres of almost all nearby early-type spirals, evidence is also seen for the presence of an inner disc-like component (Peletier et al. 1999). Dust extinction is detected in 95% of their sample, sometimes associated with blue light, indicating star formation. It is possible that many galaxies contain small star forming discs with diameters of about 100 pc in their centre, on top of central star clusters (e.g. Böker et al. 2002, Carollo et al. 1998, Balcells et al. 2003). These components are also disc-like components, photometrically belonging to the bulge. Bulges often have several dynamical components (see e.g. Paper VII, Falcón-Barroso et al. 2003), with different kinematics, so it looks as if bulges are not just disc-like or elliptical-like, but consist of several components. The current sample indicates that, at least in Sa galaxies, both disc-like and elliptical-like or classical bulges often coexist.
Coming back to the definition of bulges: if one would define a bulge as a kinematically slowly rotating system, one would find that in the central regions of many Sa galaxies the light would be dominated by another component, with disk-like properties, being flatter, and rotating faster. If one would adopt a morphology-based definition, and take as the bulge the component that is boxy or peanut-shaped, one would get a component that also includes the thick part of an inner bar, i.e. a fast rotating disk component (Kuijken & Merrifield 1995, Chung & Bureau 2004, Bureau & Athanassoula 2005). It is therefore important to understand what definition is used when discussing bulge properties.
8 Conclusions
The main conclusions of this paper are:
We have presented absorption line strength maps in H, Fe 5015, and Mg of a sample of representative early-type spiral galaxies, mostly of type Sa. This paper constitutes the first large sample of spirals with spatially resolved absorption line strengths.
-
1.
The absorption line maps show that many galaxies contain some younger populations, formed in mini-starbursts in small or large inner discs (100-1000 pc), or in circumnuclear star forming rings, often related to bars. These mini-starburst cause a considerable scatter in index-index diagrams such as Mg – H and Mg – Fe 5015 , more than is measured for early-type galaxies. As a result, there is not only a wide range in ages, even within the galaxies, but also in abundance ratio Mg/Fe. The different star formation modes (starbursting and more quiescent) are also reflected in the large range of Mg/Fe that is observed.
-
2.
All of our galaxies lie on or below the Mg – relation for elliptical galaxies in the Coma cluster by Jørgensen et al. (1996). If that relation is considered to be a relation for old galaxies we see that our sample of spirals has a considerable scatter in age, with the highest scatter at the lowest , i.e. for the faintest galaxies.
-
3.
To explain this result, and also the result from the literature that stellar populations on the dustfree minor axis of inclined spirals are generally old, we conclude that star formation in the inner regions only occurs in a thin disc. Since this inner disc dominates the light in many cases, it dominates the light of the bulge. Above the plane, the light is dominated by another galaxy component, resembling an elliptical galaxy, consisting of old stars. In this way one can explain in a natural way the different types of bulges given by Kormendy & Kennicutt (2004) and Athanassoula (2005).
-
4.
Sigma drops are found in about half our sample and are probably caused by these fast rotating flat central discs. The stellar populations in these inner components are not significantly younger than those in galaxies without them, indicating that the discs causing the velocity dispersion drops can be long-lived.
Acknowledgements
It is a pleasure to thank the ING staff, in particular Rene Rutten, Tom Gregory and Chris Benn, for enthusiastic and competent support on La Palma. We thank Martin Bureau for useful comments on the manuscript and Kambiz Fathi, Philippe Prugniel and Marc Balcells for help during the process of this work. Alexandre Vazdekis is acknowledged for providing us his new MILES-based models in advance of publication, and Rob Proctor for giving us the data of his papers in electronic format. The SAURON project is made possible through grants 614.13.003 and 781.74.203 from ASTRON/NWO and financial contributions from the Institut National des Sciences de l’Univers, the Université Claude Bernard Lyon I, the universities of Durham, Leiden, Groningen and Oxford, the British Council, PPARC grant ‘Extragalactic Astronomy & Cosmology at Durham 1998–2002’, and the Netherlands Research School for Astronomy NOVA. RLD the award of a Research Fellowship from the Leverhulme Trust.
References
- Afanasiev & Sil’chenko (2005) Afanasiev V. L., Sil’chenko O. K., 2005, A&A, 429, 825
- Allard et al. (2006) Allard E. L., Knapen J. H., Peletier R. F., & Sarzi, M., 2006, MNRAS, 371, 1087
- Andredakis, Peletier, & Balcells (1995) Andredakis Y. C., Peletier R. F., Balcells M., 1995, MNRAS, 275, 874
- Athanassoula (1992) Athanassoula E., 1992, MNRAS, 259, 328
- Athanassoula (2005) Athanassoula, E. 2005, MNRAS, 358, 1477
- Bacon et al. (2001) Bacon R., et al., 2001, MNRAS, 326, 23 [Paper I]
- Balcells & Peletier (1994) Balcells M., Peletier R. F., 1994, AJ, 107, 135
- Balcells et al. (2003) Balcells M., Graham A. W., Domínguez-Palmero L., Peletier R. F., 2003, ApJ, 582, L79
- Bell & de Jong (2000) Bell E. F., de Jong R. S., 2000, MNRAS, 312, 497
- Bender, Burstein, & Faber (1993) Bender R., Burstein D., Faber S. M., 1993, ApJ, 411, 153
- Benedict et al. (1992) Benedict G. F., Higdon J. L., Tollestrup E. V., Hahn J. M., Harvey P. M., 1992, AJ, 103, 757
- Benedict et al. (1993) Benedict, G. F., et al. 1993, AJ, 105, 1369
- Benedict et al. (1996) Benedict, G. F., Smith, B. J., & Kenney, J. D. P. 1996, AJ, 112, 1318
- Bica (1988) Bica, E. 1988, A&A, 195, 76
- Binney et al. (1991) Binney, J., Gerhard, O. E., Stark, A. A., Bally, J., & Uchida, K. I. 1991, MNRAS, 252, 210
- Böker et al. (2002) Böker T., Laine S., van der Marel R. P., Sarzi M., Rix H.-W., Ho L. C., Shields J. C., 2002, AJ, 123, 1389
- Bottema (1989) Bottema R., 1989, A&A, 221, 236
- Bottema (1993) Bottema R., 1993, A&A, 275, 16
- Bournaud & Combes (2002) Bournaud, F., & Combes, F. 2002, A&A, 392, 83
- Bureau & Athanassoula (2005) Bureau M., Athanassoula E., 2005, ApJ, 626, 159
- Burstein et al. (1984) Burstein D., Faber S. M., Gaskell C. M., Krumm N., 1984, ApJ, 287, 586
- Buta & Combes (1996) Buta R., Combes F., 1996, FCPh, 17, 95
- Byrd et al. (1994) Byrd, G., Rautiainen, P., Salo, H., Buta, R., & Crocher, D. A. 1994, AJ, 108, 476
- Cappellari & Copin (2003) Cappellari M., Copin Y., 2003, MNRAS, 342, 345
- Carollo et al. (1997) Carollo, C. M., Stiavelli, M., de Zeeuw, P. T., & Mack, J. 1997, AJ, 114, 2366
- Carollo, Stiavelli, & Mack (1998) Carollo C. M., Stiavelli M., Mack J., 1998, AJ, 116, 68
- Carollo (1999) Carollo, C. M. 1999, ApJ, 523, 566
- Chung & Bureau (2004) Chung A., Bureau M., 2004, AJ, 127, 3192
- Cid Fernandes et al. (2004) Cid Fernandes R., et al., 2004, ApJ, 605, 105
- Cid Fernandes et al. (2005) Cid Fernandes, R., González Delgado, R. M., Storchi-Bergmann, T., Martins, L. P., & Schmitt, H. 2005, MNRAS, 356, 270
- Combes et al. (1990) Combes F., Debbasch F., Friedli D., Pfenniger D., 1990, A&A, 233, 82
- Combes et al. (1992) Combes F., Gerin M., Nakai N., Kawabe R., Shaw M. A., 1992, A&A, 259, L27
- Davies, Sadler, & Peletier (1993) Davies R. L., Sadler E. M., Peletier R. F., 1993, MNRAS, 262, 650
- Davies et al. (2001) Davies R. L., et al., 2001, ApJ, 548, L33
- de Jong (1996) de Jong R. S., 1996, A&A, 313, 45
- de Vaucouleurs et al. (1991) de Vaucouleurs G., de Vaucouleurs A., Corwin H. G., Buta R. J., Paturel G., Fouque P., 1991, Third Reference Catalogue of Bright Galaxies, Springer-Verlag Berlin Heidelberg New York
- de Zeeuw et al. (2002) de Zeeuw P. T., et al., 2002, MNRAS, 329, 513 [Paper II]
- Eggen, Lynden-Bell, & Sandage (1962) Eggen O. J., Lynden-Bell D., Sandage A. R., 1962, ApJ, 136, 748
- Emsellem et al. (2001) Emsellem, E., Greusard, D., Combes, F., Friedli, D., Leon, S., Pécontal, E., & Wozniak, H. 2001, A&A, 368, 52
- Emsellem (2006) Emsellem, E. 2006, ArXiv Astrophysics e-prints, arXiv:astro-ph/0610834
- Emsellem et al. (2007) Emsellem, E., Cappellari, M. Krajnovic, D., et al., 2007, submitted to MNRAS
- Erwin & Sparke (2003) Erwin, P., & Sparke, L. S. 2003, ApJS, 146, 299
- Erwin (2004) Erwin, P. 2004, A&A, 415, 941
- Faber (1973) Faber S. M., 1973, ApJ, 179, 731
- Faber et al. (1985) Faber S. M., Friel E. D., Burstein D., Gaskell C. M., 1985, ApJS, 57, 711
- Faber et al. (1989) Faber, S. M., Wegner, G., Burstein, D., Davies, R. L., Dressler, A., Lynden-Bell, D., & Terlevich, R. J. 1989, ApJS, 69, 763
- Falcón-Barroso, Peletier, & Balcells (2002) Falcón-Barroso J., Peletier R. F., Balcells M., 2002, MNRAS, 335, 741, FB02
- Falcón-Barroso et al. (2003) Falcón-Barroso J., Balcells M., Peletier R. F., Vazdekis A., 2003, A&A, 405, 455
- Falcón-Barroso et al. (2006a) Falcón-Barroso, J., et al. 2006a, MNRAS, 369, 529 [Paper VII]
- Falcón-Barroso et al. (2006) Falcón-Barroso, J., et al. 2006b, New Astronomy Review, 49, 515
- Fathi & Peletier (2003) Fathi, K., & Peletier, R. F. 2003, A&A, 407, 61
- Fathi et al. (2005) Fathi K., van de Ven G., Peletier R., Emsellem E., Falcón-Barroso J., Cappellari M., de Zeeuw P.T., 2005, MNRAS, 364, 773
- Ferruit et al. (2000) Ferruit, P., Wilson, A. S., & Mulchaey, J. 2000, ApJS, 128, 139
- Fisher et al. (1996) Fisher, D., Franx, M., & Illingworth, G. 1996, ApJ, 459, 110
- Fisher (2006) Fisher, D. B. 2006, ApJ, 642, L17
- Friedli & Benz (1995) Friedli D., Benz W., 1995, A&A, 301, 649
- Friedli et al. (1996) Friedli, D., Wozniak, H., Rieke, M., Martinet, L., & Bratschi, P. 1996, A&AS, 118, 461
- Gallazzi et al. (2006) Gallazzi, A., Charlot, S., Brinchmann, J., & White, S. D. M. 2006, MNRAS, 370, 1106
- Ganda et al. (2006) Ganda K., Falcón-Barroso J., Peletier R. F., Cappellari M., Emsellem E., McDermid R. M., de Zeeuw P. T., Carollo C. M., 2006, MNRAS, 367, 46
- Gavazzi & Scodeggio (1996) Gavazzi G., Scodeggio M., 1996, A&A, 312, L29
- Gavazzi et al. (1996) Gavazzi G., Pierini D., Boselli A., Tuffs R., 1996, A&AS, 120, 489
- Gavazzi et al. (2003) Gavazzi, G., Boselli, A., Donati, A., Franzetti, P., & Scodeggio, M. 2003, A&A, 400, 451
- Gerssen et al. (1999) Gerssen, J., Kuijken, K., & Merrifield, M. R. 1999, MNRAS, 306, 926
- Giuricin et al. (2000) Giuricin, G., Marinoni, C., Ceriani, L., & Pisani, A. 2000, ApJ, 543, 178
- González (1993) González J. J., 1993, PhDT, University of California, Santa Cruz
- Gonzalez & Gorgas (1995) González, J. J., & Gorgas, J. 1995, ASP Conf. Ser. 86: Fresh Views of Elliptical Galaxies, 86, 225
- Gonzalez Delgado & Perez (1996) González Delgado, R. M., & Pérez, E. 1996, MNRAS, 281, 781
- González Delgado et al. (2004) González Delgado, R. M., Cid Fernandes, R., Pérez, E., Martins, L. P., Storchi-Bergmann, T., Schmitt, H., Heckman, T., & Leitherer, C. 2004, ApJ, 605, 127
- Gorgas et al. (1993) Gorgas J., Faber S. M., Burstein D., Gonzalez J. J., Courteau S., Prosser C., 1993, ApJS, 86, 153
- (70) Gorgas, F.J., Jabonka, P. & Goudfrooij, P., 2007, A&A, submitted
- Graham (2002) Graham, A. W. 2002, MNRAS, 334, 859
- Guzman et al. (1992) Guzman R., Lucey J. R., Carter D., Terlevich R. J., 1992, MNRAS, 257, 187
- Haynes et al. (2000) Haynes, M. P., Jore, K. P., Barrett, E. A., Broeils, A. H., & Murray, B. M. 2000, AJ, 120, 703
- Ho et al. (1995) Ho L. C., Filippenko A. V., Sargent W. L., 1995, ApJS, 98, 477
- Ho, Filippenko, & Sargent (1997) Ho L. C., Filippenko A. V., Sargent W. L. W., 1997, ApJ, 487, 579
- Heraudeau & Simien (1996) Heraudeau, P., & Simien, F. 1996, A&AS, 118, 111
- Ho et al. (1995) Ho, L. C., Filippenko, A. V., & Sargent, W. L. 1995, ApJS, 98, 477
- Idiart, de Freitas Pacheco, & Costa (1996) Idiart T. P., de Freitas Pacheco J. A., Costa R. D. D., 1996, AJ, 112, 2541
- Jablonka, Martin, & Arimoto (1996) Jablonka P., Martin P., Arimoto N., 1996, AJ, 112, 1415
- (80) Jablonka P., Gorgas J., Goudfrooij P., 2007, A&A, submitted
- Jiménez-Benito et al. (2000) Jiménez-Benito, L., Díaz, A. I., Terlevich, R., & Terlevich, E. 2000, MNRAS, 317, 907
- Jorgensen, Franx, & Kjaergaard (1996) Jørgensen I., Franx M., Kjaergaard P., 1996, MNRAS, 280, 167
- Kauffmann et al. (2003) Kauffmann G., et al., 2003, MNRAS, 341, 54
- Keel (1983) Keel W. C., 1983, ApJ, 269, 466
- Kennicutt (1992) Kennicutt, R. C., Jr. 1992, ApJS, 79, 255
- Kennicutt & Kent (1983) Kennicutt R. C., Kent S. M., 1983, AJ, 88, 1094
- Kennicutt (1998) Kennicutt R. C., 1998, ARA&A, 36, 189
- Kent (1985) Kent S. M., 1985, ApJS, 59, 115
- Knapen et al. (1995) Knapen J. H., Beckman J. E., Shlosman I., Peletier R. F., Heller C. H., de Jong R. S., 1995, ApJ, 443, L73
- Knapen (2005) Knapen J. H., 2005, A&A, 429, 141
- Knapen et al. (2006) Knapen J. H., Mazzuca L. M., Böker T., Shlosman I., Colina L., Combes F., Axon D. J., 2006, A&A, 448, 489
- Koda et al. (2005) Koda, J., Okuda, T., Nakanishi, K., Kohno, K., Ishizuki, S., Kuno, N., & Okumura, S. K. 2005, A&A, 431, 887
- Kormendy (1993) Kormendy J., 1993, in IAU Symp. 153: Galactic Bulges, p. 209
- Kormendy & Kennicutt (2004) Kormendy J., Kennicutt R. C., 2004, ARA&A, 42, 603
- Kormendy et al. (2006) Kormendy, J., Cornell, M. E., Block, D. L., Knapen, J. H., & Allard, E. L. 2006, ApJ, 642, 765
- Koopmann & Kenney (2004) Koopmann, R. A., & Kenney, J. D. P. 2004, ApJ, 613, 851
- Kuijken & Merrifield (1995) Kuijken, K., & Merrifield, M. R. 1995, ApJ, 443, L13
- Kuntschner (2000) Kuntschner H., 2000, MNRAS, 315, 184
- Kuntschner et al. ( 2006) Kuntschner H., et al., 2006, MNRAS, 369, 497 [Paper VI]
- Lewis & Freeman (1989) Lewis, J. R., & Freeman, K. C. 1989, AJ, 97, 139
- Lütticke et al. (2000) Lütticke, R., Dettmar, R.-J., & Pohlen, M. 2000, A&AS, 145, 405
- MacArthur, Courteau, & Holtzman (2003) MacArthur L. A., Courteau S., Holtzman J. A., 2003, ApJ, 582, 689
- Markarian et al. (1989) Markarian, B. E., Lipovetsky, V. A., Stepanian, J. A., Erastova, L. K., & Shapovalova, A. I. 1989, Soobshcheniya Spetsial’noj Astrofizicheskoj Observatorii, 62, 5
- Márquez et al. (2003) Márquez, I., Masegosa, J., Durret, F., González Delgado, R. M., Moles, M., Maza, J., Pérez, E., & Roth, M. 2003, A&A, 409, 459
- Maoz et al. (1996) Maoz, D., Filippenko, A. V., Ho, L. C., Macchetto, F. D., Rix, H.-W., & Schneider, D. P. 1996, ApJS, 107, 215
- Martinez-Valpuesta et al. (2006) Martinez-Valpuesta, I., Shlosman, I., & Heller, C. 2006, ApJ, 637, 214
- McDermid et al. (2006) McDermid, R. M., et al. 2006, MNRAS, 373, 906 [Paper VIII]
- Möllenhoff & Heidt (2001) Möllenhoff, C., & Heidt, J. 2001, A&A, 368, 16
- Morgan (1958) Morgan W. W., 1958, PASP, 70, 364
- Moorthy & Holtzman (2006) Moorthy, B. K., & Holtzman, J. A. 2006, MNRAS, 371, 583
- Norman, Sellwood, & Hasan (1996) Norman C. A., Sellwood J. A., Hasan H., 1996, ApJ, 462, 114
- Peletier (1989) Peletier R. F., 1989, PhDT, University of Groningen
- Peletier & Balcells (1996) Peletier, R. F., & Balcells, M. 1996, AJ, 111, 2238
- Peletier & Balcells (1997) Peletier, R. F., & Balcells, M. 1997, New Astronomy, 1, 349
- Peletier et al. (1999) Peletier, R. F., Balcells, M., Davies, R. L., Andredakis, Y., Vazdekis, A., Burkert, A., & Prada, F. 1999, MNRAS, 310, 703
- Pérez-Ramírez et al. (2000) Pérez-Ramírez, D., Knapen, J. H., Peletier, R. F., Laine, S., Doyon, R., & Nadeau, D. 2000, MNRAS, 317, 234
- Pfenniger & Norman (1990) Pfenniger D., Norman C., 1990, ApJ, 363, 391
- Pizzella et al. (2002) Pizzella A., Corsini E. M., Morelli L., Sarzi M., Scarlata C., Stiavelli M., Bertola F., 2002, ApJ, 573, 131
- Proctor et al. (2000) Proctor, R. N., Sansom, A. E., & Reid, I. N. 2000, MNRAS, 311, 37
- Proctor & Sansom (2002) Proctor R. N., Sansom A. E., 2002, MNRAS, 333, 517
- Prugniel, Maubon, & Simien (2001) Prugniel P., Maubon G., Simien F., 2001, A&A, 366, 68
- Rejkuba et al. (2005) Rejkuba, M., Greggio, L., Harris, W. E., Harris, G. L. H., & Peng, E. W. 2005, ApJ, 631, 262
- Reshetnikov (1993) Reshetnikov, V. P. 1993, A&A, 280, 400
- Rieke & Lebofsky (1985) Rieke G. H., Lebofsky M. J., 1985, ApJ, 288, 618
- Rubin et al. (1999) Rubin, V. C., Waterman, A. H., & Kenney, J. D. P. 1999, AJ, 118, 236
- Sanchez et al. (2006) Sánchez-Blázquez, P., Peletier, R.F., Jiménez-Vicente, J., Cardiel, N., Cenarro, A.J., Falcón-Barroso J., Gorgas, F.J., Selam, S. & Vazdekis, A., 2006, MNRAS, 371, 703
- Sandage & Bedke (1994) Sandage, A., & Bedke, J. 1994, Washington, DC: Carnegie Institution of Washington with The Flintridge Foundation, 1994
- Sarzi et al. (2000) Sarzi, M., Corsini, E. M., Pizzella, A., Vega Beltrán, J. C., Cappellari, M., Funes, J. G., & Bertola, F. 2000, A&A, 360, 439
- Sarzi et al. (2005) Sarzi M., et al. 2005a, MNRAS, 366, 1151 [Paper V]
- Sarzi et al. (2005) Sarzi, M., Rix, H.-W., Shields, J. C., Ho, L. C., Barth, A. J., Rudnick, G., Filippenko, A. V., & Sargent, W. L. W. 2005b, ApJ, 628, 169
- Schweizer et al. (1990) Schweizer F., Seitzer P., Faber S. M., Burstein D., Dalle Ore C. M., Gonzalez J. J., 1990, ApJ, 364, L33
- Schweizer & Seitzer (1992) Schweizer F., Seitzer P., 1992, AJ, 104, 1039
- Sérsic & Pastoriza (1967) Sérsic J. L., Pastoriza M., 1967, PASP, 79, 152
- Sérsic (1973) Sérsic, J. L. 1973, PASP, 85, 103
- Shlosman, Frank, & Begelman (1989) Shlosman I., Frank J., Begelman M. C., 1989, Nature, 338, 45
- Spaenhauer et al. (1992) Spaenhauer, A., Jones, B. F., & Whitford, A. E. 1992, AJ, 103, 297
- Spinrad & Taylor (1971) Spinrad, H., & Taylor, B. J. 1971, ApJS, 22, 445
- Stauffer (1982) Stauffer J. R., 1982, ApJS, 50, 517
- Terlevich et al. (1981) Terlevich, R., Davies, R. L., Faber, S. M., & Burstein, D. 1981, MNRAS, 196, 381
- Terndrup et al. (1994) Terndrup, D. M., Davies, R. L., Frogel, J. A., Depoy, D. L., & Wells, L. A. 1994, ApJ, 432, 518
- Thomas, Maraston, & Bender (2003) Thomas D., Maraston C., Bender R., 2003, MNRAS, 339, 897
- Trager et al. (1998) Trager S. C., Worthey G., Faber S. M., Burstein D., Gonzalez J. J., 1998, ApJS, 116, 1
- Trager et al. (2000) Trager S. C., Faber S. M., Worthey G., González J. J., 2000, AJ, 119, 1645
- Tremaine et al. (2002) Tremaine S., et al., 2002, ApJ, 574, 740
- Vazdekis et al. (1996) Vazdekis A., Casuso E., Peletier R. F., Beckman J. E., 1996, ApJS, 106, 307
- Vazdekis (1999) Vazdekis, A. 1999, ApJ, 513, 224
- Weiland et al. (1994) Weiland, J. L., et al. 1994, ApJ, 425, L81
- Weiss, Peletier, & Matteucci (1995) Weiss A., Peletier R. F., Matteucci F., 1995, A&A, 296, 73
- Worthey, Faber, & Gonzalez (1992) Worthey G., Faber S. M., Gonzalez J. J., 1992, ApJ, 398, 69
- Worthey (1994) Worthey G., 1994, ApJS, 95, 107
- Worthey et al. (1994) Worthey G., Faber S. M., Gonzalez J. J., Burstein D., 1994, ApJS, 94, 687
- Wozniak et al. (1995) Wozniak, H., Friedli, D., Martinet, L., Martin, P., & Bratschi, P. 1995, A&AS, 111, 115
- Wozniak et al. (2003) Wozniak H., Combes F., Emsellem E., Friedli D., 2003, A&A, 409, 469
- Wozniak & Champavert (2006) Wozniak, H., & Champavert, N. 2006, MNRAS, 369, 853
- Yamada et al. (2006) Yamada Y., Arimoto N., Vazdekis A., Peletier R. F., 2006, ApJ, 637, 200
- Yoshida et al. (1993) Yoshida, M., Yamada, T., Kosugi, G., Taniguchi, Y., & Mouri, H. 1993, PASJ, 45, 761
- Zaritsky, Kennicutt, & Huchra (1994) Zaritsky D., Kennicutt R. C., Huchra J. P., 1994, ApJ, 420, 87
- Zoccali et al. (2003) Zoccali M., et al., 2003, A&A, 399, 931
Appendix A Description of individual galaxies
Here, we briefly comment on the structures observed and provide some relevant references in the literature for the galaxies for which we have been able to find relevant information. These comments are additions to the contents of Appendix A of Paper VII, where we focused on the stellar and gas kinematics, as well as the emission line strengths.We only discuss earlier work in which the galaxies are treated as resolved objects.
- NGC 1056
-
is a rather faint galaxy, classified in NED as Sy 2. It is part of the list of Markarian et al. (1989). Central line strength measurements are also available from Prugniel et al. (2001), who have similar conclusions from Mg2 and . The young central ages are confirmed by low [OIII]/H values. Surface photometry in V and I is given by Heraudeau et al. (1996).
- NGC 2273
-
is a double-barred active (Sy 2) galaxy. Its emission line distribution has been studied by Ferruit et al. (2000). In the inner regions the galaxy has a very dusty zone occupied by young stellar populations in a central disc.
- NGC 2844
-
is an H ii galaxy (NED) showing ongoing star formation, accompanied by dust extinction, in a rather highly inclined ring. The galaxy is also part of the sample of Prugniel et al. (2001).
- NGC 3623
-
is a large member (M 65) of the Leo triplet. Its stellar populations are generally old, with its central disc, clearly seen in the stellar kinematics. Afanasiev & Sil’chenko (2005) used our data for this galaxy, together with line strength maps from the MPFS instrument. They observe a central drop in Mg , and also central drops in Fe 5270 and H . We do not reproduce their result, and find relatively small radial gradients. Also, decreases in Mg are usually coupled with increases in H. It is possible that Afanasiev & Silchenko applied a much lower emission line correction in the middle (see Fig. 1). Line indices are also published by Proctor et al. (2002 and 2000). For a comparison see Section 4. An integrated spectrum is given in Kennicutt (1992).
- NGC 4220
-
displays a prominent dust lane at a distance of 5″ north-east of the centre, with younger stellar populations in the dust lane.
- NGC 4235
-
is a nearly edge-on Seyfert 1.2 galaxy. In the line strength maps one can see the continuum emission of the central AGN in the very centre. Jiménez-Benito et al. (2000) present Fe, Mg and Ca absorption line strengths and find that the Ca triplet lines are stronger than expected from the other lines. This is likely to be due to the non-stellar continuum.
- NGC 4245
-
is a barred galaxy with a prominent dust and star formation ring in the centre (Erwin & Sparke 2003). Its central STIS spectrum was analysed by Sarzi et al. (2005b), who found that the galaxy has an old stellar population together with a small fraction of stars of age 108.5 years old. Möllenhoff & Heidt (2001) perform B/D decompositions for this galaxy in many passbands.
- NGC 4274
-
is a double barred galaxy (Erwin 2004) with significant amounts of dust in the inner parts. The kinematics here is dominated by an inner disc, which is also prominent in molecular CO (Koda et al. 2005). Young stars are formed mainly in a ring around this disc.
- NGC 4293
-
is a relatively highly-inclined galaxy with a strong dust lane passing close to the nucleus and another dust lane about 7″ south of the centre. Young stars are seen in the dust lane closest to the nucleus. As for several of the galaxies of this sample, driftscan spectra are presented by Gavazzi et al. (2003).
- NGC 4314
-
is a low-inclined, well studied barred galaxy in the Virgo cluster (Benedict et al. 1996, Pérez-Ramírez et al. 2000), mainly known for a inner star-forming ring in the inner 10″. Benedict et al. analyse ground-based (1992) and HST-images (1993) of this object. They detect a inner star forming ring in optical and near-IR colors, together with a inner spiral just exterior of the ring. They conclude from the optical and near-infrared photometry that a pattern of younger stars exist, stronger at the ring, and almost disappearing at the linear dust lanes. Other surface photometry was presented by Friedli et al. (1996) and Wozniak et al. (1995). Sarzi et al. (2005b) analyse blue HST STIS-spectra of the centre of this galaxy. They find that the stellar populations are consistent with an old age (1010 years). González-Delgado et al. (2004) measure absorption line indices from central STIS spectra, and classify it as a galaxy with old stellar populations and weak [OI]. The galaxy looks very similar to NGC 4321 (M100), for which a detailed stellar population analysis based on SAURON data is presented by Allard et al. (2006).
- NGC 4369
-
is a faint low-inclination galaxy. The central regions are strongly affected by dust (Falcón-Barroso et al. 2006). Ho et al. (1997) classify the nuclear spectrum as an HII nucleus, indicating a circumnuclear region with star formation activity but without AGN. Koda et al. (2005) show that a significant amount of molecular gas (about 108 M⊙) is found in the central regions of this galaxy.
- NGC 4383
-
is another starburst galaxy in the Virgo cluster (Rubin et al. 1999). Rubin et al. state that this galaxy has an unusually shallow nuclear velocity rise, confirmed in Paper VII. The H + [N II] image of NGC 4383 shows filaments of ionised gas, suggesting significant noncircular gas motions due to the starburst (Koopmann et al. 2004). The SAURON ionised gas velocity field is also possibly suggestive of a starburst outflow. The [OIII] emission in this galaxy is so large that we have some difficulty removing all of it, resulting in very low Fe 5015 absorption line indices. Despite of this the light in the inner regions is dominated by young stellar populations.
- NGC 4405
-
is another faint galaxy with an HII nucleus. This galaxy also has a considerable amount of extinction in the central regions, although less than NGC 4369 or NGC 4383. The H gas map displays several clumps around the centre indicating the starbursting nature of the star formation in this galaxy. The line indices show generally young stellar populations in the central regions.
- NGC 4425
-
is a highly inclined galaxy without much dust with a boxy bulge component (Paper VII). The ionised-gas maps show only patchy traces of emission. The absorption line maps show that the stellar populations are mainly old.
- NGC 4596
-
is a non-interacting, strongly barred, galaxy (Gerssen et al. 1999). The SAURON stellar velocity field displays regular rotation along an axis misaligned with respect to the photometric major axis, due to the presence of a strong bar. The galaxy has an inner disc which dominates the inner 5″ (Paper VII). The galaxy has little ionised gas, and its stellar populations from the SAURON absorption lines are predominantly old. González-Delgado et al. (2004), from central STIS absorption line spectra, classify this galaxy as a galaxy with strong [OI] lines and old stellar populations. Sarzi et al. (2005b), from the same spectra, confirm this result.
- NGC 4698
-
might be considered the example of the early-to-intermediate Sa galaxy (Sandage & Bedke 1994). It contains a low-luminosity Seyfert 2 nucleus (Ho et al. 1997). The stellar kinematics is rather unusual (Paper VII), for example because of the presence of a kinematically decoupled central disc, in which the stars rotate perpendicularly to the stars elsewhere in the central regions ( Pizzella et al. 2002, Sarzi et al. 2000). The galaxy has little ionised gas, and its stellar populations from the SAURON absorption lines are predominantly old. A stellar population analysis from STIS spectra also shows that the central stellar populations are old.
- NGC 4772
-
is a an intermediate size galaxy showing regular rotation along the major axis. The unsharp-masked image reveals a small dusty disc in the centre of the galaxy, the orientation of which seems consistent with that of the ionised gas in the central 5″, but rotating almost in the opposite sense of the stars, in agreement with Haynes et al. (2000). The absorption lines show that the stellar populations are predominantly old in the SAURON field.
- NGC 5448
-
is an active barred galaxy (L2; Ho et al. 1997) with a dusty central region. The stellar kinematics display a regular disc, and signatures of an inner fast rotating component in the central 5″. The ionised-gas kinematics features an ’S-shaped’ zero-velocity curve, suggestive of gas radial motions. We refer the reader to Fathi et al. (2005) for a detailed study of this galaxy using SAURON. In the absorption line maps one sees an increase in H and a decrease in Mg in the central 5″. This is exactly the region of the central disc, and the excess of dust extinction.
- NGC 5475
-
is an isolated, nearly edge-on galaxy (Balcells & Peletier 1994). Colour profiles in optical and near-infrared have been presented in Peletier & Balcells (1996, 1997). The [O iii] emission extends out mainly along the galaxy minor axis, possibly in a polar ring.
- NGC 5636
-
is a faint, strongly barred galaxy in a non-interacting pair with NGC 5638 at 2′, with a stellar velocity dispersion that is one of the lowest in the sample. Our line strength maps are rather noisy, indicating overall old stellar populations with younger stars near the centre. This agrees with the ionised gas maps, which show very low [O iii]/H values, suggesting ongoing star formation there.
- NGC 5689
-
is an almost edge-on barred galaxy with a box-shaped bulge (Lütticke et al. 2000). A strong dust lane is found at 5″ South of the nucleus. Colour maps of Peletier & Balcells (1997) show that this dust lane is also obscuring the centre of the galaxy. Carollo et al. (1997) present an optical HST-image of this galaxy, although no bulge-disc decomposition is done because of the large amount of dust obscuration. Star formation associated to this central dust lane could be responsible for the lower ages we see from the absorption line maps. Line strength values of this galaxy were presented by Proctor et al. (2000).
- NGC 5953
-
is a Liner Seyfert 2 galaxy (NED) closely interacting with NGC 5954 (Reshetnikov 1993, González-Delgado & Pérez 1996). This interactions manifests itself in a kinematically decoupled stellar core, and ionised gas following the motions of this KDC, but rotating perpendicular to the stars in the outer regions of the SAURON field. The galaxy shows a ring of low [O iii]/H (Paper VII, Yoshida et al. 1993). The stellar absorption line maps confirm that this is a star formation ring, with low Mg and Fe 5015 values and high H. A more detailed discussion of this galaxy is given in Falcón-Barroso et al. (2006b).
- NGC 6501
-
is part of a group together with NGC 6467, NGC 6495, PGC 61102 and NGC 6500 (Giuricin et al. 2000). It is a massive galaxy, the most distant of our sample, showing regular rotation and no detection of ionised gas (Paper VII). The absorption line indices are consistent with old stellar populations, confirming the results of Cid-Fernandes et al. (2004, 2005), which are based on an absorption line study using a larger wavelength range.
- NGC 7742
-
is a well-known face-on galaxy (classification T2/L2, Ho et al. 97) hosting a prominent star-forming ring surrounding a bright nucleus (see Paper II), and with the ionised gas counter-rotating w.r.t. the stars (see also Paper VII). The absorption line strength maps show a strong star forming ring, also coindicing with a low [O iii]/H emission line ratio. In the centre, however, we find that the stellar populations are fairly old, something confirmed by the line strength analysis of Cid-Fernandes et al. (2004, 2005).