2MASS Reveals a Large Intrinsic Fraction of BALQSOs
Abstract
The intrinsic fraction of broad absorption line quasars (BALQSOs) is important in constraining geometric and evolutionary models of quasars. We present the fraction of BALQSOs in 2MASS detected quasars within the SDSS DR3 sample in the redshift range of . The fraction of BALQSOs is % in the 2MASS 99% database band completeness sample, and % in the larger 2MASS sample extending below the completeness limit. These fractions are significantly higher than the 26% reported in the optical bands for the same parent sample. We also present the fraction of BALQSOs as functions of apparent magnitudes, absolute magnitudes, and redshift in the 2MASS and SDSS bands. The 2MASS fractions are consistently higher than the SDSS fractions in every comparison, and the BALQSO fractions steadily increase with wavelength from the SDSS to the 2MASS bands. Furthermore, the color distributions of BALQSOs and non-BALQSOs indicate that BALQSOs are redder than non-BALQSOs, with a K-S test probability of . These results are consistent with the spectral difference between BALQSOs and non-BALQSOs including both the absorption troughs and dust extinction in BALQSOs, which leads to significant selection biases against BALQSOs in the optical bands. Using a simple simulation incorporating the luminosity function of quasars and the amount of obscuration for BALQSOs, we simultaneously fit the BALQSO fractions in the SDSS and 2MASS bands. We obtain a true BALQSO fraction of % for luminous quasars ( mag).
1 Introduction
The broad absorption line quasars (BALQSO) are a sub-sample of quasars exhibiting blue-shifted rest-frame ultra-violet absorption troughs (e.g., Weymann et al. 1991). In X-rays, typical absorption columns of (e.g., Gallagher et al. 1999, 2002; Green et al. 2001; Chartas et al. 2001; Grupe et al. 2003) explain the X-ray weakness of the population. The BALQSOs are important in understanding the properties of quasars. In geometric models of quasars, BALQSOs are quasars viewed at large inclination angles close to the equatorial plane (e.g., Weymann et al. 1991; Ogle et al. 1999; Schmidt & Hines 1999; Hall et al. 2002) or the polar direction (Zhou et al. 2006). Other models place BALQSOs at the early stages of quasar evolution (e.g., Hazard et al. 1984; Surdej & Hutsemekers 1987; Boroson & Meyers 1992; Becker et al. 2000).
Under the recent paradigm of the co-evolution of AGN and the host galaxies, BALQSOs are expected to be a manifestation of the AGN kinetic feedback, an energetic output that many recent theoretical models (e.g., Granato et al. 2004) of galaxy evolution advocate to reproduce several observables such as the galaxy stellar mass function. In this scenario the majority of luminous AGNs must have undergone a wind phase and therefore a BAL phase. On the other hand, optical surveys have always detected a small fraction of BALQSOs within their sample. Several studies of optically selected quasar samples indicate that the fraction of BALQSOs, is in the range of 10-22% (e.g., Weymann et al. 1991; Tolea et al. 2002; Hewett & Foltz 2003; Reichard et al. 2003, R03 hereafter). In the radio bands, recent FIRST survey results show that the fraction of BALQSOs in radio selected quasars is about 14–18% (Becker et al. 2000). In the infrared bands, there were hints of larger BALQSO fractions (Voit et al. 1993; Lipari 1994; Egami et al. 1996), but the existing results are difficult to interpret due to the small sample size. Special geometries of the outflows or short duty cycles have then been advocated to explain the deviation from expectations. However, there are other observational results suggesting larger fractions of BALQSOs. Notably, in a gravitationally lensed quasar sample, Chartas (2000) found a BALQSO fraction of 35%, however, the sample size was small. Recently, Trump et al. (2006, T06 hereafter) identified more than 4,000 BALQSOs in the large SDSS DR3 quasar sample (Schneider et al. 2005), and found a BALQSO fraction of 26%.
One important difficulty in estimation of the true BALQSO fraction is the selection bias caused by the UV spectral difference between BALQSOs and non-BALQSOs, which includes both absorption troughs and continuum differences (Sprayberry & Foltz 1992; R03). However, direct modelings of this selection bias lead to different correction factors (e.g., Hewett & Foltz 2003; R03), though the issue is further complicated by different sample selections. Alternatively, we can study the fraction of BALQSOs in a spectral regime that is not significantly affected by these biases to obtain the true fraction of BALQSOs. In this paper, we examine the population of BALQSOs in the near infrared by analyzing the large sample of SDSS-BALQSOs (T06) combining 2MASS (Skrutskie et al. 2006) data. We note that the BALQSO fraction also depends on the definition of BALQSOs used by different studies, and we adopt the definition used by T06.
We assume that , , and throughout the paper.
2 Sample Selection
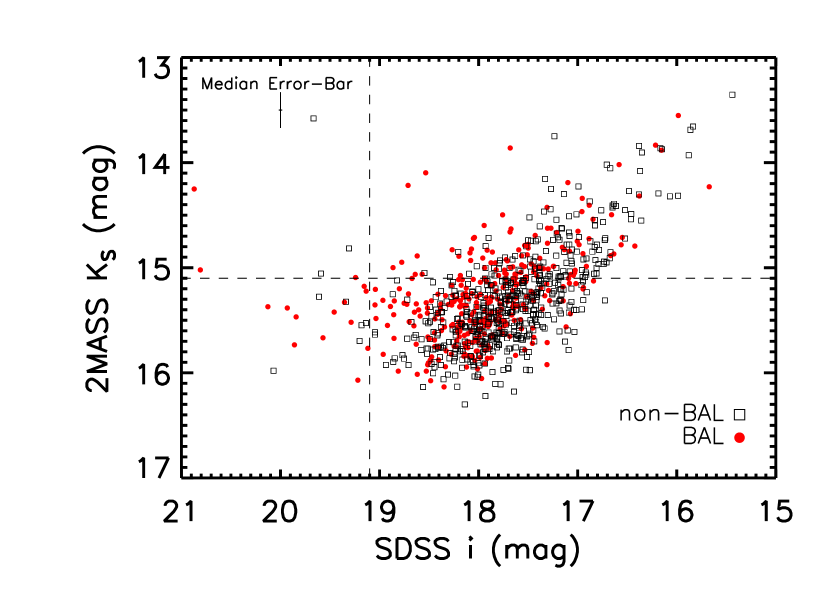
We started from the SDSS DR3 quasar catalog (Schneider et al. 2005) and the SDSS-BALQSO catalog (T06). In particular, we targeted the redshift range of , where the majority of BALQSOs are identified with C iv absorption in the observed-frame optical band pass. We matched the quasars of both BALQSOs and non-BALQSOs (2′′) to entries from the full 2MASS release. We note that not all database entries from the full 2MASS release in the 2MASS All-Sky Point Source Catalog (PSC) satisfy the conservative requirements to be part of the official PSC. Therefore, the completeness of the database entries extend below the official PSC completeness limits111See http://www.ipac.caltech.edu/2mass/releases/allsky/doc/sec6_5a1.html.. The 99% completeness levels of the database are , , and mag. To ensure that matched database entries represent detections, we required an in-band detection (rd_flg != 0), that there was no confusion, contamination (cc_flg == 0), or blending (bl_flg 1) in the source, and that no source was near an extended galaxy (gal_contam == 0 and ext_key is null). Fig. 1 shows the mag versus mag distributions for BALQSOs and non-BALQSOs. The quasars are concentrated in a linear relation between the and magnitudes with scatter. The near infrared quasar sample is limited by the 2MASS flux limits, rather than the SDSS quasar selection. The first flux limit for SDSS quasar selection is at , where quasars are selected in the color cube (Schneider et al. 2005), and the 2MASS sample fails to detect the majority of quasars at this SDSS magnitude limit. About 5.2% of SDSS quasars are detected in 2MASS. This is expected since the 2MASS is a significantly shallower survey than the SDSS survey. We define the “2MASS sample” as quasars detected in all of the , , and bands, and the “ complete sample” as quasars with mag. In §5, we use quasar luminosity functions to model BALQSO fractions above selected absolute magnitude limits. Since 2MASS cannot detect quasars less luminous than the above limits at high redshifts, we also present results for a “narrower redshift” sample, . Our results are not significantly affected by the choice of sample selection.
3 The BALQSO Fraction in 2MASS
We found 884 quasars in the 2MASS sample with 340 BALQSOs and 544 non-BALQSOs. In the complete sample, we found 245, 99, and 146 quasars for total, BALQSOs, and non-BALQSOs, respectively. The BALQSO fraction is % in the complete sample and % in the 2MASS sample. We also tested and band complete samples, obtaining consistent results, % and %, respectively. These BALQSO fractions from 2MASS bands are significantly higher than the 26% in the optical bands (T06). For example, the difference between the BALQSO fraction in optical and the complete sample is 4.4. This result is interesting, as we are analyzing the same parent BALQSO catalog used in the optical study. It indicates that there may be significant selection bias against BALQSOs in the optical photometric surveys. As a corollary the near infrared fraction obtained in this paper (35-40%) represents the true fraction of BALQSOs. Alternatively, BALQSOs may be intrinsically brighter in the near infrared bands or a combination of both effects is possible. We examine the fraction of BALQSOs as functions of apparent magnitude, absolute magnitude, and redshift to investigate the cause for the increase of the BALQSO fractions in the 2MASS bands.
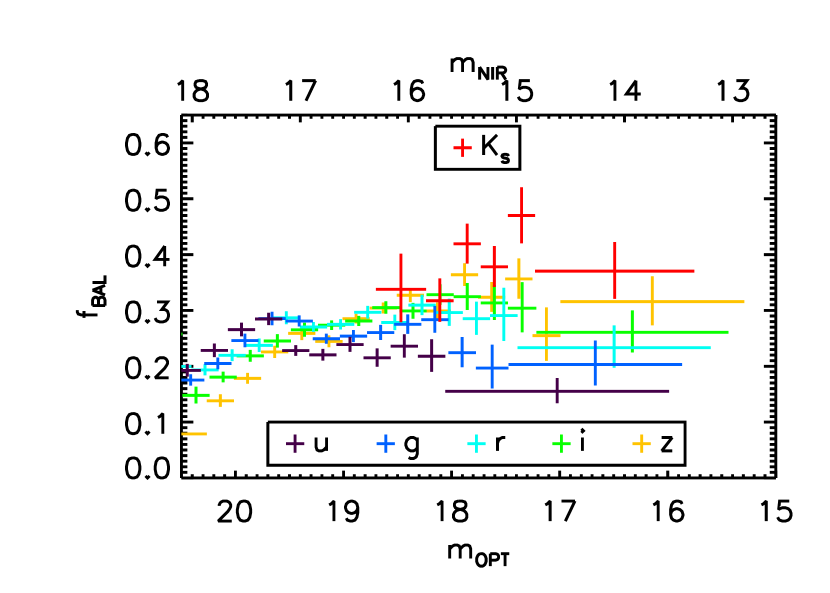
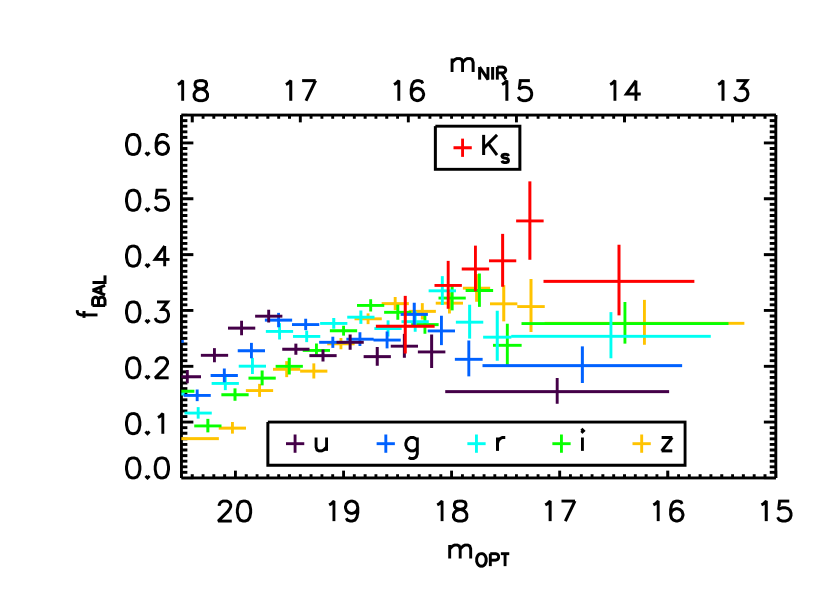
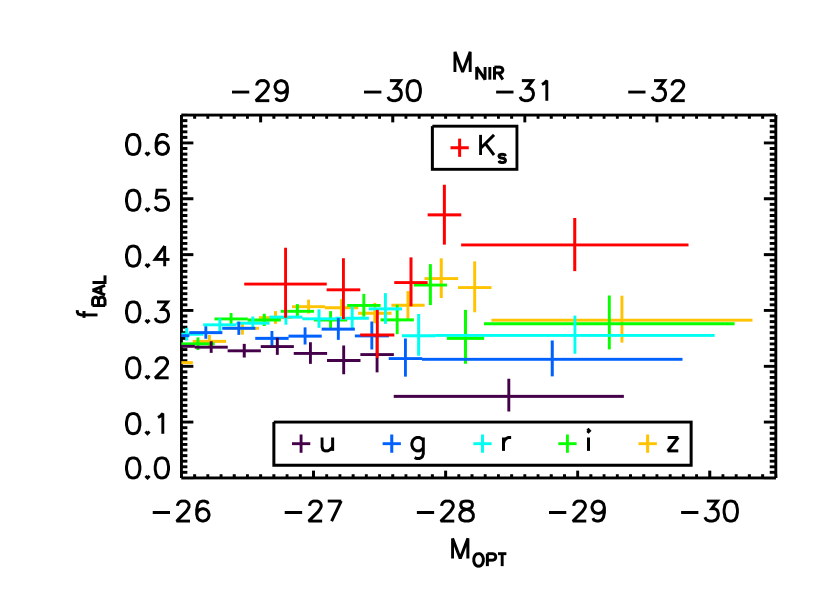
In top panels of Fig. 2 and Fig. 3, we plot the fraction of BALQSOs against the apparent and absolute magnitudes in the , , , , and bands , respectively, in the redshift range of . In the bottom panels of Fig. 2 and Fig. 3, we also show the same plots in the narrower redshift range of . The and band fractions are very similar to but slightly below the band fractions, and we do not show them for clarity reasons. The K-corrections of the quasars are calculated assuming a power-law spectral index of (, Vanden Berk et al. 2001). We did not correct the intrinsic obscuration from dust extinction and absorption troughs for BALQSOs. In both Fig. 2 and Fig. 3, the BALQSO fraction in the band is consistently higher than the optical fractions. In addition, the optical fractions increase with increasing wavelength. The two sets of plots are consistent, except for larger fluctuations in the band fraction for the full redshift sample, which do not affect our main result. In Fig. 2, we note that the optical fractions drop significantly when crossing certain magnitude limits. For example, the band fraction is roughly a constant of 0.3 for mag, and steadily decreases as it crosses the mag limit. The , , , and band fractions behave similarly. Their drop at different magnitudes from the band is expected given the quasar color and differing sensitivities of the optical bands. Although the mag limit is also the spectroscopic limit for SDSS quasars, this limit affects differently for BAL and non-BALQSOs. We caution that there are more uncertainties below this limit, which make it difficult to model this effect.
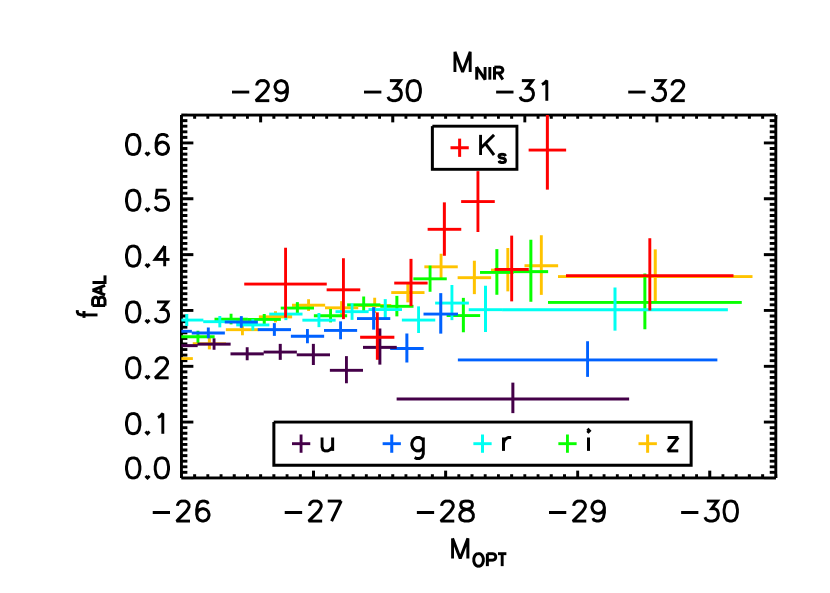
The higher BALQSO fractions in the 2MASS bands, the increase of BALQSO fractions as wavelength increases, and the drop of BALQSO fractions when crossing certain apparent magnitudes in the optical bands suggest significant selection biases against BALQSOs. This is consistent with the spectral differences between BALQSOs and non-BALQSOs. By definition, significant rest-frame ultra-violet continuum flux in BALQSOs is absorbed by the absorption troughs. In addition, there are also signatures of dust indicated by the difference between the continuum emission of the BALQSOs and non-BALQSOs (Sprayberry & Foltz 1992; R03). The composite spectra of BALQSOs and non-BALQSOs (R03) differ significantly for rest-frame Å. For the full redshift range considered, , this spectral difference will affect all of the SDSS filters. However, this spectral difference only affects 2MASS bands marginally as results of dust extinction. The band is affected for BALQSOs, which only represent a small subset of 2MASS detected quasars. In the narrower redshift range, , the and redder bands are not affected by the absorption troughs for the Hi-BALQSOs. Although there will be absorption troughs for Lo-BALQSOs in these red bands, the fraction of Lo-BALQSOs is very small in this redshift range (T06). Since the 2MASS survey is shallower than the SDSS survey, the 2MASS sample is selecting brighter quasars. The difference of the BALQSO fractions between 2MASS and SDSS could be explained if the fractions of BALQSOs are higher for more luminous quasars. However, Fig. 3 shows that the optical fraction is roughly a constant in each band as functions of absolute magnitudes more luminous than , which spans about 5 magnitudes. We further test the idea of optical selection biases by examining the fraction of BALQSOs using the brightest 245 quasars in each band, such that they have similar statistics as in the complete sample. Results are listed in Table 1. The fractions of BALQSOs steadily go up from the band to the band. Tests with other sample sizes show consistent trends.
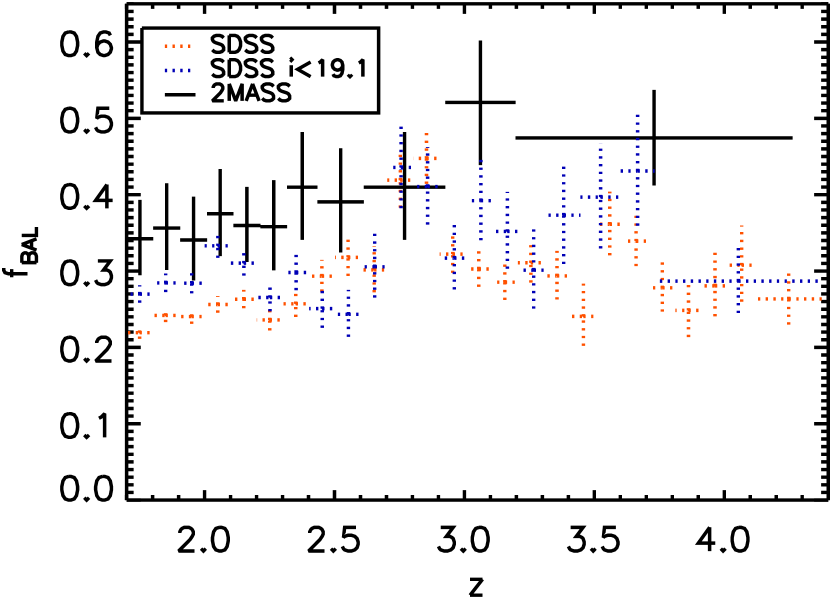
Fig. 4 shows the fractions of BALQSOs as a function of redshift in the band for the 2MASS detected quasar sample, and the band for the SDSS sample. The 2MASS fractions are consistently higher than the SDSS band fractions. The 2MASS fractions are less dependent on the redshift, while the optical fractions show significant variations. In particular, the optical fractions increase significantly in some redshift bins ( and ) close to the value expected from 2MASS fractions. The non-uniformity of the optical BALQSO fractions as a function of redshift suggests significant selection biases against BALQSOs. The excess optical BALQSO fractions at are particularly interesting as they are consistent with the near infrared fractions. These excess fractions are possibly due to the color difference between BALQSOs and non-BALQSOs, which moves BALQSOs further way from the stellar locus. However, the 2MASS bands do not show significant fraction increases at this redshift range, which could also be possibly benefited from the fact that the 2MASS filters are substantially wider than the SDSS filters. We also found that this redshift range is possibly related to the gap between SDSS and filters, considering a C iv absorption line with a BAL velocity of 20,000 km s-1. When the major BAL feature falls between the filter gaps, there are less differences between BALQSOs and non-BALQSOs. Thus, the photometric selection is expected to be less biased against selecting BALQSOs. As a result, the BALQSO fraction in the redshift range would be unbiased. This effect would also be important for other gaps between the SDSS filters. We found a similar increase of BALQSO fraction at the redshift of corresponding to the gap between and filters. However, we did not find the feature for the gap between filters and , which would correspond to the starting edge of our studied redshift range. In addition, a blueshift of 20,000 km s-1seems large given the T06 BALQSO definition. Detailed modeling of this effect using the SDSS filter functions, quasar selection algorithm, and composite BALQSO spectrum is needed to further investigate the origin of the redshift-dependent BALQSO fractions in the optical bands.
4 Comparison of 2MASS Properties of BALQSOs and Non-BALQSOs
In Fig. 1, we can already see color differences between BALQSOs and non-BALQSOs. The median color for BALQSOs and non-BALQSOs are 2.50 and 2.26 mag, respectively, in the 2MASS sample. We plot the histograms of the color of BALQSOs and non-BALQSOs of the 2MASS sample in Fig. 5. BALQSOs are redder than non-BALQSOs. For example, the red tail of the BALQSO distribution is above that for non-BALQSOs. We performed a K-S test to the two distributions and obtained a probability of for the null assumption that the two distributions are drawn from the same parent distribution. The same test using only the complete sample yielded a probability of 0.0001. This is consistent with our analysis in §3 that optical obscuration of BALQSOs can cause significant selection biases against selecting BALQSOs. The difference of the color difference is mainly caused by the mag distribution difference between the two populations. In the complete sample, the K-S probability for the mag distributions of BALQSOs and non-BALQSOs being the same is , while the K-S probability for mag distributions is 0.46. This result is also consistent with previous studies of BALQSOs (R03; T06), where BALQSOs are found to be redder in the SDSS bands. With only nine optically selected BALQSOs, Hall et al. (1997) found no discrepancy between colors of BALQSOs and non-BALQSOs; however, two of their radio selected BALQSOs are particularly red.
The color differences between BALQSOs and non-BALQSOs in the 2MASS bands are smaller and consistent with the expectation that there is an extra dust extinction in BALQSOs. The median and colors are 1.17 and 0.64 mag for non-BALQSOs and 1.26 and 0.67 mag for BALQSOs, with color differences of and mag. These differences are broadly consistent with the R03 dust extinction fit of between BALQSOs and non-BALQSOs, given the observed redshift distribution of the quasars. We have tested the K-S probability that the near infrared color distributions of BALQSOs and non-BALQSOs are drawn from the same sample, and found 0.0009 and 0.49 for the color distributions in the 2MASS sample and complete sample, respectively, and probabilities of 0.36 and 0.78 for the color distributions. The K-S test results are consistent with small 2MASS color differences between BALQSOs and non-BALQSOs.
5 Simulations
We performed simple simulations to model the fractions of BALQSOs in the optical and near infrared bands. We show that the increase of the BALQSO fractions with wavelength can be explained by the selection effects caused by the spectral differences between BALQSOs and non-BALQSOs including both absorption lines and dust extinction. Our simulations are performed in the redshift range of .
We assumed that the intrinsic (extinction and absorption corrected) luminosity functions of BALQSOs, , non-BALQSOs, , and total quasars, , share the same shape, but differ by normalization factors, , where is the intrinsic fraction of BALQSOs. The shape of the luminosity functions are represented by a double power-law luminosity function described by the Richards et al. (2005) luminosity function with a bright end slope of , a faint end slope of , and a break at with , , and in the band. The faint end slope and the break of the luminosity function do not affect our results too much because the quasars in the sample are all significantly more luminous than the break of the luminosity function. The quasar luminosity functions in other bands are obtained by shifting the band luminosity function with the mean color of the quasars (non-BALQSOs) between the and the other bands. Since there are extra intrinsic absorption troughs and dust extinction in BALQSOs, we modeled the obscured luminosity function of BALQSOs, , by shifting the intrinsic BALQSO luminosity function by to model the spectral difference between BALQSO and non-BALQSOs, i.e., . The is a function of wavelength. We obtained the values of from the composite spectra of BALQSOs and non-BALQSOs (R03). Besides the absorption troughs, R03 found that an extra SMC dust extinction for BALQSOs of with fits the continuum spectral differences. We therefore modeled the as two components, with one caused by such a dust extinction and the other by absorption troughs. Since the band is not completely covered by the composite spectra of R03, we cannot fully model the absorption trough dimming and therefore exclude the band in our fitting process. The , , , and bands are also not completely covered; however, since there are few absorption troughs in these band for quasars with , we modeled the from dust extinction only. We list the values of in Table 2.
As discussed earlier, we performed our simulations in the narrower redshift bin . This range avoids the larger optical BALQSO fractions at and . We examined the 2MASS detected quasar absolute magnitudes as a function of redshift. In our redshift range, 2MASS detects quasars more luminous than and mag for the complete sample and 2MASS sample, respectively. To translate these limits to the other bands, we applied the non-BALQSO colors to the magnitude limits. For each band and limit, we calculated the BALQSO fractions and present them in Table 1. Both limits agree qualitatively, and we hereafter use the larger 2MASS sample. In particular, the , , , , , , and limits are -27.46, -27.62, -27.75, -27.91, -28.86, -29.41, and -30.10 mag, respectively. We started with quasar luminosity functions at the mean redshift, , of our narrow redshift sample and considered the fractions from the to bands. We fit these BALQSO fractions using our luminosity functions for BALQSOs and non-BALQSOs with one free parameter, , and obtained with for 6 degrees of freedom (Figure 6). We tested the robustness of our result by using the quasar luminosity functions at and in our fitting process, and obtained consistent fitting results. The fitting results are insensitive to the bright end slope of the luminosity function within the error of (Croom et al. 2004).
Alternatively, it is possible that BALQSOs are more near infrared luminous, which might explain the higher BALQSO fractions in the , , and bands. We tested this idea by fixing with the value from optical fractions and applying an extra brightening of for BALQSOs compared to the previous simulation. We found mag is needed to fit the , , and band fractions. However, the fractions of the , , and bands from this model are significantly lower than the observations. Given our knowledge of the dust extinction and absorption troughs in BALQSOs, a wavelength dependent brightening of BALQSOs is needed from the to band to fit the observed fractions with a low intrinsic BALQSO fraction of 25–30%. Therefore, we consider this model as highly fine-tuned. This supported by the recently result that there is no significant spectral difference between BALQSOs and non-BALQSOs in mid-infrared within a moderate sized sample (Gallagher et al. 2007).
6 Summary and Discussion
We have presented enhanced fractions of BALQSOs in the 2MASS detected quasars within the SDSS DR3 sample compared to fractions derived in optical bands. The relatively large number of near infrared luminous BALQSOs used in our study compared with previous studies argues against discrepancies from small number statistics. The BALQSO fraction is % in the complete sample and % in the 2MASS sample. The complete and samples also have similar fractions. After plotting the BALQSO fractions against apparent and absolute magnitudes in the 2MASS and SDSS bands, we found the 2MASS fractions are consistently higher than the optical fractions. In addition, the BALQSO fractions steadily increase with wavelength from the SDSS to the 2MASS bands. We conclude that the optical photometric systems have significant selection biases against BALQSOs, and the BALQSO fraction in the near infrared more accurately reflects the true fraction of BALQSOs. This is also supported by the color difference between the populations of BALQSOs and non-BALQSOs.
After using a simple simulation incorporating the luminosity function of quasars and the amount of obscuration for BALQSOs, we are able to simultaneously fit the BALQSO fractions in the SDSS and 2MASS bands and obtain a true BALQSO fraction of %, significantly higher than other BALQSO fractions reported in the literature. Although a small sample was used, Chartas (2000) found a BALQSO fraction of 35% in a gravitationally-lensed quasar sample, close to our near infrared BALQSO fraction. This sample actually avoids some of the selection biases in the optical bands. The previous lens sample was selected serendipitously from many surveys, and all the gravitational lenses are identified spectroscopically. In addition, the lensing has boosted the S/N of the quasars so that they are less biased against discounting the BALQSOs.
Selection biases against BALQSOs has been proposed by previous studies, where a continuum anisotropy causes the selection biases (e.g., Goodrich 1997; Krolik & Voit 1998). In our simulations we show that the selection biases can be explained with obscuration from dust extinction and absorption troughs in BALQSOs. Essentially, an anisotropy is also produced after the optical obscuration which, combined with the steep quasar luminosity function, will produce lower BALQSO fractions in those bands more sensitive to obscuration. An intrinsic continuum anisotropy is also possible; however, it needs to be fine tuned as a function of wavelength that behaves similarly to the effect of dust extinction, especially in the longer wavelength bands. Different continuum emission between BALQSO and non-BALQSOs is also expected if the BALQSOs are either at special evolution stages of quasar evolution, or the near infrared emission of BALQSOs are enhanced by the reprocessed emission from the absorption lines. This fact is also connected to the idea that BALQSOs are in the transition stage between Infrared Luminous Galaxies and quasar phases (Lípari et al. 2005). To test whether the continuum emission in the BALQSOs and non-BALQSOs are similar, we need to compare the absorption corrected spectra for BALQSOs with non-BALQSOs, which involves significant complexity in the analysis of the optical spectra. As the observed near infrared band is little affected by the BAL features, it would be ideal to make the comparison there. However, a near infrared spectroscopic survey is needed to better measure the power-law slope and K-correction of the quasars before we draw a solid conclusion. Our sample size is limited by the 2MASS survey limits. Future infrared surveys (e.g., UKIDSS with survey limits of mag) will significantly increase the sample size, and enable us to extend this study of BALQSO fractions to less luminous quasars.
Our analysis indicates that the near infrared BALQSO fraction more accurately reflects the true fraction of BALQSOs. This is important when using the fraction of BALQSOs to constrain quasar geometric and evolutionary models. In this paper, we found a BALQSO fraction of % in the 2MASS bands under the T06 criterion. This indicates a correction of factor is needed for the optical fractions, consistent with the modeling of Hewett & Foltz (2003).
We note that the fraction of BALQSOs is also dependent on the spectral definition of BALQSOs. T06 also analyzed the fraction of BALQSOs under the original definition of Weymann et al. (1991) and found a BALQSO fraction of 10%, different from the 26% under the T06 criterion. We analyzed the fraction of BALQSOs in 2MASS under the Weymann et al. (1991) definition and obtained fractions of % and % in the complete and 2MASS sample using the balnicity indices provided by T06. We obtained a correction factor of for the optical fraction under the Weymann et al. definition. This result is not surprising since the Weymann et al. definition for BALQSOs is more strict, and we expect more severe optical obscuration and a larger correction factor for the optical fraction. This fraction is also very similar to % obtained by modeling directly in the optical bands and using the Weymann et al. definition (Hewett & Foltz 2003).
Since the radio bands are also not affected by dust extinction and absorption troughs, we expect the radio fraction of BALQSOs should also have a large fraction of % under the T06 definition. However, the situation in this case is more complex. For example, the fractions of BALQSOs are found to be dependent on the radio flux (Hewett & Foltz 2003), while our BALQSO fractions in the near infrared bands are nearly constant, independent of the flux. The complexity may be due to different mechanisms responsible for the radio and UV/optical (observed optical/near infrared) emission of quasars; however, further investigation is needed.
Our near infrared BALQSO fractions are roughly constants across the large redshift range of , which suggests that the covering fraction of the BAL wind does not evolve significantly in the geometric models. The 40% BALQSO fraction implies a large wind half opening angle of , suggesting that the BAL wind is raised significantly above the accretion disk as compared to for a % fraction. This might impose significant challenges to theoretical models on wind dynamics (see Krolik & Voit 1998 for this and other implications). The results of the paper will also be useful in constraining evolutionary models for BALQSOs by combining the constraints from the number density, luminosity function, and duty cycle of quasars.
References
- Becker et al. (2000) Becker, R. H., White, R. L., Gregg, M. D., Brotherton, M. S., Laurent-Muehleisen, S. A., & Arav, N. 2000, ApJ, 538, 72
- Boroson & Meyers (1992) Boroson, T. A., & Meyers, K. A. 1992, ApJ, 397, 442
- Chartas (2000) Chartas, G. 2000, ApJ, 531, 81
- Chartas et al. (2001) Chartas, G., Dai, X., Gallagher, S. C., Garmire, G. P., Bautz, M. W., Schechter, P. L., & Morgan, N. D. 2001, ApJ, 558, 119
- Croom et al. (2004) Croom, S. M., Smith, R. J., Boyle, B. J., Shanks, T., Miller, L., Outram, P. J., & Loaring, N. S. 2004, MNRAS, 349, 1397
- Egami et al. (1996) Egami, E., Iwamuro, F., Maihara, T., Oya, S., & Cowie, L. L. 1996, AJ, 112, 73
- Gallagher et al. (1999) Gallagher, S. C., Brandt, W. N., Sambruna, R. M., Mathur, S., & Yamasaki, N. 1999, ApJ, 519, 549
- Gallagher et al. (2002) Gallagher, S. C., Brandt, W. N., Chartas, G., & Garmire, G. P. 2002, ApJ, 567, 37
- Gallagher et al. (2007) Gallagher, S. C., Hines, D. C., Blaylock, M., Priddey, R. S., Brandt, W. N., & Egami, E. E. 2007, ApJ, in press, arXiv:0705.0538
- Goodrich (1997) Goodrich, R. W. 1997, ApJ, 474, 606
- Granato et al. (2004) Granato, G. L., De Zotti, G., Silva, L., Bressan, A., & Danese, L. 2004, ApJ, 600, 580
- Green et al. (2001) Green, P. J., Aldcroft, T. L., Mathur, S., Wilkes, B. J., & Elvis, M. 2001, ApJ, 558, 109
- Grupe et al. (2003) Grupe, D., Mathur, S., & Elvis, M. 2003, AJ, 126, 1159
- Hall et al. (1997) Hall, P. B., Martini, P., Depoy, D. L., & Gatley, I. 1997, ApJ, 484, L17
- Hall et al. (2002) Hall, P. B., et al. 2002, ApJS, 141, 267
- Hazard et al. (1984) Hazard, C., Morton, D. C., Terlevich, R., & McMahon, R. 1984, ApJ, 282, 33
- Hewett & Foltz (2003) Hewett, P. C., & Foltz, C. B. 2003, AJ, 125, 1784
- Lipari (1994) Lipari, S. 1994, ApJ, 436, 102
- Lípari et al. (2005) Lípari, S., Terlevich, R., Zheng, W., Garcia-Lorenzo, B., Sanchez, S. F., & Bergmann, M. 2005, MNRAS, 360, 416
- Krolik & Voit (1998) Krolik, J. H., & Voit, G. M. 1998, ApJ, 497, L5
- Ogle et al. (1999) Ogle, P. M., Cohen, M. H., Miller, J. S., Tran, H. D., Goodrich, R. W., & Martel, A. R. 1999, ApJS, 125, 1
- Reichard et al. (2003) Reichard, T. A., et al. 2003, AJ, 126, 2594, R03
- Richards et al. (2005) Richards, G. T., et al. 2005, MNRAS, 360, 839
- Schmidt & Hines (1999) Schmidt, G. D., & Hines, D. C. 1999, ApJ, 512, 125
- Schneider et al. (2005) Schneider, D. P., et al. 2005, AJ, 130, 367
- Skrutskie et al. (2006) Skrutskie, M. F., et al. 2006, AJ, 131, 1163
- Sprayberry & Foltz (1992) Sprayberry, D., & Foltz, C. B. 1992, ApJ, 390, 39
- Surdej & Hutsemekers (1987) Surdej, J., & Hutsemekers, D. 1987, A&A, 177, 42
- Tolea et al. (2002) Tolea, A., Krolik, J. H., & Tsvetanov, Z. 2002, ApJ, 578, L31
- Trump et al. (2006) Trump, J. R., et al. 2006, ApJS, 165, 1, T06
- Vanden Berk et al. (2001) Vanden Berk, D. E., et al. , 2001, AJ, 122, 549
- Voit et al. (1993) Voit, G. M., Weymann, R. J., & Korista, K. T. 1993, ApJ, 413, 95
- Weymann et al. (1991) Weymann, R. J., Morris, S. L., Foltz, C. B., & Hewett, P. C. 1991, ApJ, 373, 23
- Zhou et al. (2006) Zhou, H., Wang, T., Wang, H., Wang, J., Yuan, W., & Lu, Y. 2006, ApJ, 639, 716
| SampleaaThe first two lines list the fractions of BALQSOs calculated from samples using the brightest N quasars in each bands. The numbers 245 and 884 are used to match the numbers of quasars in the complete sample and the 2MASS sample. The bottom two lines list the fractions of BALQSOs in calculated above absolute magnitudes for the complete (-27.66, -28.21, -28.37, -28.50, -28.66, -29.61, -30.16, and -30.85 mag) sample and the 2MASS sample (-26.91, -27.46, -27.62, -27.75, -27.91, -28.86, -29.41, and -30.10 mag) from the to bands, respectively. In the redshift range of , 2MASS detects quasars more luminous than and mag for the complete sample and 2MASS sample, respectively. To translate these limits to the other bands, we applied the non-BALQSO colors to obtain the magnitude limits in other bands. | ||||||||
|---|---|---|---|---|---|---|---|---|
| Brightest 245 | % | % | % | % | % | % | % | % |
| Brightest 884 | % | % | % | % | % | % | % | % |
| Luminous complete | % | % | % | % | % | % | % | % |
| Luminous 2MASSbbThese values are used in §5 and Figure 6. | % | % | % | % | % | % | % | % |
Note. — The increasing BALQSO fractions from to band showing significant wavelength dependence.
| From | |||||||
|---|---|---|---|---|---|---|---|
| Dust Extinction | 0.28 | 0.20 | 0.16 | 0.13 | 0.10 | 0.07 | 0.05 |
| Absorption Troughs | 0.08 | 0.01 | 0.02 | ||||
| Total | 0.36 | 0.21 | 0.18 | 0.13 | 0.10 | 0.07 | 0.05 |
Note. — The dust extinction magnitudes are calculated based on the continuum spectral differences of with (Reichard et al. 2003). The from absorption troughs are calculated from the difference between the composite spectra of BALQSOs and non-BALQSOs (Reichard et al. 2003) excluding dust extinction assuming . Specifically, we first de-redden the Reichard et al. BALQSO composite spectrum by E(B-V)=0.023 and then convolve the de-reddened spectrum with the SDSS filter functions to determine the for the absorption troughs.