Failure mechanisms and surface roughness statistics of fractured Fontainebleau sandstone
Abstract
In an effort to investigate the link between failure mechanisms and the geometry of fractures of compacted grains materials, a detailed statistical analysis of the surfaces of fractured Fontainebleau sandstones has been achieved. The roughness of samples of different widths is shown to be self affine with an exponent over a range of length scales ranging from the grain size up to an upper cut-off length . This low value is in agreement with measurements on other sandstones and on sintered materials. The probability distributions of the variations of height over different distances can be collapsed onto a single Gaussian distribution with a suitable normalisation and do not display multifractal features. The roughness amplitude, as characterized by the heightheight correlation over fixed distances , does not depend on the sample width, implying that no anomalous scaling of the type reported for other materials is present. It is suggested, in agreement with recent theoretical work, to explain these results by the occurence of brittle fracture (instead of damage failure in materials displaying a higher value of ).
pacs:
62.20.Mk,46.50.+a,68.35.CtI Introduction
The characterization of the geometry of fracture surfaces is of considerable interest for a broad range of practical applications ranging from the hydrology of fractured reservoirs Adler and Thovert (1999); Zimmerman and Main (2004) to the derivation of friction laws Chakrabarti (2005). Their statistical analysis is also relevant to the understanding of the physics of fracture: The roughness may indeed be expected to reveal failure mechanisms occurring at the microstructure scale Bouchaud (1997). It is now well established that fracture surfaces satisfy a scaling invariance known as self-affinity Bouchaud et al. (1990); Måløy et al. (1992); Poon et al. (1992); Schmittbuhl et al. (1993, 1995); Ponson et al. (2006a). A self-affine profile is one that is statistically invariant under the scaling relation: and where the axis is in the mean fracture plane and normal to the direction of crack propagation, is the surface height profile and is the self affine exponent. The scaling invariance implies that the probability to observe a variation of height over an horizontal distance follow the scaling law:
| (1) |
The prefactor results from the normalization of . As a direct consequence, the heightheight correlation function satisfies:
| (2) |
In many materials including rocks like granite and basalt Poon et al. (1992); Schmittbuhl et al. (1993, 1995), the roughness exponent was found to be close to , suggesting at first that it was a universal value Bouchaud et al. (1990); Måløy et al. (1992). However, different exponents were reported for Berea sandstone Boffa et al. (1998) and then on synthetic sandstone made of sintered glass beads Ponson et al. (2006b). In this latter case, the exponent is equal to independent of the porosity in the range investigated (). This difference raises important fundamental questions regarding the physics of fracture, namely whether is determined by the structure of the material or by the failure mechanism.
In support of the second possibility, a recent work Bonamy et al. (2006) suggests that the value of depends on the existence of a process zone where damage processes take place. On the one hand, at length scales smaller than the size of the process zone, fracture surfaces would develop from the growth and coalescence of microdefaults (cracks or voids): This damage failure (also called quasi-brittle failure) would lead to an exponent . On the other hand, at length scales larger than the process zone, the fracture surfaces would result from the continuous propagation of a crack. For this brittle failure, the exponent would be , reflecting, at the continuum scale, the toughness distribution of the microstructure scale. Two-dimensional numerical simulations realized under these two types of assumptions confirm these results by predicting lower values for brittle fractures Katzav et al. (2007) than when damage is introduced Bouchbinder et al. (2004).
While most studies dedicated to the roughness of cracks dealt with surfaces with Bouchaud et al. (1990); Måløy et al. (1992); Poon et al. (1992); Schmittbuhl et al. (1993, 1995); Ponson et al. (2006a); Lopez and Schmittbuhl (1998); Morel et al. (1998); Mourot et al. (2005); Santucci et al. (2006), the present work investigates these problems through an extensive analysis of the statistical properties of the roughness of fractured Fontainebleau sandstone for which .
In addition to the self-affine exponent , another important statistical characteristic is the distribution of the surface height variations: On granite surfaces (), it was found to be Gaussian Santucci et al. (2006) and a single self-affine exponent was needed to describe the correlation of the surface heights along the crack front direction.
Another important point is the dependence of the roughness statistics on the size of the samples and on the distance to the initiation zone. In the transient propagation region of fractures initiated from a straight notch, the amplitude of the roughness is observed to depend at all length scales on the distance to the initiation Lopez and Schmittbuhl (1998); Morel et al. (1998); Mourot et al. (2005). This variation may be described by a so called anomalous scaling law involving a new exponent referred as the global roughness exponent. A consequence of anomalous scaling is expected in regions far from the initiation and where the roughness is fully developed Morel et al. (1998); Mourot et al. (2006): The roughness amplitude in a window of size normal to the crack propagation would then scale with the width of the fracture surface as:
| (3) |
In the present study, a statistical analysis of the same type is performed on fractured Fontainebleau sandstone samples of various widths (perpendicular to the direction of crack propagation). For each surface, the roughness exponent and the range of length scales over which a self-affine description is valid are inferred from the variations of the correlation function with . Their dependence on the width of the samples and on the location on the fracture surface is investigated in order to look for the anomalous scaling features observed on other materials. The probability distribution of the variations of height over given distances are also investigated, in order to evaluate the magnitude of multiscaling effects and their dependence on .
The differences between these results and the characteristics reported previously for other materials will be discussed and we shall seek to relate them to the failure mechanisms taking place at scales larger than the grain size in Fontainebleau sandstone.
II Sample characterization and experimental setup
The X-Ray analysis of the Fontainebleau sandstone samples used in
the present work indicated that they contain quartz.
The size of the grains range from to with a mean
value . SEM micrographs covering a total area
of
were used to measure the porosity.
The pictures are thresholded at a gray level adjusted so as to discriminate between grains and voids.
The porosity, defined as the ratio between
the void and total areas,
is found to be .
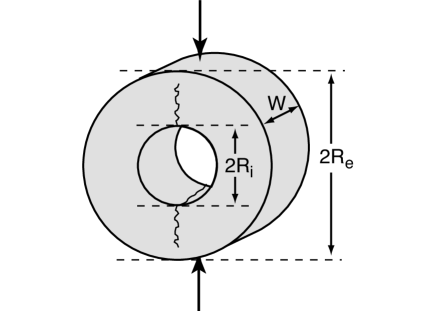
Slices of widths ranging from to were sawed off from Fontainebleau paving stones. Toroidal samples were obtained by using hole saws to core out the slices (see Fig. 1). This was achieved by first piercing a circular hole with a diameter saw and then a second hole of diameter using the same spinning axis. Four slices of widths , , and were machined and placed in a hydraulic press to perform modified Brazilian fracture tests Carneiro and Barcellos (1953). The latter is achieved by applying a uniaxial stress at two opposite points on the outside of the torus. The load is increased until two symmetrical cracks propagate from the central hole toward the outside where the compressive forces are applied.
After the failure, one of the fractured blocks is secured to a
computer controlled horizontal displacement table. The samples are
moved stepwise using steps of lengths (See Tab. 1
for a detailed list of the actual values.) At each
new position, a sensing needle is displaced vertically by a computer
controlled microstep motor with a resolution of . The
contact is detected by a vertical deviation of the needle. The
repeatability of the measurement, verified by scanning several times
the same profile, is . After the detection of the contact,
the sensor is raised by before the sample is moved
laterally again. The sequence is repeated times. Then, the
sample is displaced in the perpendicular direction along the -axis by a
step of length and the scanning is repeated again.
Finally, one obtains surface maps including points.
Figure 2 shows one of these maps that displays troughs
and bumps with, for the largest, a typical amplitude of the order of
one millimeter. In the following, we discuss a detailed
statistical analysis of the spatial correlations of the roughness.

III Experimental results
III.1 Characterization of the surface roughness
We first analyze profiles parallel to the -axis, i.e. normal to the direction of crack propagation, and located far enough from the initiation so that the roughness properties are statistically stationary. The scaling properties of these profiles are characterized by their 1D heightheight correlation function defined by Eq. (2).
Figure 3 represents in a log-log scale the variations of
as a function of the distance for one of the
samples. Two distinct behaviors are observed: For ,
varies as a power law of (straight line in a
log-log representation) while, for ,
remains roughly constant (”plateau domain”). The crossover length
scale is, here, defined as the abscissa of the intersection
between the power law fit (solid line in Fig. 3) and
the plateau variation (dotted horizontal line). The local slope of
the correlation function (see inset of Fig. 3) is constant except for values smaller than : This
corresponds roughly to the grain size which represents therefore a lower
boundary of the self affine domain. These results indicate that, at
intermediate length scales, the profiles are
self-affine and characterized here by a roughness exponent .
The robustness of this self-affine description was verified by using
other statistical methods such as the Fourier analysis of the
profiles Feder (1988). The exponents obtained in this way are given
in Tab. 1 and are globally independent of the method:
Regarding the dependence on , a global increasing trend is
observed but the total variation is very weak, less than , which is of the same
order as the interval of confidence on the value of
one exponent estimated for a given width. The self-affine exponent
obtained after averaging over all data is .
Applying the same analysis to profiles parallel to the
direction, i.e. the direction of crack propagation, leads to a self-affine exponent
equal to . These observations are consistent with
measurements performed on other natural and
artificial sandstones Boffa et al. (1998); Ponson et al. (2006b); Bonamy et al. (2006).

For larger than , the variations of level off indicating that the surface is flat at large scales. In order to test the robustness of the value of with respect to possible bias introduced by the statistical analysis, the computation was repeated on data sets including only one out of two data points. The value of the cut-off length remained the same. Finally, the same procedure was applied in different regions of the surface. Each of the surfaces was divided into three regions of equal width . Two of these subsurfaces are thus on the sides of the sample while the third one covers the central region. In Fig. 3, correlation functions computed on the central () and on one of the lateral () subregions are overlaid. All curves fall on top of each other, showing that the crossover length is independent of the region of the fracture surface. Therefore, is a relevant length scale of the problem which reflects neither an influence of the sides of the sample nor of the sampling period of the surface maps.
Before studying the scaling behavior of with the sample width, we analyze now the distribution of the variations of height.
III.2 Statistical distribution of the fluctuations of height
For each sample, a scan including at least measurement points has been performed. Such a large data set allows one to compute with a good accuracy the probability distributions for values of ranging from the typical grain size up to several times the grain diameter. Fig. 4 displays such probability distributions corresponding to several values ranging from to , i.e. larger than the mean grain diameter .
For self-affine profiles, one expects to satisfy Eq. (1), valid for any scaling parameter . Using the particular value , this equation becomes :
| (4) |
Therefore, using the normalized variable , all the distributions
should collapse onto a same master curve , at least for
values pertaining to the self-affine regime. Such a
collapse is indeed observed in Figure 4: The same data
as in the insert have been plotted in these normalized coordinates
using the roughness exponent measured from the scaling
of the correlation function (see Fig. 3).

One of the key consequence of this precise collapse is that all moments of order of the distributions must scale as . This is a clear evidence of the lack of multiscaling of the surface investigated. In other words, the single exponent is enough to describe the full statistics of the variations of height on the fracture surface along the -axis, at least in the range of length scales .
Let us now focus on the master curve which has the characteristic bell-like shape of Gaussian distributions. This is more precisely demonstrated in the semi-logarithmic plot of Fig. 5 in which a Gaussian curve (continous line) with a second moment equal to one is observed to coincide with the experimental data sets corresponding to , i.e. . The statistical properties of the surface are therefore fully described by this Gaussian distribution and by the single roughness exponent .

We have also represented the -distributions corresponding to length scales smaller than the mean grain diameter , namely and . They clearly do not collapse with the other curves although their second moment was shown to scale roughly as in this range of scales (see Fig. 3). It means that, in the domain of small distances (), the distributions are not Gaussian and their moments cannot be rescaled with a single exponent. In this range of values, it would be possible to rescale all the moments by using several exponents (not shown here): The relevance of such a multiscaling description at length scales for which the geometry of a single grain has a predominant effect is however questionable.
These results bring new insight to a recently debated question concerning crack lines resulting from the rupture of paper sheets that were found to exhibit multiscaling Bouchbinder et al. (2006), at least at small scales, i.e. at length scales comparable with the length of the fibers of the paper. Other observations, performed on the same material, but over a wider range of length scales, reported that, at larger scales, there was a crossover from this multiscaling behavior towards a self-affine one Santucci et al. (2006). These results may have similarities with our experiments, even though they correspond to the 3D rupture of a very different material: In our case, the crossover length correspond to the mean grain diameter of the sandstone specimen.
III.3 Dependence of the statistical properties on the sample width
In addition to the lower limit of the order of the grain diameter discussed above, the self-affine domain has also
an upper limit (see Figure 3) which generally depends on the sample size. For granite, the
experimental upper limit is of the order of one fourth of the specimen
size Méheust and Schmittbuhl (2000); Auradou et al. (2005).
For mortar, the geometry can be considered as self-affine only up to length scales of the order of
of the specimen width Mourot et al. (2005). A systematic study of wood samples with various values
of leads to Morel et al. (1998).

Figure 6 displays the variations of the correlation function
as a function of for samples of different widths .
All data sets display a self-affine domain followed by a plateau region corresponding
to a value of increasing with ; the upper limit of the self-affine
domain also clearly increases with the system size.
The variation of with is plotted in Figure 7 and is well fitted by a
straight line of slope going through the origin.

A value of the upper limit of the self-affine domain for profiles
parallel to the direction of crack propagation is also plotted
in Figure 7 (). This length is, in this case,
the average of values of determined for four samples of different widths
and the error bar reflects the variability of the
values. In order to plot this result
in Figure 7, these profiles have been assumed to
correspond to a value of equal to (i.e. the length of the
samples along the direction). The corresponding data point
is consistent with the linear fit
corresponding in Figure 7 to profiles parallel to the -axis.
The scaling relation between and the system width established above
seems apparently also applicable in the direction.
Let us now compare the surface roughness in the self-affine domain
at length scales between and with the anomalous scaling
characteristics recently observed Lopez and Schmittbuhl (1998); Morel et al. (1998); Mourot et al. (2005).
Anomalous growth implies that, after a transient regime, the
roughness amplitude scales as
with the system width (see
Eq.(3)). All the profiles analyzed correspond to the
stationary propagation domain in order to make the comparisons
meaningful. The extent of the transient domain near the crack initiation has been found in various materials to be of the order of few
millimeters Ponson et al. (2006b); Mourot et al. (2005).
Here, a value close to was measured and all profiles considered in the present work are outside this region.

The heightheight correlation function is plotted in Fig. 8 as a function of the specimen width for two different window sizes . In contrast with the predictions of Eq. (3) for anomalous scaling, the roughness amplitude in the self-affine domain is independent of over a range of variations of almost to (the same conclusions may already be inferred from Fig. 6 but the sensitivity is better here due to the linear scale). These characteristics differ therefore completely from those expected for anomalous scaling.
IV Discussion and conclusions
Let us now discuss the origin of the statistical properties observed for the present Fontainebleau sandstone surfaces. In a recent study, Bonamy et al. Bonamy et al. (2006) analyzed the fracture surfaces morphology in glassy materials, i.e. homogeneous silica glass and sintered glass. They suggest that, on the one hand, higher exponents reflect damage failure processes occuring in a zone surrounding the crack tips and are observable at length scales smaller than the size of the process zone; on the other hand, low roughness exponents would result from brittle fracture and be observable either in experiments where no process zone develops or at length scales larger than the size of the process zone. In this perspective, and as is discussed in more detail below, the low value reported here for Fontainebleau sandstone samples is the signature of brittle fracture; moreover, since it is observed at length scales down to the grain size, no process zone is present in these experiments.
In spite of these important differences, surfaces obtained from brittle and quasi-brittle failures share common features. In both cases, a single exponent is enough to describe the scaling invariance of the roughness Santucci et al. (2006): this confirms the relevance of the self-affine description of fracture surfaces for both types of materials.
The lack of anomalous scaling in the present fracture surfaces compared to materials such as concrete, wood or granite displaying damage failure is an other indication that no damage process occurs in our experiments. In these latter studies, confinment effects limit the development of the process zone: Its extension and internal structure are then set by the system size when a stationary propagation regime is reached. As a result, from Eq. (3) Lopez and Schmittbuhl (1998), the roughness amplitude varies with as as is indeed observed experimentally Mourot et al. (2006). In contrast, in the absence of a process zone, is only set by the microstructural and mechanical properties of the material and does not depend on the system size (see for instance the model of Refs. Bonamy et al. (2006); Ponson (2006)) as observed experimentally here.
The same type of approach accounts for the domains of observation of the different self-affine geometries. For damage fractures, the upper bound of the self-affine domain where is set by the size of the process zone Bonamy et al. (2006); Ponson et al. (2006a) or by the sample size if it is smaller than the process zone. In the present case of a brittle fracture with no process zone, the lower boundary of the self-affine domain is set by the grain size. The upper cut-off length increases linearly with the sample size : in this case, no other characteristic length than seems to determine so that it might increase indefinitely with . These results suggest that the two different self affine geometries might coexist on a same fracture surface: the characteristic exponent would have a value for lengths scales up to the size of the process zone and a value at larger length scales up to the plateau domain where becomes constant.
A key issue is whether the development of a process zone is purely material dependent. Recent experiments Backers et al. (2003, 2005) suggest that fractured samples made of cemented grains, and therefore similar to Fontainebleau sandstone, do not always display brittle failure. The emission of acoustic waves was measured during the growth of a crack initiated from a chevron shaped notch under fatigue in a Permian sandstone sample. The localization of the acoustic events during failure allowed to demonstrate that a process zone was present and to determine its size and its spatio-temporal evolution Backers et al. (2005). Moreover, the morphology of the resulting fracture surfaces Backers et al. (2003) was found to be self-affine for length scales less than and characterized by an exponent , similar to the usual value for materials displaying damage fractures. This observation supports the assertion of Ref. Bonamy et al. (2006) and shows that the roughness exponent depends not only on the material, but also on the experimental conditions (geometry of initiation notch, loading mode…)
To conclude, the present experimental results and their comparison to previous works indicate that the value of the self-affine exponent is a clear signature of the failure mode : damage fracture involving a process zone if or brittle fracture if . Another characteristic signature of damage fracture is anomalous scaling marked by a variation of the roughness amplitude with the sample size (if the latter is smaller than the process zone). The range of length scales over which the fracture geometry is self-affine with a given exponent may represent an important additional information. For , this range should extend from the size of the grains to that of the process zone (which may be limited by the sample size); for , it may extend from the size of the grains (if there is no process zone) or that of the process zone up to a length scaling as the size of the specimen.
An important test of these hypothesis will then be to force the development of a process zone in materials of the type used here by modifying the loading or the geometry of the experiments. For instance, one may use an initial chevron notch geometry as in refs. Backers et al. (2003, 2005), where damage processes occur (so that ) although the material is similar to the Fontainbleau sandstone used here. If a transition from brittle to damage fracture is induced in this way, this would result in a variation of the self affine exponent or in the coexistence of two self-affine domains with below the size of the process zone and above it.
Acknowledgements.
We are indebted to G. Chauvin, R. Pidoux (FAST) and J.P. Villote, V. Godard (IDES) for their assistance in the realization of the experimental set-up. We are grateful to E. Bouchaud, D. Bonamy, J.P. Bouchaud, A. Hansen and K.J. Måløy for their enlightening comments. This work is supported by the CNRS and ANDRA through the GdR FORPRO - the EHDRA (European Hot Dry Rock Association) - the PNRH programs and the Paris XI university through a PPF. L. P. is partially supported by the French Ministry of Foreign Affairs (Lavoisier Program).References
- Adler and Thovert (1999) P. M. Adler and J.-F. Thovert, Fractures and Fracture Networks (kluwer Academic Publishers, 1999).
- Zimmerman and Main (2004) R. Zimmerman and I. Main, in Mechanics of Fluids-Saturated Rocks, edited by Y. Guéguen and M. Boutéca (Elsevier Academic Press, 2004).
- Chakrabarti (2005) B. K. Chakrabarti, Modelling Critical and Catastrophic Phenomena in Geoscience: A Statistical Physics Approach (Springer, 2005).
- Bouchaud (1997) E. Bouchaud, Surf. Rev. Lett. 10, 797–814 (2003).
- Bouchaud et al. (1990) E. Bouchaud, G. Lapasset, and J. Planès, Europhys. Lett. 13, 73 (1990).
- Måløy et al. (1992) K. J. Måløy, A. Hansen, E. L. Hinrichsen, and S. Roux, Phys. Rev. Lett. 68, 213 (1992).
- Poon et al. (1992) C.Y. Poon, R.S. Sayles, and T.A. Jones, J. Phys. D: Appl. Phys. 25, 1269–1275 (1992).
- Schmittbuhl et al. (1993) J. Schmittbuhl, S. Gentier, and S. Roux, Geophys. Res. Lett. 20, 639 (1993).
- Schmittbuhl et al. (1995) J. Schmittbuhl, F. Schmitt, and C. Scholz, J. Geophys. Res. 100, 5953 (1995).
- Ponson et al. (2006a) L. Ponson, D. Bonamy, and E. Bouchaud, Phys. Rev. Lett. 96, 035506 (2006a).
- Boffa et al. (1998) J. M. Boffa, C. Allain, and J. P. Hulin, Eur. Phys. J. Appl. Phys. 2, 281 (1998).
- Ponson et al. (2006b) L. Ponson, H. Auradou, P. Vié, and J. P. Hulin, Phys. Rev. Lett. 97, 125501 (2006b).
- Bonamy et al. (2006) D. Bonamy, L. Ponson, S. Prades, E. Bouchaud, and C. Guillot, Phys. Rev. Lett. 97, 135504 (2006).
- Katzav et al. (2007) E. Katzav, M. Adda-Bedia, and B. Derrida, to appear in Europhysics Lett., arXiv:cond-mat/0610185v1 (2007).
- Bouchbinder et al. (2004) E. Bouchbinder, J. Mathiesen, and I. Procaccia, Phys. Rev. Lett. 92, 245505 (2004).
- Lopez and Schmittbuhl (1998) J. M. Lopez and J. Schmittbuhl, Phys. Rev. E 57, 6405 (1998).
- Morel et al. (1998) S. Morel, J. Schmittbuhl, J. M. Lopez, and G. Valentin, Phys. Rev. E 58, 6999 (1998).
- Mourot et al. (2005) G. Mourot, S. Morel, E. Bouchaud, and G. Valentin, Phys. Rev. E 71, 016136 (2005).
- Santucci et al. (2006) S. Santucci, K. J. Måløy, A. Delaplace, J. Mathiesen, A. Hansen, J. Bakke, J. Schmittbuhl, L. Vanel, and P. Ray, Phys. Rev. E 75, 016104 (2007).
- Mourot et al. (2006) G. Mourot, S. Morel, E. Bouchaud, and G. Valentin, Int. J. Frac. 140, 39–54 (2006).
- Carneiro and Barcellos (1953) F. L. L. B. Carneiro and A. Barcellos, Bulletin RILEM 1, 97 (1953).
- Feder (1988) J. Feder, Fractals (Plenum, 1988).
- Bouchbinder et al. (2006) E. Bouchbinder, I. Procaccia, S. Santucci, and L. Vanel, Phys. Rev. Lett. 96, 055509 (2006).
- Méheust and Schmittbuhl (2000) Y. Méheust and J. Schmittbuhl, Geophys. Res. Lett. 27, 2989 (2000).
- Auradou et al. (2005) H. Auradou, G. Drazer, J. P. Hulin, and J. Koplik, Water Resour. Res. 41, 3938 (2005).
- Ponson (2006) L. Ponson, Ph.D. thesis, Ecole Polytechnique (2006).
- Backers et al. (2005) T. Backers, S. Stanchits, and G. Dresen, Int. J. Rock Mech. Min. Sc. 42, 1094 (2005).
- Backers et al. (2003) T. Backers, N. Fardin, G. Dresen, and O. Stephansson, Int. J. Rock Mech. Min. Sc. 40, 425 (2003).