Background study for the pn-CCD detector of CERN Axion Solar Telescope
Abstract
The CERN Axion Solar Telescope (CAST) experiment searches for axions from the Sun converted into photons with energies up to around 10 keV via the inverse Primakoff effect in the high magnetic field of a superconducting Large Hadron Collider (LHC) prototype magnet. A backside illuminated pn-CCD detector in conjunction with an X-ray mirror optics is one of the three detectors used in CAST to register the expected photon signal. Since this signal is very rare and different background components (environmental gamma radiation, cosmic rays, intrinsic radioactive impurities in the set-up, …) entangle it, a detailed study of the detector background has been undertaken with the aim to understand and further reduce the background level of the detector. The analysis is based on measured data taken during the Phase I of CAST and on Monte Carlo simulations of different background components. This study will show that the observed background level (at a rate of between 1 and 7 keV) seems to be dominated by the external gamma background due to usual activities at the experimental site, while radioactive impurities in the detector itself and cosmic neutrons could make just smaller contribution.
keywords:
solar axion, pn-CCD detector, Monte Carlo simulation, radioactive backgroundPACS:
14.80.Mz; 85.60.Gz; 24.10.Lx1 Introduction
Axions are a direct consequence of the Peccei-Quinn mechanism [1] proposed to solve the so-called strong CP problem (CP violation in strong interactions does not seem to exist in nature, although the QCD Lagrangian contains CP-violating terms). These particles could couple to two photons, which allows the production of axions inside the hot plasma of stars via the Primakoff effect. The expected flux of axions from the Sun has a mean energy of 4.2 keV and virtually vanishes above 10 keV. In the presence of a transverse magnetic field, solar axions could be converted back to observable photons via the inverse Primakoff effect, allowing axion detection on Earth [2].
The CERN Axion Solar Telescope (CAST) is intended to search for solar axions based on this principle [3, 4]. It uses a decommissioned long LHC superconducting magnet providing a magnetic field, where the probability of axion-to-photon conversion is proportional to the length and magnetic field strength squared. Each bore of the twin aperture magnet has a cross-sectional area of . The magnet is installed on a platform that permits horizontal movement from azimuthal angle to and a vertical movement of . As a consequence, we can follow the Sun three hours per day, 1.5 hours each during sunset and during sunrise. The rest of the day is dedicated to background measurements. Three X-ray detectors are installed at each end of the magnet to search for excess X-rays coming from axion conversions inside the magnet during alignment with the Sun. The detectors are a Time Projection Chamber (TPC) [5], a Micromesh Gaseous Structure (MICROMEGAS) [6], and a Charge Coupled Device (CCD) in combination with a X-ray mirror telescope [7]. The CCD and MICROMEGAS detectors observe sunrise axions, while the TPC detector, covering two magnet bores, looks for sunset axions. During 2003 and 2004 the experiment operated with vacuum inside the magnet pipes (CAST Phase I). Due to coherence effects this setup allows us to explore an axion mass range up to . No signal above background was observed in 2003, implying an upper limit to the axion-photon coupling of g1.16 GeV-1 [8]. In order to extend the CAST sensitivity to higher axion masses, the CAST experimental setup has been transformed to be able to fill the axion conversion volume with a buffer gas [4], probing the axion mass range up to (CAST Phase II). CAST started taking data in this configuration in November 2005.
The CAST experiment is located at sea level at LHC point 8 of CERN and the investigated axion signal is expected to be very rare. Therefore, different background components will be merged with the hypothetical signal in the detector data (environmental gamma radiation, cosmic rays, intrinsic radioactive impurities in the detector set-up, …). The goal of this work has been to study the background of the pn-CCD detector of CAST with the aim to understand its origin and to further reduce the background level to increase the detector sensitivity. Data acquired during the 2003 and 2004 periods have been analyzed and a series of Monte Carlo simulations have been performed using mainly the GEANT4 package [9] to achieve this goal. In particular, the response of this detector to photons and neutrons has been studied and a quantitative estimate of the contribution of different sources of background (like external gamma and intrinsic radio-impurities in the detector materials) to the overall background of the CCD detector has been attempted.
The structure of this paper is the following: details of the CCD detection system of CAST and its performance are presented in Sec. 2 and the main sources of background expected in CAST are described in Sec. 3, followed by a summary of the CCD background properties in Sec. 4. A description of the simulations and results is shown in Sec. 5.
2 The CCD detector and the X-ray telescope
The X-ray telescope of CAST is the most sensitive of the three different detector systems currently in operation, [4]. It consists of a Wolter I type X-ray mirror optics [10, 11, 12] focusing a potential axion signal on a small area on a CCD detector which is located in the focal plane of the optics. The CCD is a fully depleted back side illuminated pn-CCD with a depletion depth of and a pixel size of , optimized for the – energy range and currently in use on board of ESA’s XMM-Newton X-ray observatory [13]. The very thin SiO2 radiation window of this detector with a thickness of only , results in a quantum efficiency of between and . Such a device is operated for the first time in a low background experiment. For an in-depth description of the design of the X-ray telescope and its performance we refer to [7]. The long exposure time in CAST ( of operation time) provides a unique opportunity to study the long term background, performance, and different shielding concepts for such a detector in detail.
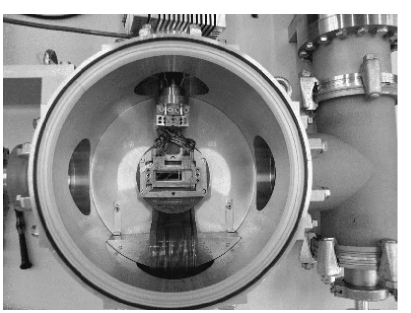
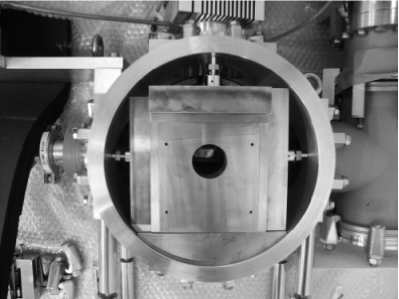
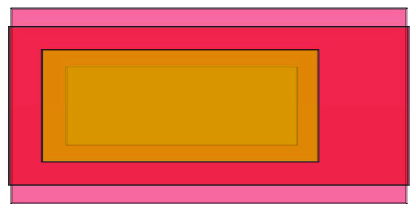
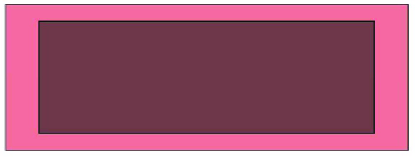
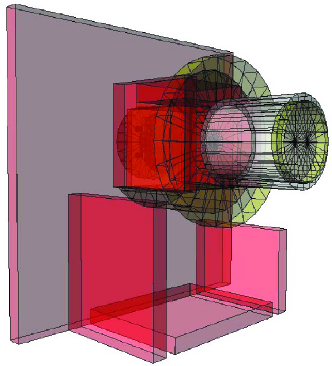
The combination of a detector with high quantum efficiency and a focusing device already improves the signal to noise ratio of the experiment by a factor of compared to a non-focusing system. Further enhancement of the sensitivity could be achieved by adding a passive shield consisting of a combination of internal (inside the vacuum vessel) and external lead-copper components. As raw material for the shield components we have chosen low activity oxygen free copper and low activity lead, almost free of 210Pb. In Fig. 1 the CCD detector is shown as it is integrated in its vacuum aluminum vessel with (right) and without (left) internal shielding components.
3 Background sources
The CAST experiment is located at one of the buildings of the point 8 experimental area at CERN. Therefore, any component of the environmental background at sea level can in principle affect the measured background of the detectors of CAST.
The most important contribution is expected to be caused by external gamma rays, produced mainly by primordial radio-nuclides like 40K and the radioactive natural chains from 238U, 235U and 232Th in laboratory soil, building materials and experimental set-up as well as by 222Rn in air. Gamma rays of cosmic origin make a negligible contribution. Activity levels of the walls of the experimental hall where CAST operates were measured using a germanium gamma spectrometer system [14] and radon levels have been also monitored there during long periods. Results from these measurements will be taken into account later on to estimate the contribution of gamma rays to the total measured CCD background counting rate.
Intrinsic radioactive impurities (either primordial or cosmogenically induced) in the detector components and materials can also make a relevant contribution in experiments looking for rare event signals because of their alpha, beta and gamma emissions. Since the CCD detector has an internal shielding made of lead-copper within the vacuum chamber where it operates, impurities from the external components can in principle be disregarded since they should be greatly suppressed. Therefore, only impurities in the materials composing the detector itself may be relevant and have been taken into account in this study. Activities from the CCD components were determined at the Canfranc Underground Laboratory using an ultra-low background germanium spectrometer and will be considered in evaluating their effect on the CCD measurements.
Cosmic rays on the Earth’s surface are dominated by muons and neutrons. While muon interactions (as those of other charged particles) can be rejected with efficiency thanks to their long ionizing tracks and the deposited energy, signals from neutrons can contribute to the detector background. At sea level, most of the neutrons come from cosmic rays. The neutrons induced by cosmic muons or generated by fission or (alfa,n) reactions [15] are in principle marginal. However, since production of neutrons by muons is strongly enhanced in high Z materials, muon-induced neutrons in the lead shielding have also been analyzed.
In order to maximize the sensitivity of the CCD detector and to minimize the contribution of all background components, passive shields were installed and off-line rejection methods were applied. We want to point out that the signal-to-background ratio of the X-ray telescope is significantly better compared to the other two detectors in use in CAST due to the X-ray focusing system described in the previous section. Thus a sophisticated shielding concept including, e.g., a neutron shield seemed not to be of importance.

4 Measured detector background
During the last three years of detector operation in CAST, we have acquired more than of background data with the X-ray telescope which have been partially analyzed. The 2003 background energy spectrum of the CCD detector, shown above in Figure 2, exhibits a counting rate of . By adding internal and external shielding this level was reduced to a raw counting rate of .The spectrum shows several characteristic emission lines of the materials close to the CCD chip, e.g., the copper, gold, and lead lines, on top of an almost flat continuum spectrum (Compton scattered photons and secondary electrons [7]). In order to achieve a maximum sensitivity, the CCD detector is optimized for the energy range from to which is the range of interest for the axion search. The major goal of this work is to explain the observed background in terms of different contributions from environmental background, neutron or muon induced background, and the contribution of natural radio-activity of the detector components themselves.
Electronic noise of the detector and the so-called “partial” events have to be considered as intrinsic sources of background [16]. Since the electronic noise level of such CCDs is far below , it is even for long exposure times not important for our energy region of interest with a minimum energy of . Calibrating spectrum tell us that partial events contribute to it as a flat continuum shown in Fig. 5. These events arise from photons absorbed in the detector near the Si-Si02 interface of the radiation entrance window (see reference [16]). For a mono-energetic line such events contribute to the observed spectrum with a constant fraction which is generally expressed in terms of a peak-to-valley ratio (maximum of the photo-peak relative to the level of the flat-shelf). For the CAST pn-CCD detector this ratio is of the order of . If we consider the Cu-K line of the background spectrum in Fig. 2 we would expect a contribution of at most to the continuum spectrum between – due to this effect.
5 Background simulations
In order to estimate the contribution of external background and natural radioactivity to the overall background, a simulation tool for the CCD detector has been developed using the GEANT4 package. As a first step we cross-checked the reliability of the code by comparing calibration data like, e.g., measured quantum efficiency and calibration spectra with results we obtained from our simulations. The results will be presented in the following sections. Simulations to understand the effect of the external environmental gamma background and its attenuation in different shielding configurations are presented and quantitative results of the estimate of the contribution of this background to the CCD counting rates are shown. Results regarding neutrons, either from cosmic rays or muon-induced in lead, are also collected. Finally, an estimate of the contribution to the counting rate of the CCD detector of the radioactive impurities of the detector materials is made.
5.1 The Code
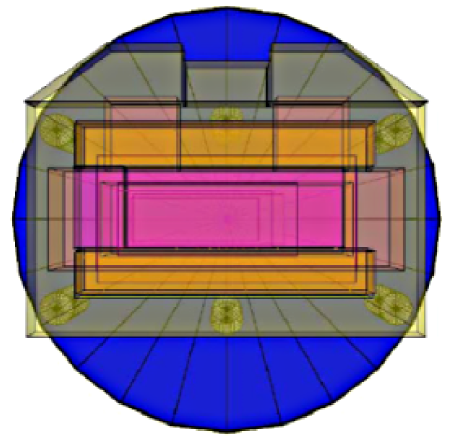
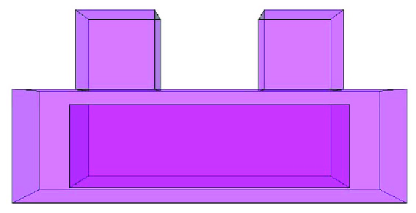
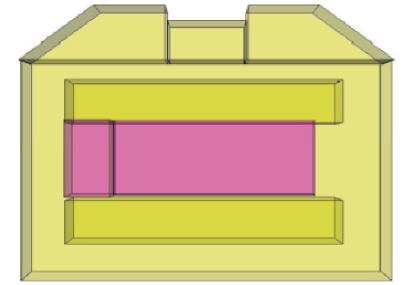
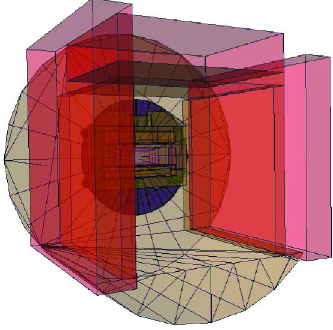
In the first simulations for neutrons and external gamma backgrounds a simplified description of the detector was implemented just considering the Si chip, the copper cooling mask and the printed circuit board. A much more detailed geometry for the detector was defined to carry out simulations of the radioactive impurities in the detector components; shapes and sizes of Si chip (including active area), ceramics, zero-force sockets, front and rear cooling mask (including gold lining), and printed circuit board have been reproduced as accurately as possible, keeping all the relations between the sizes. Figure 3 shows views of the simulated detector components. For both, the simplified and detailed implementations of the detector, it is placed inside the aluminum housing. Copper-lead shielding as well as the tube connecting to the telescope have been considered. Figure 4 shows the complete simulated set-up.
Usual electromagnetic processes for photons and charged particles have been taken into account using models specially developed for low energy (valid above 250 eV), which is important to reproduce fluorescence and emission of Auger electrons. Elastic and inelastic scattering, capture and fission are considered for neutrons. Radioactive decays are simulated also by GEANT4. Different simulation cuts111Particles having an energy (or a path) lower than the fixed cut are no longer simulated and therefore they are directly absorbed. have been defined for different kind of particles and regions, to save computing time while having accurate results. For each simulation, the spectrum of the energy absorbed in the CCD detector (considering the real integration time of 72 ms) is recorded.
5.2 Verification Against Calibration Measurements
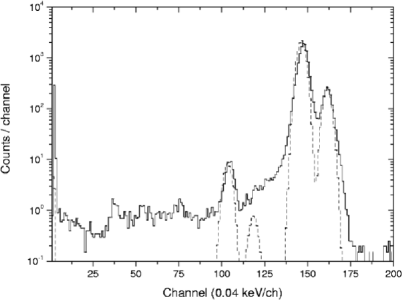
An energy calibration with a 55Fe source was first simulated and compared to the corresponding experimental spectrum. Figure 5 shows this comparison. The area of the peak at 4.2 keV due to the escape of Si X-rays produced following a photoelectric interaction of 5.9 keV photons is quite well reproduced (differences are of 1.5%). The escape peak corresponding to 6.5 keV photons is probably embedded in the background and the other peaks. The continuum in the real calibration is much higher than in the simulation. This discrepancy is related to the partial charge collection of some events, which affects the response of the CCD detector to low energy photons, as previously discussed in Sec. 4 (details about this can be found in Ref. [16]). This effect accounts quantitatively for the observed ratio between the continuum level and the area of the biggest peak in calibration measurements, but its inclusion in the simulation was disregarded since its influence on background measurements can be neglected. Other effects which could produce events in the continuum during calibrations (environmental background, Compton continuum associated to peaks, energy losses of photons within the source collimator or internal bremsstrahlung from the 55Fe source) have been also studied, but their contribution would be much smaller. In the measured spectrum a line from Al-K X-rays at 1.5 keV is visible, due to the capsule where the calibration source is placed. That capsule with aluminum filter inside was not considered in the simulation.
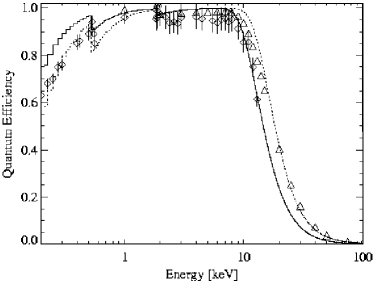
In addition to 55Fe measurements, measurements to determine detection efficiency as a function of energy (see Ref. [13]) were also simulated and results are presented in Fig. 6. Independent simulations have been carried out with slightly different geometry details. Discrepancies between real data and simulations are of the order of 4% below 10 keV. Although no comparison with real data is possible, high energy photons were also simulated obtaining for instance an efficiency as low as 0.4% for 100 keV photons.
5.3 External Gamma Background
In order to evaluate the contribution of the environmental gamma background to the CCD counting rate and the effect of the different shielding conditions, first the response of the detector has been studied by means of photon simulation.
5.3.1 Response
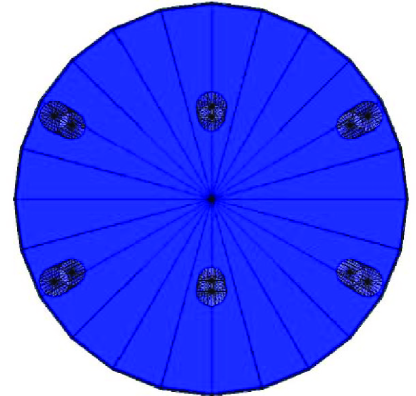
The response of the CCD detector has been studied by simulating photons with discrete energies from 30 up to 2000 keV from the surface of a sphere containing all the components included in the simulation. Four different geometries have been considered corresponding to the successive shieldings added to the CCD set-up: no shield, internal copper shield, internal copper shield and external lead shields and finally internal lead and copper shields and external lead shield. Figure 7 presents the ratio between the counts in the region up to 7 keV (to exclude X-rays from copper) and the total simulated events for each one of the considered initial energies of the incident photons. Results for each one of the four different shielding conditions are plotted.
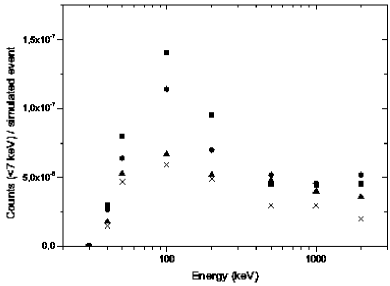
Gamma rays with energies around 100 keV contribute most to the CCD background. However, the effect of this external gamma background above 50 keV, according to Fig. 7, does not seem to be very dependent on energy. This fact may be due to the balance of two trends: low energy photons are less penetrating but their contribution is higher while high energy photons can pass more easily through the housing and the shielding but their contribution is lower.
The average reduction achieved in the counting rate below 7 keV due to environmental photons when using the complete shielding in the simulations seems to be slightly underestimated compared to the reduction actually observed in the CAST CCD detector (around a factor 3). Simplifications in the implementation of the components of the set-up, uncertainties in the response of the detector to high energy photons and/or non-isotropic background sources as considered in the simulation could be responsible for this discrepancy.
5.3.2 Contribution to CCD counting rate
Using this simulated response to external gamma including the effect of the complete shielding (see Fig. 7), an estimate of the contribution to the counting rate of the CCD detector from the external gamma background has been attempted. Results of the radon level measurements made by the CAST Collaboration at the experimental site and the activity of the walls of the experimental hall measured using a Ge spectrometer [14] have been used as input in this estimate.
-
•
Radon contribution: a mean radon concentration of 10 Bq m-3 has been assumed, according to available measurements. The rate of photons produced by 222Rn descendants from the air in successive spherical layers of radius R has been evaluated up to R=10 m. From Fig. 7, the number of counts up to 7 keV produced by a photon of fixed energy coming from a spherical surface is known; this information has been used to derive the contribution to counting rates of radon emissions of different energies from each of the spherical layers described, just properly rescaling the sphere used in the simulations to the corresponding air spheres. Total contribution from radon up to 7 keV turns out to be , almost negligible compared to the measured background rate in the CCD detector.
-
•
Walls activity contribution: specific activities for the North, South and East walls of the SR8 hall at CERN where the CAST experiment is running are known for 40K and for 232Th, 235U and 238U chains (in some cases, since equilibrium is broken for 238U chain two values are available up to and from 226Ra) [14]. The lower part of the East and South walls (around 1/4 of the total height) is made of composite wall while the upper part is made of concrete, having different specific activities according to measurements. The North wall contains partially metal. The rate of photons coming from the surface walls from each of the measured radioactive impurities has been evaluated using these specific activities, the wall dimensions and a mean density of 2.3 g cm-3. Uniform distribution of these impurities in the walls has been assumed and attenuation of photons through the walls has been taken into account. The contribution to the CCD counting rate of photons from each wall has been evaluated using again information from Fig. 7, rescaling the sphere used in the simulation to spheres having a radius given by the mean distance from the wall to the CCD detector.
Table 1 summarizes the counting rates obtained assuming the CCD detector at two different positions (height of 2.25 m, distance to South wall of 1.5 m and distance to East wall of 10 m for the first case and height of 3.70 m, distance to South wall of 0.5 m and distance to East wall of 9 m for the second one). Errors quoted in Table 1 (around 6%) come just from the error in the specific activities measurements. Considering the CCD detector at different positions along the tracking path when following the Sun does not change very significantly the contribution to the counting rates. A counting rate of around –10 could be attributed to the measured activities of the experimental site walls. This could therefore be the bulk of the measured background rate.
| Wall | Height | Height |
|---|---|---|
| North | ||
| East (lower part) | ||
| East (upper part) | ||
| South (lower part) | ||
| South (upper part) | ||
| Total |
5.4 Neutrons
In a similar way as for photons, an evaluation of the contribution of neutrons from different sources to the CCD counting rate has been attempted, after studying the response of the detector to neutrons using simulations.
5.4.1 Response
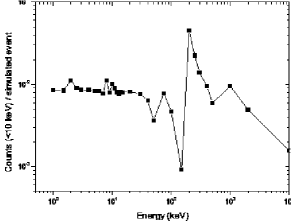
As for photons, the fraction of events detected in the CCD detector in the region of interest has been evaluated considering neutrons of different initial energies (from thermal up to 10 MeV). The different capacity of nuclei and electrons to ionize in the same medium compels us to take into account a relative efficiency factor222It is defined as the ratio between the amplitudes of pulses produced by nuclear and electronic recoils which deposit the same energy to compare energy spectra produced by neutrons and by photons. An analytical expression based on the Lindhard theory and taken from Ref. [17] has been used for including this factor, which turns out to be 0.28 for Si nuclear recoils of 10 keV and 0.36 for 100 keV. Nuclear recoils of up to 32 keV will be registered in the region up to 10 keV of visible energy.
The main contribution of neutrons to the counting rates in the energy region of interest comes from the elastic scattering off of silicon nuclei. Simple kinematics says that for neutrons up to 250 keV all the induced recoils deposit in the detector a (visible) energy below 10 keV; neutrons with higher energies can produce more energetic recoils.
Plots in Fig. 8 present the ratio between the events recorded in the region up to 10 keV of visible energy and the total simulated events, as a function of the energy of incident neutrons (up to 1 keV on top and above 1 keV at the bottom). The maxima appearing in Fig. 8 (bottom) are due to resonances in the cross-sections for neutron elastic scattering on silicon. Since the cosmic-ray neutron energy spectrum is peaked at thermal energies (0.025 eV) [18], the response of the CCD detector to thermal neutrons has been also evaluated. The contribution of thermal neutrons to the background in the energy region of interest (see Fig. 8, top) is at least one order of magnitude lower than the contribution of neutrons above 1 keV. Events induced by these very low energy neutrons are due not to nuclear recoils following elastic scattering but to radiative capture around and/or inside the detector; consequently, any gamma shield will help to further reduce the contribution of thermal neutrons. Below 1 keV, the contribution to background increases when energy decreases because of the higher relevance of neutron capture.

5.4.2 Contribution to CCD counting rate
A rough estimate of the contribution of the environmental neutron background to the CCD counting rate in the region of interest has been attempted considering the neutron fluxes reported in Table 2 (corresponding to integrals in different regions of energy of the neutron flux at sea level according to Refs. [15, 18, 19]). Assuming for each one of the four energy intervals in Table 2 an average value for the fraction of events detected in the region of interest (from the response plotted in Fig. 8), the counting rate due to the external neutron background in the region up to 10 keV has been estimated to be . Since this number is one order of magnitude lower than the experimental background levels of the CCD detector, it seems that environmental neutrons are not very significant at the present level of sensitivity.
| Energy Range | Neutron Flux | Reference |
|---|---|---|
| [18] | ||
| – | [15] | |
| – | [15] | |
| – | [15] | |
| [19] |
At sea level, neutron production by capture of negative muons is strongly enhanced especially in high Z materials. Therefore, an estimate has been made also for the muon-induced neutrons in the lead shielding of the CCD detector. Induced neutrons come mainly from evaporation and therefore their energy spectrum is peaked around 1 MeV and very reduced above 5 MeV. Using a measured total muon flux of , FLUKA simulations [20][21] give a yield for neutrons of around which is more than one order of magnitude lower than the flux due to environmental neutrons.Therefore, the installation of the present lead shield is not a problem from the point of view of muon-induced neutrons.
It is worth noting that the values quoted for the estimated contribution to the CCD counting rate of the external gamma and neutron backgrounds must be considered as just an indication of the order of magnitude of these contributions. Both particle fluxes and simulated detector responses (the key ingredients of these estimates) have important uncertainties which in many cases are difficult to be quantified. Some facts that contribute to these uncertainties are that high energy photon and neutron simulations have not been checked against experimental data, that radon levels are known to have important fluctuations in time or that the neutron flux at sea level depends on different factors not taken into account. Nevertheless, results have been useful to identify the main background sources of the CCD detector.
5.5 Intrinsic radioactive impurities
An evaluation of the contribution of the internal radioactive impurities in the components of the CCD to the counting rate measured in this detector has been made based on some measurements of radiopurity levels of several components and simulation of the effect of these activities. These estimates can help in the development and construction of a new CCD detector optimized from the radioactive point of view.
The levels of radioactive impurities in the main components of a CCD detector equivalent to that actually used in the CAST experiment (circuit board, sockets, ceramics, Si detector and cooling mask) were measured in the Canfranc Underground Laboratory in Spain using a special ultra-low background germanium detector and can be found in a database of radiopurity of materials333Available at http://radiopurity.in2p3.fr/inside the ILIAS program (Integrated Large Infraestructures for Atroparticle Science). Activities come mainly from the radioactive chains 235U, 238U, 232Th and the isotope 40K. For the Si chip and the cooling mask pieces only upper limits could be derived for the impurities of the radioactive chains 235U, 238U and 232Th. For the chip, also for 40K only a limit was deduced. 238U chain is broken at the level of 226Ra for the sockets and ceramic pieces.
5.5.1 Simulations
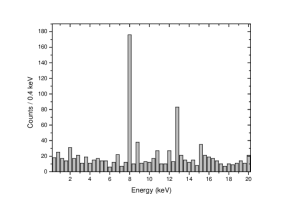
For each component of the CCD detector, complete decays of the radioactive chains 235U, 238U and 232Th, assumed in secular equilibrium, and the isotope 40K have been simulated considering impurities uniformly distributed in the materials. As a result, a collection of energy spectra corresponding to each impurity in each component has been obtained. Just as an example, Fig. 9 shows the simulated spectrum registered in the CCD detector for 232Th impurities in the ceramic pieces (it must be noted that no normalization has been made in this plot).
Peak structures observed in the real CCD spectrum (see Fig. 2) at energies slightly higher than those of the region of interest are partly reproduced by these simulations:
-
•
In most of the simulated spectra for the different components, the X-ray Kα line from copper at 8.0 keV is clearly imposed on a flat background. It is due to photoelectric interactions of more energetic photons in copper pieces. A much smaller line at 8.9 keV is visible too due to much less intense copper Kβ X-rays.
-
•
X-rays from gold (Lα at 9.7 keV and Lβ at 11.5 keV) are also present since the gold lining of the cooling mask pieces where they are generated has been properly included in the simulations.
-
•
Other low energy gamma lines and especially X-rays between 10 and 15 keV emitted by daughter nuclei in the radioactive chains have been identified in the simulated spectra for the components closest to the Si chip. But the X-rays observed in the measured CCD spectrum and presumably attributed to ordinary solders in the electronic board containing 210Pb are not reproduced since these solders have not been taken into account in the simulations.
-
•
In the simulated spectrum for 40K in the chip, a peak at 3 keV is seen due to the X-rays following the electronic capture in this isotope. This peak is not observed in the real spectrum because it is probably hidden by the continuum background, which points to a completely negligible 40K impurity in the Si chip.
5.5.2 Results
Table 3 shows the total contributions to the CCD counting rate of each simulated component between 1 and 7 keV. Contribution from the Si chip and the cooling mask pieces must be considered just an upper limit, since only bounds for activity were set for these components, as stated before. Although the screening of radiopurity was made only for the front part of the cooling mask, equal activity has been considered for the rear part assuming that the same kind of copper was used for both pieces. Contribution from 238U in the sockets and ceramic pieces is overestimated since the assumed secular equilibrium in the chain is not true, having from 226Ra onwards a lower activity. The errors quoted in Table 3 (between 5 and 10% approximately) include the statistical error associated with the simulation and also the error of the measured activity of the pieces. In general, errors from the activity dominate, although statistical errors are not always negligible because of the large execution time of simulations.
| Detector Component | Differential Flux |
|---|---|
| CCD Board | |
| CCD Chip | |
| Ceramics | |
| Sockets | |
| Front Cooling Mask | |
| Rear Cooling Mask |
These estimates indicate that the components whose radioactive impurities have been actually measured (CCD board, ceramics and sockets) produce in the region up to . Considering the upper limits of radio-impurities for all the other components, the total contribution to background would be . Compared to the measured background level in the CCD detector between and , , impurities from CCD board, ceramics, and sockets account for 4% of the observed counting rate; including all the other simulated impurities, up to 33% of the counting rate would be justified at most.
6 Conclusions
The CCD detector of the CAST experiment looks for the very rare signal of solar axions, consisting of photons peaking around 4 keV. Different background components entangle the expected signal. A Monte-Carlo simulation tool for this detector has been developed and used for the most relevant background sources with the aim to help in the understanding of the origin of observed events and constructing a plausible background model for the measured counting rate between and .
Using the simulated response of the CCD detector to the external gamma background (including the effect of shieldings), an estimate of the contribution of this background component has been attempted, finding that measured radon levels in the air of the CAST site could produce on average 1% of the registered counting rate, while however just the measured activities from 40K and 232Th and 238U chains in the walls of the CAST hall could justify more than 50% of this counting rate.
The response of the CCD to neutrons of different energies has also been simulated. Based on this response and typical fluxes of neutrons at sea level, a rough estimate of the contribution to the CCD counting rate of environmental neutrons has been made. At the present level of sensitivity, these neutrons do not seem to be a very relevant source of the CCD background, producing just a few per cent of the observed counting rate. Contribution from muon-induced neutrons in the present lead shieldings has been checked to be negligible.
Finally, the contribution to the CCD counting rate of the internal radioactive impurities of the main detector components has been simulated using the activities measured at the Canfranc Underground Laboratory with an ultra-low background germanium detector. This contribution could justify at most 33% of the measured counting rates.
Taking into account all these results, a quite complete model for the background measured by the CCD detector has been obtained. Other possible relevant sources of background, not evaluated up to now, are thought to be the radioactive impurities from the soil and from massive components of the experimental set-up.
7 Acknowledgments
This work has been performed in the CAST collaboration. We thank our colleagues for their support. Furthermore, the authors acknowledge the helpful discussions within the network on direct dark matter detection of the ILIAS integrating activity (Contract number: EU-RII3-CT-2003-506222). Our gratitude also to the group of the Canfranc Underground Laboratory for material radiopurity measurements. This project was also supported by the Bundesministerium für Bildung und Forschung (BMBF) under the grant number 05 CC2EEA/9 and 05 CC1RD1/0, by the Virtuelles Institut für Dunkle Materie und Neutrinos – VIDMAN, and by the Spanish Ministry of Education and Science under contract FPA2004-00973.
References
- [1] R. D. Peccei, H. R. Quinn, CP conservation in the presence of pseudoparticles, Phys. Rev. Lett. 38 (1977) 1440–1443.
- [2] P. Sikivie, Experimental tests of the invisible axion, Phys. Rev. Lett. 51 (1983) 1415–1417.
- [3] K. Zioutas et al, A decommissioned LHC model magnet as an axion telescope, Nuclear Instruments and Methods in Physics Research A 425 (1999) 480–487.
- [4] C. E. Aalseth et al, The Cern Axion Solar Telescope CAST, New. J. Phys. in preparation.
- [5] D. Autiero et al, The CAST Time Projection Chamber, New. J. Phys. in preparation.
- [6] S. Andriamonje et al, The Micromegas Detector of the CAST Experiment, New J. Phys. in preparation.
- [7] M. Kuster et al, The X-ray Telescope of CAST, New J. Phys. in preparation.
- [8] K. Zioutas et al, First results form the CERN Axion Solar Telescope CAST, Phys. Rev. Lett. 94 (2005) 121301–1.
-
[9]
S. Agostinelli et al, Geant4-a simulation toolkit, Nucl. Instrum. Methods
Phys. Res., Sect. A 506 (2003) 250–303.
URL http://www.cern.ch/geant4 - [10] H. Wolter, Spiegelsysteme streifenden Einfalls als Abbildende Optiken für Röntgenstrahlen, Ann. Phys. (Leipzig) 10 (1952) 94.
- [11] J. Altmann et al, Mirror system for the German X-ray satellite ABRIXAS: I. Flight mirror fabrication, integration, and testing, in: Hoover and Walker [22], pp. 350–358.
- [12] J. Egle et al, Mirror system for the German X-ray satellite ABRIXAS: II. Design and mirror development, in: Hoover and Walker [22], pp. 359–368.
- [13] L. Strüder et al, ”the European Photon Imaging Camera on XMM-Newton: The pn-ccd camera”, aa 365 (2001) L18–L26.
- [14] G. Dumont, Background measurement for the CAST experiment, Technical Note CERN-SC-2004-027-RP-TN, CERN (2004).
- [15] G. Heusser, Low-radioactivity background techniques, Annu. Rev. Nucl. Part. Sci. 45 (1995) 543–590.
- [16] M. Popp et al, Modeling the energy response of pn-CCDs in the 0.2-10 kev band, Nuclear Instruments and Methods in Physics Research A 439 (2000) 567–574.
- [17] P. F. Smith, J. D. Lewin, Dark matter detection, Phys. Rep. 187 (1990) 203–280.
- [18] W. Hess et al, Cosmic-Ray Neutron Energy Spectrum, Physical Review 116 (1959) 445–457.
- [19] J. F. Ziegler, Terrestrial cosmic ray intensities, IBM Journal of Research and Development 42 (1998) 117–139.
- [20] A. Fasso et al, FLUKA: a multi-particle transport code, CERN-2005-10 (2005) INFN/TC–05/11, SLAC–R–773.
- [21] A. Fasso et al, The physics models of FLUKA: status and recent developments, Computing in High Energy and Nuclear Physics 2003 Conference (CHEP2003).hep-ph/0306267.
- [22] R. B. Hoover, A. B. Walker (Eds.), X-Ray Optics, Instruments, and Missions, Vol. 3444 of Proceedings of SPIE, SPIE, Bellingham, WA, 1998.