The M33 Variable Star Population Revealed by Spitzer
Abstract
We analyze five epochs of Spitzer Space Telescope/Infrared Array Camera (IRAC) observations of the nearby spiral galaxy M33. Each epoch covered nearly a square degree at 3.6, 4.5, and 8.0 m. The point source catalog from the full dataset contains 37,650 stars. The stars have luminosities characteristic of the asymptotic giant branch and can be separated into oxygen-rich and carbon-rich populations by their colors. The colors indicate that over 80% of the stars detected at 8.0 m have dust shells. Photometric comparison of epochs using conservative criteria yields a catalog of 2,923 variable stars. These variables are most likely long-period variables amidst an evolved stellar population. At least one-third of the identified carbon stars are variable.
1 Introduction
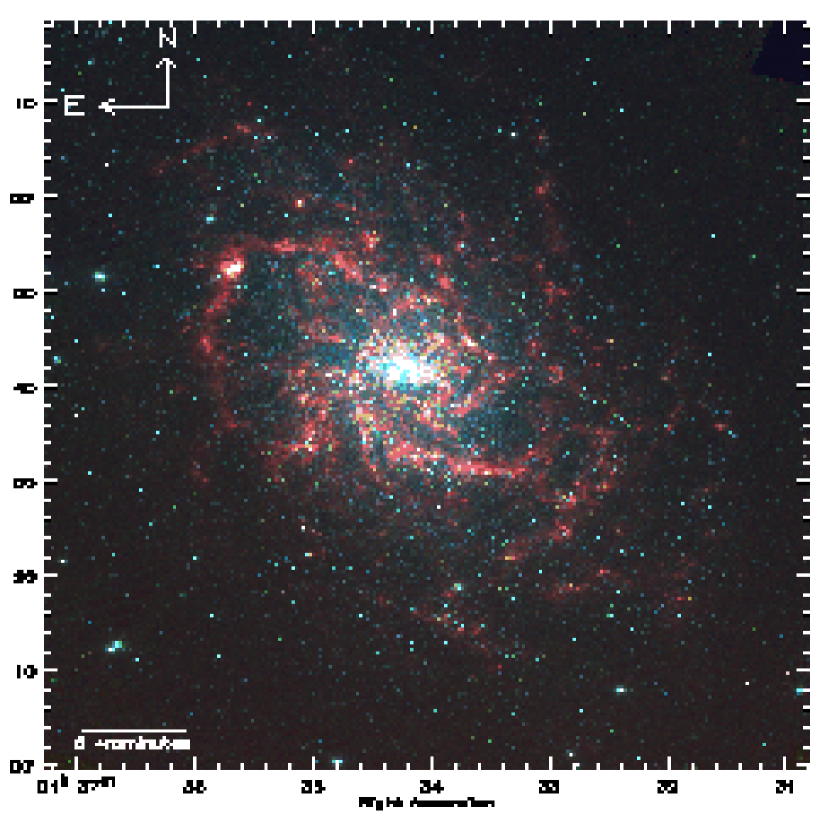
The Triangulum galaxy, M33, is a late-type spiral galaxy and the third largest galaxy in the Local Group after the Andromeda and the Milky Way galaxies. M33 is well-suited for high spatial resolution studies of stellar populations in spiral galaxies because it is only 830 kpc distant (Distance modulus of 24.60, Wilson et al. (1990)) and has a favorable inclination angle of 52 degrees (Corbelli & Salucci, 2000). For these reasons M33 has been the subject of numerous such studies covering many wavelengths including the radio (Engargiola et al., 2003; Rosolowski et al., 2007), near-infrared (Skrutskie et al., 2006, Two Micron All Sky Survey – 2MASS), optical (Massey et al., 2006; Macri et al., 2001; Humphreys & Sandage, 1980), and X-ray (Pietsch et al., 2004) regimes.
Resolved stellar population studies of M33 at infrared (IR) wavelengths are now possible using the Infrared Array Camera (Fazio et al., 2004, IRAC) on the Spitzer Space Telescope (Werner et al., 2004; Gehrz et al., 2007). Even with modest integration times, IRAC can detect a significant segment of the most luminous stellar population in M33. Humphreys et al. (2006), for example, presented a detailed analysis of the early-type star Variable A. More numerous sources detectable with IRAC at 3.6 and 4.5 m include luminous, cooler stars that have evolved off the main sequence, i.e., giant and supergiant stars, whose energy distributions peak in the near-IR. The point sources detected at the longest IRAC wavelength (8.0 m) include a population which exhibits long-period, large-amplitude variability and produces extended circumstellar winds resulting in significant mass loss. The dust grain formation arising in these winds causes the spectral energy distributions of these stars to deviate from the Rayleigh-Jeans tail of a blackbody curve typical of a stellar photosphere, resulting in an IR excess at 8.0 m. These stars can be partially or completely obscured at optical wavelengths by the same dust whose thermal emission makes them stand out at IR wavelengths. Jackson et al. (2007) found that up to 39% of the IRAC detected asymptotic giant branch (AGB) stars in the Local Group dwarf galaxy WLM are not detected at optical wavelengths. It is therefore plausible that a portion of the infrared-luminous M33 stellar populations are distinct from those previously cataloged at visible wavelengths and are only now beginning to be understood.
The knowledge of variable stars in other Local Group galaxies has increased considerably in recent years with the advent of large-scale, high-resolution mosaic imaging technology and microlensing projects such as EROS (Aubourg et al., 1993) and MACHO (Alcock et al., 1997), which have cataloged variable stars as a byproduct of their surveys. However, few high resolution variable star studies have encompassed the entire M33 galaxy because of its sheer angular size. Two exceptions are the DIRECT optical project (Macri et al., 2001), which imaged the center region of M33 ( kpc) cataloging 103 variable stars, and a recent optical CFHT survey by Hartman et al. (2006), which imaged 1 deg2 creating a catalog of over 104 variables.
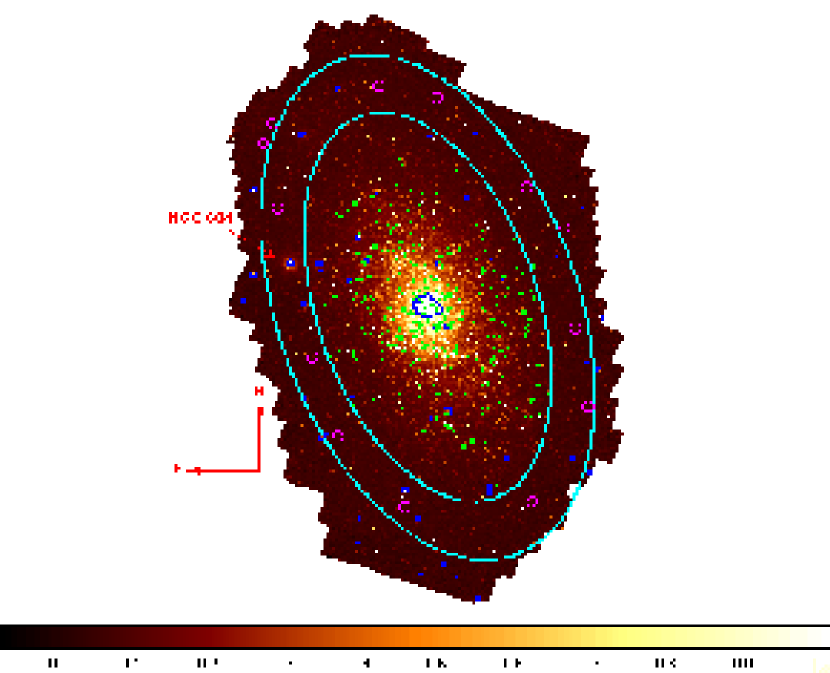
This paper presents a five-epoch 1.0 deg2 IRAC survey of the entire M33 galaxy. Figures 1 and 2 show large scale IR maps of M33 at 3.6, 4.5, and 8.0 m. The five epochs span a 19 month period (Table 1), providing a unique opportunity to identify M33’s variable star population at IR wavelengths and determine their infrared colors and spatial distribution. Our survey covers an area similar to the CFHT survey (Hartman et al., 2006), and the resulting catalog of 2,923 variable stars makes our work the first large scale variability study of M33 in the IR. Section 2 describes the observations and the data reduction process, §3.1 discusses contamination by foreground Milky Way stars, §3.2 describes the criteria used to identify variables, and §3.3 presents an overview of the classes of stars detected and their properties. The last section (§4) gives a brief summary of our survey results.
2 Observations
M33 was mapped at six epochs with IRAC on Spitzer as part of our Guaranteed Time Observer (GTO) program (Program ID 5, PI: R. D. Gehrz). The map at each epoch consisted of two consecutive astronomical observing requests (AORs) at all four IRAC wavelengths (3.6, 4.5, 5.8, and 8.0 m). The mapping sequence for each epoch consisted of 148 positions per channel. Each position was observed with three 12 s frames dithered with the standard, small, cycling pattern. The 4.5 m and 8.0 m images of any tile-location were obtained simultaneously. The 3.6 m image was obtained a few minutes prior to or after the longer wavelength images. The FWHM of the point spread function at 3.6 m is or 6.7 pc at the distance of M33. This specific study analyzes only the first five epochs, which cover a span of 19 months, at 3.6, 4.5, and 8.0 m. The sixth epoch was not available when the bulk of this present study was completed and is therefore not part of these results. The 5.8 m images are generally similar to the 8.0 m images but have lower sensitivity and were therefore excluded.
The images were processed at the Spitzer Science Center (SSC) in the Basic Calibrated Data (BCD) pipeline 11.0.2 (S11) which was the lastest pipeline version available at the time image processing was performed. Post-BCD processing was carried out using an artifact mitigation algorithm developed by Carey (2005). This algorithm alleviates the effects of muxbleed, column pulldown/pullup, electronic banding, and bias variations between the images. The results of the artifact mitigation processing showed no artifacts were introduced into the images. The SSC MOPEX software (2005 Sep 30 version, Makovoz & Khan 2005) was used to mosaic the post-BCD images together. The MOPEX processing includes background matching, outlier detection and rejection, mosaicing, and coaddition. Background matching was performed by minimizing the pixel differences in overlapping areas. The effect of flux clipping by MOPEX (Schuster, Marengo, & Patten, 2006) was not accounted for during the mosaic processing. This effect, if present in the mosaicked images, introduces an additional error of 5% and in the worst possible cases %. The maximum (10%) flux clipping error would therefore affect the identification of the 37 lowest amplitude variable stars in our catalog (amplitude mag) representing 1% of the variable stars. The variability of these sources may be spurious and an artifact of processing. However, even if this effect is present, the vast majority of variable stars identified in our catalog show greater flux variability than 10%, and their identification and characteristics are not affected. In the final step, each image was regridded onto a single world coordinate system with a pixel scale of 122 pixel-1, corresponding to 4.9 pc at the adopted distance of M33. The final mosaics span an area of 1.0∘ 1.2∘ with the exact coverage at the outer edges varying slightly from epoch to epoch.
Photometry of the stellar population was performed on mosaics using the software package DAOphot/ALLSTAR, a point spread function (PSF) based photometry package designed to handle high density star fields and reject extended sources (Stetson, 1987). The point source fluxes were found by fitting a PSF generated in DAOphot using bright, isolated stars in areas of low and flat background from the mosaicked images of each channel. Due to DAOphot memory constraints, the M33 mosaics were each processed separately in two halves, and more than 70 bright and isolated stars were selected in each half to generate the PSFs. Other photometric procedures were tried but produced higher uncertainties and proved less successful in recovering faint stars. Analysis of the residual images showed that PSFs from a large mosaic are superior to ones generated from individual frames. The individual images have lower signal to noise than the 3-point dithered mosaicked image and have many fewer stars. As a result, the PSF cannot be as well sampled as in the mosaic image. Photometry conducted on smaller mosaics also yielded inferior results, despite the smaller mosaics having more uniform stellar densities and background. The smaller mosaicked images did not contain a sufficient number of isolated stars in areas of low and constant background from which the PSF could be generated.
The DAOphot photometric zero points were verified by aperture photometry of bright, isolated stars according to the prescription given by Reach et al. (2005). The DAOphot and aperture magnitudes agree within a dispersion of 0.07 mag at 3.6 m and 0.06 mag at 4.5 and 8.0 m. These dispersions give estimates of the uncertainty of the DAOphot zero point. The true offset is likely to be smaller because some of the dispersion comes from errors in the aperture magnitude sky levels caused by confusion in the crowded fields. The slightly larger dispersion at 3.6 m, where crowding is most severe, is probably a sign that confusion is important. Zero point offsets are likely to be similar at all wavelengths, leaving IRAC colors less affected than individual magnitudes, and of course zero point offsets cannot affect variability measures at all. The magnitudes given in this paper are thus on the IRAC S11 scale as described in the IRAC Data Handbook111http://ssc.spitzer.caltech.edu/irac/dh/iracdatahandbook3.9.pdf V3.0 within the stated uncertainties.
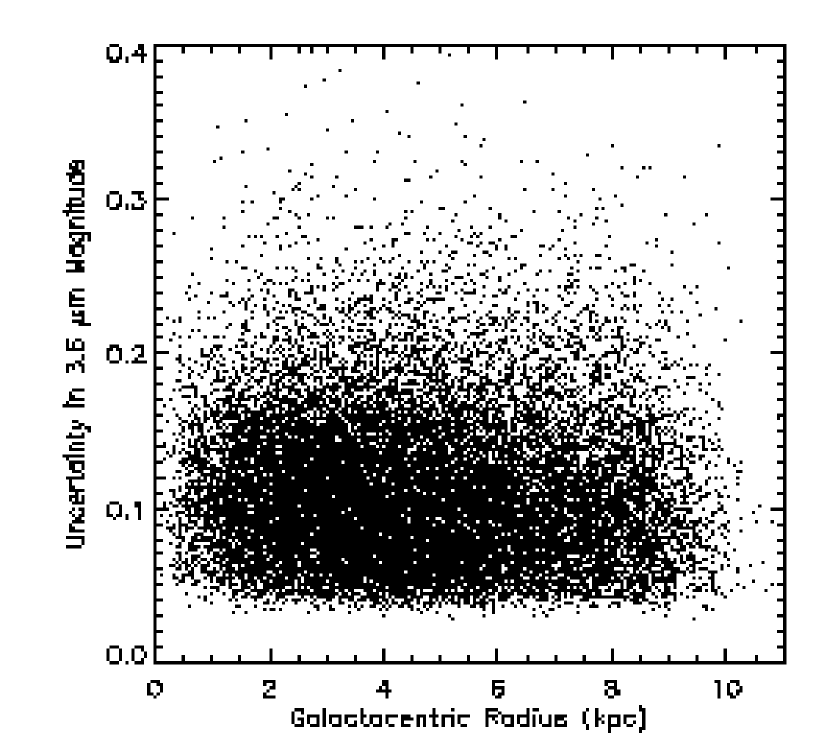
DAOphot creates photometry lists with image pixel coordinates, fluxes, and accuracy parameters quantifying goodness of fit and sharpness (an image quality diagnostic). DAOphot provides an uncertainty estimate that includes detector readout noise, photon statistics, accuracy of the PSF-fit, and uncertainty in the PSF itself. The final internal uncertainty () for each epoch includes an additional 0.03 mag added in quadrature to account for the dispersion in repeated measurements of any star (Reach et al., 2005). For stars in the final catalogs, the median photometric uncertainty (Figure 3) is 10%, the minimum is 5%, and 90% of the measurements have uncertainties 20%.
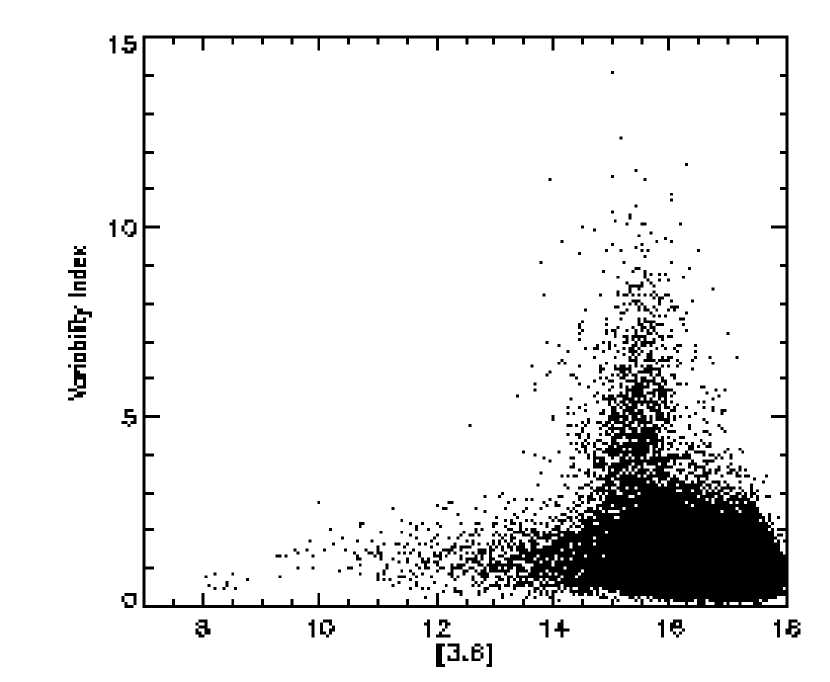
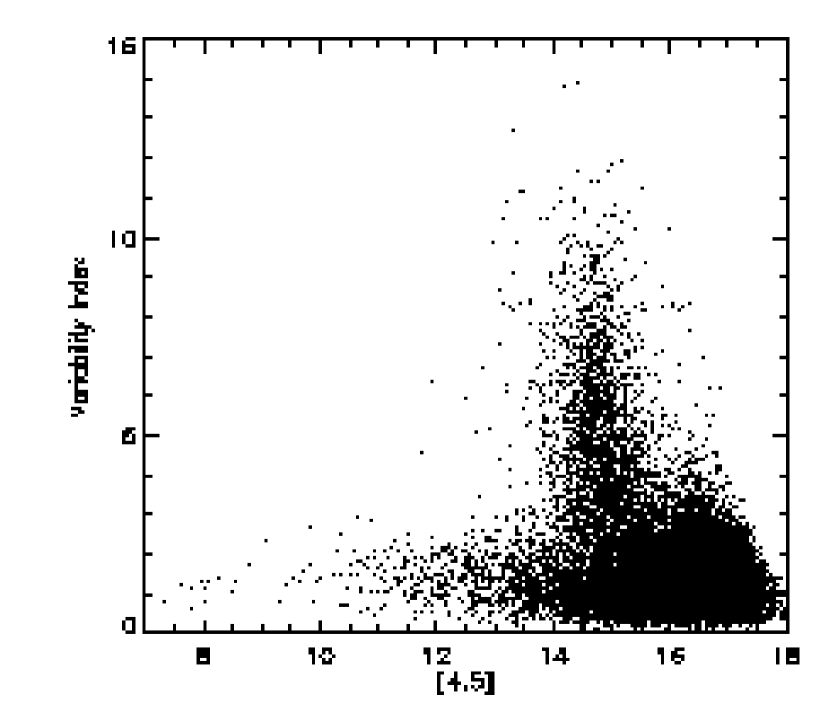
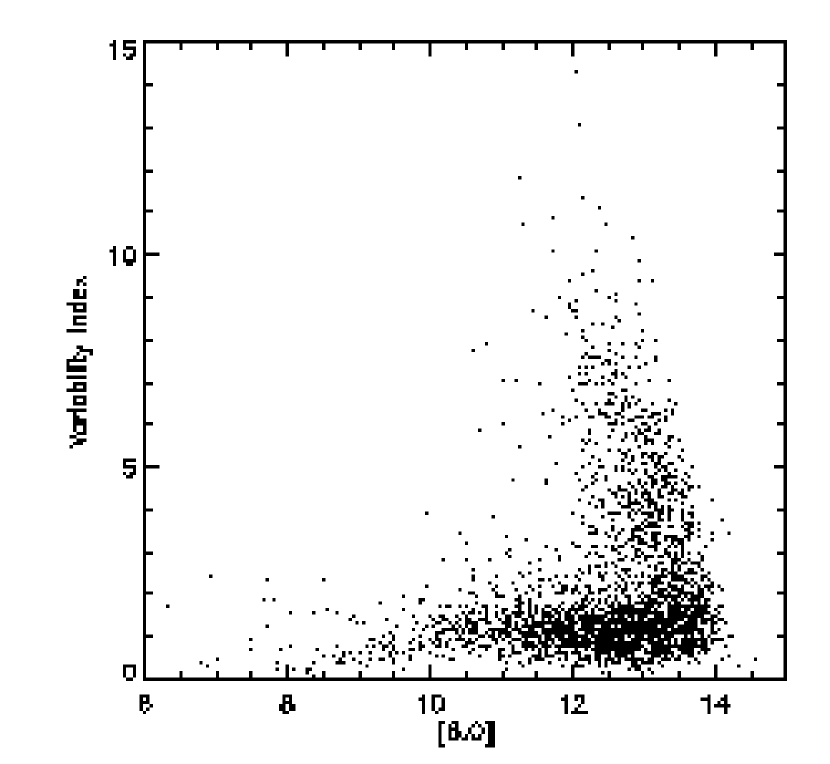
The individual uncertainty estimates were verified by analyzing the observed discrepancy in flux for each star from epoch to epoch. Variability index (Gallart et al., 2004) is defined as the ratio of standard deviation of the measurements at the five epochs for a star to the mean internal uncertainty of that star. Because the internal uncertainties are nearly constant for a given star, the variability index distribution (Figure 4) will be close to a chi-square distribution except for the presence of variable stars in the tail of the distribution. Nearly 95% of sources at 3.6 m, 91% of sources at 4.5 m, and 78% of sources at 8.0 m cluster below a variability index value of three at each wavelength band suggesting that although the flux measurements do vary between epochs, the dispersion is less than 3 of the .
A master star catalog was created from the 15 individual photometry lists (five epochs, three wavelengths each) using DAOMATCH and DAOMASTER. DAOMATCH and DAOMASTER are separate programs that merge photometry output files from DAOphot into a single file with matched point sources. DAOMATCH finds the translation, rotation, and scaling solution between the photometry files, and DAOMASTER then matches point sources by pixel coordinates. The final coordinates were converted to right ascension (RA.) and declination (Decl.) using the WCSTools’ xy2sky coordinate conversion program222http://tdc-www.harvard.edu/software/wcstools/. A total of over 100,000 sources were cataloged. When the fluxes from all of these stars are summed, the total flux corresponds to a 3.6 m apparent magnitude of . This value is comparable to the total M33 3.6 m apparent magnitude of obtained from surface brightness fitting. We conclude that 60% of the 3.6 µm flux of M33 can be resolved into point sources at Spitzer resolution.
Detailed completeness limit analysis was difficult given the wide range of stellar density conditions found across our field of view. However, the completeness limits can be estimated from the cumulative luminosity functions (Figure 5) and the measured noise levels (Figure 3). We estimate that our catalog is complete to 16.6 mag at 3.6 m, 16.6 mag at 4.5 m, and 14.6 mag at 8.0 m. The expected IRAC 5 sensitivity at 3.6 µm, calculated with the senspet tool333http://ssc.spitzer.caltech.edu/tools/senspet and assuming a high background level (0.25 MJy/sr) is 18.3 mag. The difference between the expected sensitivty of 18.3 mag and the estimated completeness limit of 16.6 mag probably arises from the blending of sources in the crowded regions of M33. In fact, in the most crowded central regions, reliable photometry is quite difficult. Although cataloged, stars in regions of 3.6 µm surface brightness 1.06 MJy/sr were not examined for variability. (Isophotes of constant surface brightness were found after smoothing the 3.6 m epoch 1 image with a 20-pixel-radius Gaussian kernel.) The surface brightness cutoff corresponds to the central region of the galaxy ( kpc) and the center of bright star-forming regions such as NGC 604. A total of 934 stars were found in these regions of high surface brightness.
The final catalogs consist of stars detected at the first five epochs in at least one wavelength. The catalogs are given in Tables 2 (non-variable) and Tables 3 (detected variables, see §3.2). Complete tables are available in electronic form in the online version of this paper accessible through the Astrophysical Journal. These tables contain 37650 sources, which can be referred to by the acronym ‘SSTM3307’ followed by the source’s coordinates as indicated in the catalog444eg., SSTM3307 J013151.74+302545.2 22.965624 30.429226. Because of the lower sensitivity of IRAC at 8.0 m and the Rayleigh-Jeans spectrum of most stars, only 5,537 stars were detected even once at 8.0 m, and only 2,689 were detected at all five epochs. Stars in the high surface brightness regions are included in the non-variable catalog for convenience, but they were not tested for variability because the indicated magnitude uncertainties () may be underestimated. With this exclusion of the regions of high-surface brightness, the uncertainties do not change much with galacto-centric radius, as shown in Figure 6.
3 Discussion
3.1 Galactic Foreground Star Contamination
The M33 IRAC observations extend out to the 8.7 kpc Holmberg radius (Holmberg, 1958) along the semi-major axis of the galaxy but not beyond. This limits the area available for a field contamination analysis. Moreover, each IRAC epoch has slightly different areal coverage at the edges, further reducing the area covered at all five epochs. Using the limited areal coverage available in the images, two methods were used to estimate the field contamination, namely a first order determination of the IR stellar component extent and an analysis of selected fields near the image limits.
Our first method examines to first order the extent of the IR stellar component in M33 by analyzing the radial distribution of point sources. Radial star counts across the semi-major axis (Figure 7) show that 90% of the stellar population is contained within a galacto-centric radius of 7.5 kpc at 3.6 m, and 95% of stars are within 6.0 kpc at 8.0 m. The flattening of the star counts past kpc indicate that field stars from the Milky Way become important at that radius.
The radial distribution of stars was used to guide the selection of thirteen reference fields located outside the Holmberg radius used to estimate the field contamination in our second method. Each field had a radius of for a total of 23 arcmin2; the regions are shown in Figure 1. At 3.6 µm, 78 catalog stars lie within these regions for an indicated stellar density of 12,200 stars deg-2. Only 7 stars were identified at 8.0 m making accurate extrapolation difficult. The star count at 3.6 m in the outer fields corresponds to 6,900 stars or about 20% of the total within an ellipse at the Holmberg radius (0.57 deg2). This should be an upper limit on catalog stars that do not belong to M33. For comparison, the DIRBE Faint Source Model (Arendt et al., 1998, FSM) predicts about 6,400 stars deg-2 within the 3.6 m magnitude range of our survey. The difference in the observed stellar areal density (12,200 deg-2) and the predicted field star areal density (6,400 deg-2) suggests that even in the outer regions of the image about half the catalog stars belong to M33, and the contamination within the Holmberg radius is only about 10%. Because the stars have a relatively small range in colors, the contamination percentage is about the same at all three catalog wavelengths. Figures 5 and 8 compare the luminosity functions of stars found throughout M33 to stars in the selected outer regions.
Foreground stars must be main sequence (“dwarf”) stars because a giant star in the Milky Way would have mag, much brighter than any of the sources in the catalog. Dwarfs are redder in color than giants because they have water vapor absorption at 3.6 m and lack CO absorption at 4.5 m (Merrill & Stein, 1976). Figures 9 and 10 show the color distributions of the catalog stars. As expected for foreground dwarfs, the stars in the outer fields occupy the redder half of the color distribution. Regardless of the similarity in colors, the contamination of the variable star catalog should be very small because the foreground main sequence dwarfs are not variable. Indeed, in the outer fields, only one star met our criteria for variability, and it is likely an M33 member. Therefore, although about 10–20% of the non-variable stars could be foreground point sources, the contamination component to the identified variable population is negligible.
3.2 Variability Search
Strict criteria for variability were chosen to avoid having spurious detector events interpreted as variablity in a star. The disadvantage of this approach is that some true variables will not be flagged as such. As noted in §2, only stars detected at all five epochs in at least one wavelength are in the catalog. However, once a star makes it to the catalog all available measurements of that star are included. The variability search was limited to stars with mean magnitudes brighter than the estimated completeness limits (16.6, 16.6, and 14.6 mag at 3.6, 4.5, and 8.0 µm, respectively) and stars outside regions of highest surface brightness (see §2).
The threshold criterion for indentifying what magnitude variation could be attributed to intrinsic variability versus measurement fluctuations was determined empirically by comparing the dispersion in the magnitude at all epochs with the internal uncertainties of a given star (Figures 11 –13, see variability index discussion in §2). A minimum variability index value of three ensures conservative variable star identification and represents a deviation from a mean magnitude of at least 0.1 mag at 3.6 m depending on the point source’s uncertainties. The variability search itself consisted of comparing the magnitude at an epoch when a star was detected to the mean magnitude at that wavelength. If the magnitude difference was at least for that epoch, the measurement was flagged as indicating intrinsic variability.
The final catalog of variables consists of all stars flagged as variable in two or more measurements. (This discrepancy can include two wavelengths at a single epoch or two epochs at a single wavelength.) Requiring two discrepant measurements was necessary because a single discrepant magnitude can be caused by an unremoved cosmic ray or other processing artifact. Table 4 shows the number of variable stars identified at each wavelength.
3.3 The Properties of Star Classes in the IRAC Bands
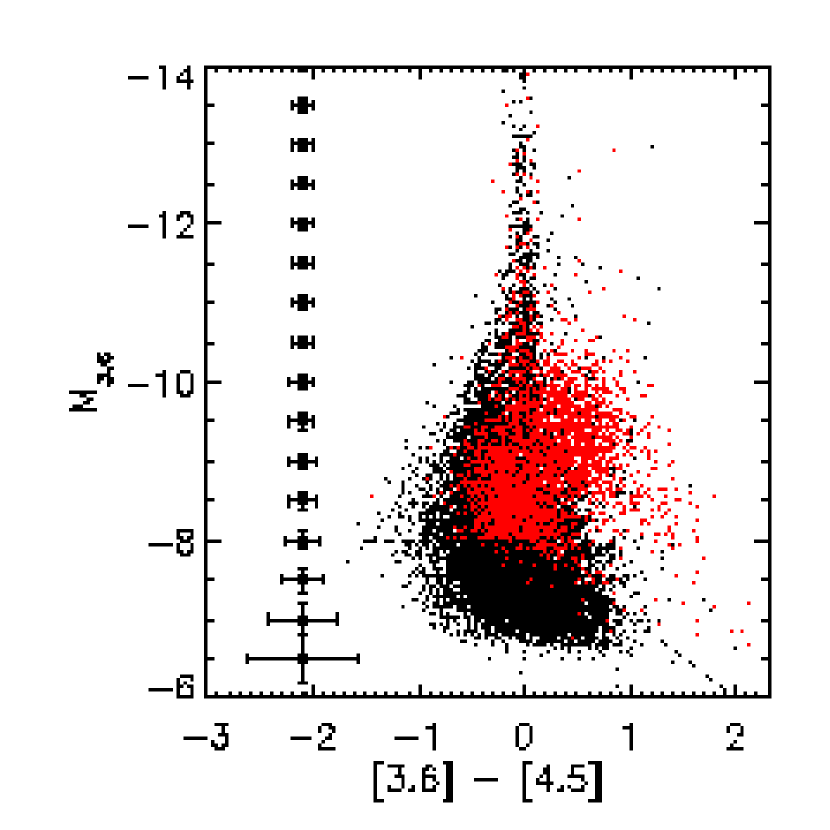
Figure 14 shows a color-magnitude diagram (CMD) of all point sources in both catalogs. The non-variable sources have colors centered on , as also shown in Figure 15. This slightly blue color is typical of oxygen-rich giant stars whose photospheric CO and SiO absorption bands fall within the 4.5 m bandpass (Marengo et al., 2007; Bolatto et al., 2007). The variable stars have a bimodal distribution. One peak is at , the same color as the non-variable, oxygen-rich stars. The second peak is at . Stars in this color region are mostly carbon stars. The slightly red color is due to the strong photospheric absorption features of C2H2 and HCN in the 3.6 m bandpass (Marengo et al., 2007). In this part of the CMD, 34% of the stars are flagged as variable. Quite likely a much larger fraction of the carbon stars are variable but not detected as such with our strict criteria.
In other Local Group galaxies, the tip of the red giant branch (TRGB) is found at for the Magellanic Clouds (van Loon, Marshall, & Zijlstra, 2005) and for the dwarf galaxy WLM (Jackson et al., 2007). While age and metallicity will have an impact of 0.3 mag depending on the wavelength studied (Cioni et al., 2003), the TRGB for M33 should be at mag, below the completeness limit of our survey. Although the observations lack sufficient sensitivity to detect TRGB stars, they do, however, have ample sensitivity to detect AGB stars. The observational limit at mag at the distance to M33 corresponds to the brightness expected of luminous AGB stars and red supergiants (Cox, 2000). Dust modeling predictions for AGB stars (Groenewegen, 2006) give expected absolute magnitudes ranging from mag for late M stars without appreciable mass loss to M mag for early C stars with mass-loss. Whitelock et al. (2006) found for a sample of carbon stars that should represent the most luminous ones in the Milky Way. A range of is typical for Miras and for semi-regulars and slow irregulars. The stars detected in our catalogs lie above the TRGB and are thus likely to be AGB stars.
Most AGB stars vary to some extent, due to radial oscillations in their cool, convective mantles. On the thermal-pulsing (TP) upper slopes of the AGB, they undergo large amplitude variations on timescales of months to years in a (semi-)regular fashion, and are therefore referred to as Long Period Variables (LPVs) (e.g., Ita et al. (2004); Whitelock et al. (2003)). The 19 month time coverage in our data gives enough baseline to detect variations given the expected LPVs period range for the majority of TP-AGB stars of 100 to 700 days. Indeed, a number of variable stars were cross-correlated and identified in the Hartman et al. (2006) catalog where they classify the sources to be long-period variables based on , and , colors. The amplitude range, measured by the standard deviation about the mean magnitude, for variable sources in our survey at 3.6 m is (Figure 16). This range is within the limits found by Rejkuba et al. (2003) at 2.2 m of for Miras and semi-regulars and comparable to the peak-to-peak flux variation of 1.4 mag at 10.10 m found by van Loon et al. (1998). The carbon variable stars show greater amplitudes than their blue, O-rich counterparts (Fig. 16). The oxygen-rich AGB variables are most likely O-rich Miras which typically are 2–3 visual magnitudes fainter than other LPVs that are not oxygen-rich. This is in good agreement with the brightness distribution of O-rich and carbon variable stars in Figure 14. The most extreme cases of TP-AGB stars vary on timescales longer than 700 days when they become dust-enshrouded and often exhibit OH masers as is the case of oxygen-rich objects. These dust-enshrouded objects have a strong mid-IR excess and can be preferentially detected over IR-fainter, less evolved AGB stars. Our 19 months coverage is sufficient to detect these variables as well. Although their amplitudes may have been underestimated because the time coverage may have been only half a pulsation cycle, these stars exhibit the largest amplitudes of all in the IR and will be identified as variable in our catalog even though we have sampled only half of their pulsation cycle.
The radial profile of variable and non-variable stars (Figure 17) shows the ratio of variable stars to non-variable stars highest in the inner regions of the galaxy and decreasing with radius. This is most likely an effect from the field contamination stars. Well outside of the spiral arms ( kpc), the percentage of variable stars is roughly constant, indicative of an intermediate age AGB stellar population (1–5 Gyr old) that has been dynamically mixed in the galaxy. The number carbon stars detected increases with galactocentric radius (Figure 17).
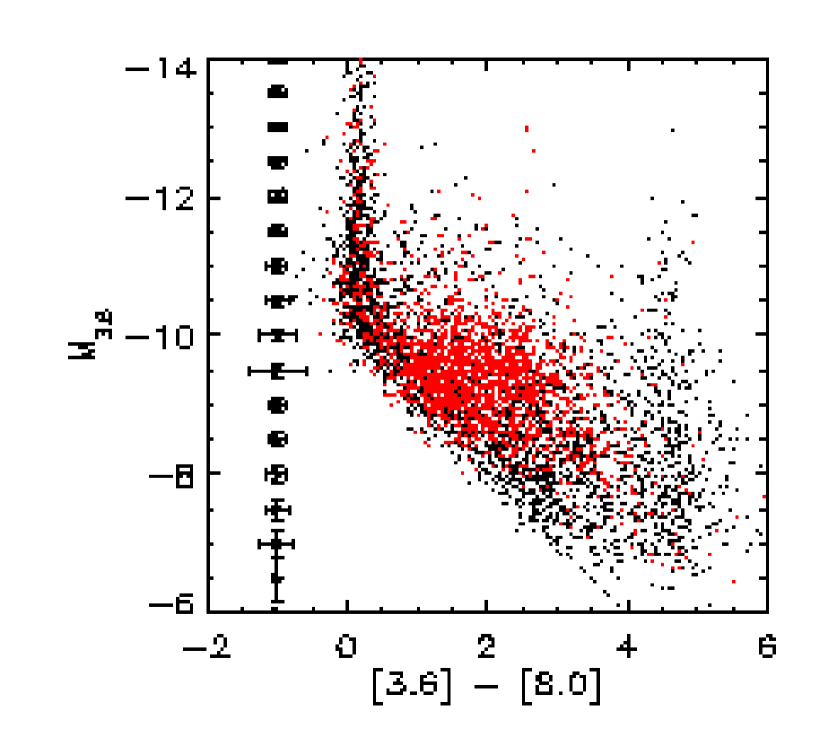
The carbon stars are bright enough to lie above the IRAC observational completeness limit at 8.0 m. Their colors are shown in Figure 18. Because both the non-variable and variable stars have dust shells giving rise to an IR excess, all but a few of the carbon stars have . The dust shells were created by previous or ongoing mass loss that characterizes much of the AGB stage of stellar evolution. The mass loss phenomenon is commonly thought to be at least partially linked to the radial pulsations and variability of these stars. That increased mass loss correlates with increased IR luminosity of LPVs (van Loon et al., 1999) is not surprising. These carbon stars with dust shells account for only one part of the tri-modal distribution across colors of point sources (see Figure 19). Making up the second group are the brightest sources at 3.6 m in our survey at . This population is a mix of field contamination stars and M33 AGB stars (Bolatto et al., 2007). The red tail of this bright 3.6 m population is spread over a color range of 0.8 to 1.7 indicating it is a mix of oxygen and carbon stars. AGB stars with near-zero color are the ones without significant circumstellar dust shells. Given the sensitivity of the 8.0 µm data, dust shells are only detectable for the most luminous AGB stars, those with (our completeness limit at 8.0 µm is ). Circumstellar shells are more difficult to detect around brighter stars as higher mass-loss rates are needed to create a similar optical depth dust shell around the higher luminosity stars than around a star less luminous (e.g., van Loon (2007)). The third peak in the distribution has . Objects with these colors are mostly young stellar objects (YSOs) according to Bolatto et al. (2007). These objects correlate well with the spiral pattern in M33 and are all located within a 5.7 kpc radius from the galaxy’s center (Figure 1). Only 15% of variable stars have colors redder than 3.5. These stars are most likely LPVs with thick dust shells. The amplitudes at 8.0 m of the variable stars detected at the longer wavelength are shown in Figure 20. The properties of the classes are summarized in Table 5.
4 Conclusions
Spitzer IRAC 3.6, 4.5, and 8.0 m images give a new look at the evolved stellar population in M33. Only stars above the TRGB are detected in current data, but both oxygen-rich and carbon-rich AGB stars can be seen. The 2923 variable stars found are most likely long-period variables with amplitudes as small as 0.1 mag and as large as 0.8, 1.0, and 0.7 mag at 3.6, 4.5, or 8.0 m, respectively. Over a third of carbon stars are variable, and those detected at 8.0 m show evidence of dust shells. Relatively few of the brightest AGB stars detected at 8.0 m showed evidence of circumstellar dust.
References
- Allen et al. (2004) Allen, L. E., Calvet, N., D’Alessio, P., Merin, B., Hartmann, L., Megeath, S. T., Gutermuth, R. A., Muzerolle, J., Pipher, J. L., Myers, P. C., & Fazio, G. G. 2004, ApJS, 154, 363
- Alcock et al. (1997) Alcock, C., Allsman, R. A., Axelrod, T. S., Bennett, D. P., Cook, K. H., Freeman, K. C., Griest, K., Guern, J. A., Lehner, M. J., Marshall, S. L., Park, H. S., Perlmutter, S., Peterson, B. A., Pratt, M. R., Quinn, P. J., Rodgers, A. W., Stubbs, C. W., & Sutherland, W. 1996, ApJ, 461, 84
- Arendt et al. (1998) Arendt, R. G., Odegard, N., Weiland, J. L., Sodroski, T. J., Hauser, M. G., Dwek, E., Kelsall, T., Moseley, S. H., Silverberg, R. F., Leisawitz, D., Mitchell, K., Reach, W. T., & Wright, E. L. 1998, ApJ, 508, 74
- Aubourg et al. (1993) Aubourg, E. Bareyre, P., Brehin, S., Gros, M., Lachieze-Rey, M., Laurent, B., Lesquoy, E., Magneville, C., Milsztajn, A., & Moscoso, L., et al. 1993, Nature, 365, 623
- Block et al. (2006) Block, D. L., Puerari, I., Stockton, A., Canalizo, G., Freeman, K. C., Jarrett, T. H., Combes, F., Groess, R., Worthey, G., Gehrz, R. D., Woodward, C. E., Polomski, E. F., & Fazio, G. G. 2007, A&A, submitted
- Bolatto et al. (2007) Bolatto, A. D., Simon, J. D., Stanimirović, S., van Loon, J. Th., Shah, R. Y., Venn, K., Leroy, A. K., Sandstrom, K., Jackson, J. M., Israel, F. P., Li, A., Staveley-Smith, L., Bot, C., Boulanger, F., & Rubio, M. 2007, ApJ, 655, 212
- Carey (2005) Carey, S. 2005,
- Cioni et al. (2003) Cioni, M.-R. L., Blommaert, J. A. D. L., Groenewegen, M. A. T., Habing, H. J., Hron, J., Kerschbaum, F., Loup, C., Omont, A., van Loon, J. Th., Whitelock, P. A., & Zijlstra, A. A. 2003, A&A, 406, 51
- Corbelli & Salucci (2000) Corbelli, E., & Salucci, P. 2000, MNRAS, 311, 441
- Cox (2000) Cox, A. N. 2000, Allen’s Astrophysical Quantities, 4th ed., (New York: Springer-Verlag New York, Inc.)
- Engargiola et al. (2003) Engargiola, G., Plambeck, R. L., Rosolowsky, E., & Blitz, L. 2003, ApJS, 149, 343
- Engelbracht et al. (2005) Engelbracht, C. W., Gordon, K. D., Reike, G. H., Werner, M. W., Dale, D. A., & Latter, W. B. 2005, ApJ, 628, 29
- Fazio et al. (2004) Fazio, G. G. et al. 2004, ApJS, 154, 10
- Gallart et al. (2004) Gallart, C., Aparicio, A., Freedman, W. L., Madore, B. F., Martínez-Delgado, D., & Stetson, P. B. 2004, ApJ, 127, 1486
- Gehrz et al. (2007) Gehrz, R. D., Roellig, T. L., Werner, M. W., Fazio, G. G., Houck, J. R., Low, F. J., Rieke, G. H., Sofier, B. T., Levine, D. A., & Romana, E. A. 2007. Review of Scientific Instruments 78, 011302
- Groenewegen (2006) Groenewegen, M. A. T. 2006, A&A, 448, 181
- Hartman et al. (2006) Hartman, J. D., Bersier, D., Stanek, K. Z., Beaulieu, J.-P., Kaluzny, J., Marquette, J.-B., & Stetson, P. B. 2006, MNRAS, 371, 1405
- Holmberg (1958) Holmberg 1958, MeLu2, 136, 1
- Humphreys & Sandage (1980) Humphreys, R., M., & Sandage, A. 1980, ApJS, 44, 319
- Humphreys et al. (2006) Humphreys, R. M., Jones, T. J., Polomski, E. F., Koppelman, M., Helton, A., McQuinn, K. B. W., Gehrz, R. D., Woodward, C. E., Wagner, R. M., Gordon, K., Hinz, J., & Willner, S. P. 2006, AJ, 131, 2105
- Indebetouw et al. (2005) Indebetouw, R. 2005, ApJ, 619, 931
- Ita et al. (2004) Ita, Y., Tanab , T., Matsunaga, N., Nakajima, Y., Nagashima, C., Nagayama, T., Kato, D., Kurita, M., Nagata, T., Sato, S., Tamura, M., Nakaya, H., & Nakada, Y. 2004, MNRAS, 347, 720
- Jackson et al. (2007) Jackson, D., Cannon, J. M., Skillman, E. D., Lee, H., Gehrz, R. D., Woodward, C. E., & Polomski, E. F. 2006, ApJ, 646, 192
- Macri et al. (2001) Macri, L. M., Stanek, K. Z., Sasselov, D. D., Krokenberger, M., & Kaluzny, J. 2001, AJ, 121, 861
- Makovoz & Khan (2005) Makovoz, D., & Kahn, I. 2005, in ASP Conf. Ser., 347, ADASS XIV, ed. P. L. Shopbell, M. C. Britton, & R. Ebert (San Francisco: ASP), 81
- Marengo et al. (2007) Marengo, M., Hora, J. L., Barmby, P., Willner, S. P., Allen, L. E., Schuster, M. T., & Fazio, G. G., 2007, in ASP Conf. Ser. Why Galaxies Care about AGB Stars, in press, (astro-ph/0611346).
- Massey (1998) Massey, P. 1998, ApJ, 501, 153
- Massey et al. (2006) Massey, P., Olsen, K. A. G., Hodge, P. W., Strong, S. B., Jacoby, G. H., Schlingman, W., & Smith, R. C. 2006, AJ, 131, 2478
- Mateo (1988) Mateo, M. 1988, ApJ, 331, 261
- Merrill & Stein (1976) Merrill, K. M., & Stein, W. A. 1976, PASP, 88, 285
- Mould et al. (2004) Mould, J., Saha, A., & Hughes, S. 2004, ApJS, 154, 623
- Pietsch et al. (2004) Pietsch, W., Misanovic, Z., Harberl, F., Hatzidimitriou, D., Ehle, M., & Trinchieri, G. 2004, A&A, 426, 11
- Reach et al. (2005) Reach, W. 2005, PASP, 117, 978
- Rieke & Lebofsky (1985) Rieke, G. H., & Lebofsky, M. J. 1985, ApJ, 288, 618
- Rejkuba et al. (2003) Rejkuba, M., Minniti, D., Silva, D. R., & Bedding, T. R. 2003, A&A, 411, 351
- Robin et al. (2003) Robin, A. C., Reyle, C., Derriere, S., & Picaud, S. 2003, A&A, 409, 523
- Rosolowski et al. (2007) Rosolowski, E., Keto, E., Matsushita, S., & Willner, S. P. 2007, ApJ, submitted
- Schuster, Marengo, & Patten (2006) Schuster, M. T., Marengo, M., & Patten, B. M. 2006, SPIE, 6270, 65
- Skrutskie et al. (2006) Skrutskie, M. F., Cutri, R. M., Stiening, R., Weinberg, M. D., Schneider, S., Carpenter, J. M., Beichman, C., Capps, R., Chester, T., Elias, J., Huchra, J., Liebert, J., Lonsdale, C., Monet, D. G., Price, S., Seitzer, P., Jarrett, T., Kirkpatrick, J. D., Gizis, J., Howard, E., Evans, T., Fowler, J., Fullmer, L., Hurt, R., Light, R., Kopan, E. L., Marsh,K. A., McCallon, H. L., Tam, R., Van Dyk, S., & Wheelock, S. 2006, AJ, 131, 1163
- Stetson (1987) Stetson, P. B. 1987, PASP, 99, 191
- van den Bergh (1991) van den Bergh, S. 1991, PASP, 103, 609
- van Loon (2007) van Loon, J. Th., 2007, astro-ph/0612374
- van Loon et al. (1998) van Loon, J. Th., Zijlstra, A. A., Whitelock, P. A., Te Lintel Hekkert, P., Chapman, J. M., Loup, C., Groenewegen, M. A. T., Waters, L. B. F. M., & Trams, N. R. 1998, A&A, 329, 169
- van Loon et al. (1999) van Loon, J. Th., Groenewegen, M. A. T., de Koter, A., Trams, N. R., Waters, L. B. F. M., Zijlstra, A. A., Whitelock, P. A., & Loup, C. 1999, A&A, 351, 559
- van Loon, Marshall, & Zijlstra (2005) van Loon, J. Th., Marshall, J. R., & Zijlstra, A. A. 2005, A&A, 442, 597
- Werner et al. (2004) Werner, M. W., Roellig, T. L., Low, F. J., Reike, G. H., Reike, M., Hoffman, W. F., Young, E., Houck, J. R., Brandl, B., Fazio, G. G., Hora, J. L., Gehrz, R. D., Helou, G., Soifer, B. T., Stauffer, J., Keene, J., Eisenhardt, P., Gallagher, D., Dautier, T. N., Irace, W., Lawrence, C. R., Simmons, L., Van Cleve, J. E., Jura, M., Wright, E. L., & Cruikshank, D. P. 2004, ApJS, 154, 1
- Whitelock et al. (2003) Whitelock, P. A., Feast, M. W., van Loon, J. Th., & Zijlstra, A. A. 2003, MNRAS, 342, 86
- Whitelock et al. (2006) Whitelock, P. A., Feast, M. W., Marang, F., & Groenewegen, M. A. T. 2006, MNRAS, 369, 751
- Willner et al. (2004) Willner, S. P., Ashby, M. L. N., Barmby, P., Fazio, G. G., Pahre, M., Smith, H. A., Kennicutt, R. C., Jr., Calzetti, D., Dale, D. A., Draine, B. T., Regan, M. W., Malhotra, S., Thornley, M. D., Appleton, P. N., Frayer, D., Helou, G., Stolovy, S., & Storrie-Lombardi, L. 2004, ApJS, 154, 222
- Wilson et al. (1990) Wilson, C. D., Freedman, W. L., & Madore, B. F. 1990, AJ, 99, 149
| Obs. | Outer AOR | Outer | Inner AOR | Inner |
|---|---|---|---|---|
| Date | UT Time | AOR No. | UT Time | AOR No. |
| 2004/01/09 | 16:01 | 3636224 | 17:17 | 3636480 |
| 2004/07/22 | 21:43 | 3638016 | 22:56 | 3637760 |
| 2004/08/16 | 03:02 | 3639040 | 04:15 | 3638784 |
| 2005/01/21 | 15:14 | 3640576 | 16:24 | 3640320 |
| 2005/08/25 | 03:00 | 13474048 | 04:13 | 13474304 |
| 2006/01/09 | 23:09 | 3649792 | 01:12 | 3650048 |
Note. — Inner and Outer AORs refer to the two regions M33 was divided into for observation. The final observations were not used in this study.
| SSTM3307 | R.A. | Decl. | M3.6:1 | :1 | M3.6:2 | :2 | … | M8.0:5 | : 5 | [3.6][4.5] | [3.6][8.0] | |||
|---|---|---|---|---|---|---|---|---|---|---|---|---|---|---|
| J013151.74+302545.2 | 22.965624 | 30.429226 | 16.075 | 0.042 | 16.049 | 0.061 | … | NaN | NaN | 16.105 | 16.038 | NaN | -0.019 | NaN |
| J013152.64+302626.5 | 22.969362 | 30.440706 | 16.092 | 0.087 | 15.999 | 0.057 | … | NaN | NaN | 16.089 | 16.041 | NaN | 0.000 | NaN |
| J013154.34+302628.1 | 22.976429 | 30.441154 | 17.920 | 0.171 | 17.571 | 0.115 | … | NaN | NaN | 17.496 | 17.108 | NaN | 0.769 | NaN |
| J013154.76+302559.2 | 22.978176 | 30.433132 | 16.981 | 0.073 | 17.049 | 0.064 | … | NaN | NaN | 16.951 | 16.971 | NaN | -0.170 | NaN |
| J013156.45+302312.7 | 22.985233 | 30.386887 | 15.170 | 0.047 | 15.182 | 0.055 | … | NaN | NaN | 15.175 | 15.260 | NaN | -0.026 | NaN |
| J013156.49+302304.4 | 22.985384 | 30.384579 | 16.883 | 0.088 | 16.770 | 0.078 | … | NaN | NaN | 16.808 | 16.877 | NaN | -0.255 | NaN |
| J013156.50+302335.0 | 22.985420 | 30.393066 | 15.823 | 0.053 | NaN | NaN | … | NaN | NaN | 15.836 | 15.857 | NaN | -0.075 | NaN |
| J013156.71+302623.0 | 22.986320 | 30.439747 | 16.240 | 0.076 | 16.191 | 0.039 | … | NaN | NaN | 16.195 | 16.180 | NaN | 0.087 | NaN |
| J013156.80+302348.0 | 22.986694 | 30.396683 | 14.623 | 0.038 | 14.653 | 0.044 | … | NaN | NaN | 14.648 | 14.713 | 14.347 | -0.100 | 0.276 |
| J013156.90+302300.9 | 22.987101 | 30.383591 | 17.089 | 0.088 | 16.883 | 0.068 | … | NaN | NaN | 16.915 | 17.023 | NaN | 0.213 | NaN |
Note. — The complete version of this table is in the electronic edition of the Journal. The printed version contains only a sample. Cols. (2) and (3): R.A. and Decl. in J2000 coordinates, cols. (4) through (19) (only columns 4, 5, 6, 7, 18, and 19 shown here): Absolute magnitude and associated photometric uncertainty given by DAOphot/ALLSTAR at 3.6, 4.5, and 8.0 m for each of the five observational epochs. Col. (20)–(22): Mean magnitude at each wavelength. Col (23) and (24): IRAC colors.
| … | R.A. | Decl. | M3.6:1 | :1 | M3.6:2 | :2 | … | M8.0:5 | : 5 | [3.6][4.5] | [3.6][8.0] | Amp3.6 | Amp4.5 | Amp8.0 | |||
|---|---|---|---|---|---|---|---|---|---|---|---|---|---|---|---|---|---|
| .. | 23.007948 | 30.434259 | 15.351 | 0.052 | 15.398 | 0.054 | … | NaN | NaN | 15.545 | 15.413 | NaN | 0.138 | NaN | 0.269 | 0.155 | NaN |
| .. | 23.016241 | 30.418886 | 16.743 | 0.059 | 16.746 | 0.058 | … | NaN | NaN | 16.741 | 16.553 | NaN | 0.142 | NaN | NaN | 0.232 | NaN |
| .. | 23.020172 | 30.466431 | 16.114 | 0.058 | 15.580 | 0.053 | … | NaN | NaN | 15.777 | 15.556 | NaN | 0.465 | NaN | 0.234 | 0.147 | NaN |
| .. | 23.025049 | 30.449522 | 15.576 | 0.046 | 15.812 | 0.039 | … | NaN | NaN | 15.710 | 15.688 | 14.498 | -0.179 | 0.920 | 0.185 | NaN | NaN |
| .. | 23.028364 | 30.645405 | 15.456 | 0.084 | 15.906 | 0.049 | … | NaN | NaN | 15.880 | 16.222 | NaN | -0.702 | NaN | 0.269 | NaN | NaN |
| .. | 23.041285 | 30.486017 | 14.036 | 0.051 | 14.344 | 0.043 | … | NaN | NaN | 14.329 | 14.293 | 13.702 | -0.090 | 0.482 | 0.190 | 0.152 | NaN |
| .. | 23.041332 | 30.442278 | 15.323 | 0.064 | 14.929 | 0.055 | … | 12.825 | 0.043 | 15.199 | 14.478 | 12.882 | 0.716 | 2.467 | 0.348 | 0.406 | 0.238 |
| .. | 23.042356 | 30.694159 | 16.391 | 0.109 | 16.369 | 0.052 | … | NaN | NaN | 16.349 | 16.101 | NaN | -0.034 | NaN | NaN | 0.281 | NaN |
| .. | 23.048187 | 30.781109 | 16.672 | 0.100 | 16.712 | 0.035 | … | NaN | NaN | 16.758 | 16.147 | NaN | 0.382 | NaN | NaN | 0.379 | NaN |
| .. | 23.048820 | 30.349766 | 14.791 | 0.038 | 14.897 | 0.044 | … | NaN | NaN | 14.879 | 14.881 | 14.573 | -0.248 | 0.270 | 0.112 | 0.094 | NaN |
Note. — The complete version of this table is in the electronic edition of the Journal. The printed version contains only a sample. Col. (1) Star ID is omitted for space. Cols. (2)–(24) are the same as in Table 2. Cols. (25)–(27): Amplitude of variability at each wavelength measured by the standard deviation about the mean magnitude.
| Star Type | 3.6 m | 4.5 m | 8.0 m | Total |
|---|---|---|---|---|
| All Stars | 37,699 | 37,773 | 5,537 | 39,639 |
| M33 Stars | 29,633 | 29,795 | 4,739 | 32,646 |
| Variable Stars | 1,802 | 2,181 | 615 | 3,047 |
Note. — M33 stars calculated by subtracting the number of foreground stars from all stars in the catalog. This is an over- subtraction as the reference fields used to analyze the field contamination still contain M33 stars. Numbers refer to the area outside the high surface brightness regions ( deg2.)
| Class of Star | [3.6] - [4.5] | [3.6] - [8.0] | ||
|---|---|---|---|---|
| Oxygen-rich AGB Star | 0.2 | |||
| Carbon Star | 0.2 | |||
| Dust Shell | 0.5 | |||
| No Dust | ||||
| YSO | 3.5 |