MICS Asia Phase II –
Sensitivity to the aerosol module
Abstract
In the framework of the model inter-comparison study - Asia Phase II (MICS2), where eight models are compared over East Asia, this paper studies the influence of different parameterizations used in the aerosol module on the aerosol concentrations of sulfate and nitrate in PM10.
An intracomparison of aerosol concentrations is done for March 2001 using different configurations of the aerosol module of one of the model used for the intercomparison. Single modifications of a reference setup for model configurations are performed and compared to a reference case. These modifications concern the size distribution, i.e. the number of sections, and physical processes, i.e. coagulation, condensation/evaporation, cloud chemistry, heterogeneous reactions and sea-salt emissions.
Comparing monthly averaged concentrations at different stations, the importance of each parameterization is first assessed. It is found that sulfate concentrations are little sensitive to sea-salt emissions and to whether condensation is computed dynamically or by assuming thermodynamic equilibrium. Nitrate concentrations are little sensitive to cloud chemistry. However, a very high sensitivity to heterogeneous reactions is observed.
Thereafter, the variability of the aerosol concentrations to the use of different chemistry transport models (CTMs) and the variability to the use of different parameterizations in the aerosol module are compared. For sulfate, the variability to the use of different parameterizations in the aerosol module is lower than the variability to the use of different CTMs. However, for nitrate, for monthly averaged concentrations averaged over four stations, these two variabilities have the same order of magnitude.
keywords:
aerosol , variability , chemistry transport model , size distribution , coagulation , condensation , cloud chemistry , heterogeneous reactions , sea-salt emissions1 Introduction
The model inter-comparison study - Asia Phase II (MICS2), which follows the MICS Phase I (Carmichael et al., 2002), aims at comparing transport and deposition of sulfur, nitrogen compounds, ozone and aerosols in East Asia. Eight models (, …, ) are compared for the following four periods: March 2001, July 2001, December 2001 and March 2002.
The eight models employed for the intercomparison use the same emission data, meteorological data, boundary conditions. Note that meteorological data that are different from the standard MICS meteorological file have sometimes been used, and that the size of the domain of study may differ from domain to domain. Apart from input data and the choice of the computational domain, the variability among the models is related to numerical schemes and parameterizations used for transport, diffusion, deposition, scavenging and chemical mechanisms. Moreover, the eight models use different parameterizations in the aerosol module.
This paper aims investigating to which extent the use of different parameterizations in the aerosol module impact the aerosol concentrations of sulfate and nitrate. An intracomparison of aerosol concentrations is done in March 2001 using different configurations of the aerosol module of one of the model used for the intercomparison. The intracomparison is done using the model , i.e. Polair3D (Boutahar et al. (2004), Fahey et al. (2005) , Tombette et al. (2005), Sartelet and Hayami (2004)), that has been designed for such multi-configuration works (see for instance Mallet and Sportisse (2006)). Informations about the domain of study and input data may be found in Carmichael et al. (2007).
Hayami et al. (2007) have focused on the intercomparison for aerosols, more especially on inorganic components: sulfate, ammonium and nitrate in PM10. They show that models’ predictions tend to be closer to observations for sulfate than for nitrate. Sulfate tends to be slightly underestimated in March 2001. Hayami et al. (2007) found that the amount of sulfate is lower for the model than for , and , although these four models have comparable amount of total sulfur. This can probably be explained by the omission of aqueous chemistry in . Although large discrepancies exist between models, especially for nitrate concentrations, total nitrate is consistently underestimated by most models. The nitrate concentrations predicted by are comparable to other models, but the total nitrate (nitrate + ) is slightly lower, which can be due to the omission of heterogeneous reactions. In , most of the total nitrate is in the particulate phase.
This article is organised as follows. First, the different aerosol modules used in the different models that participated to the MICS study are presented with an accent on the aerosol module used in Polair3D. Then, the sensitivity to the aerosol module is studied and compared to the sensitivity to the chemistry transport model for monthly averaged concentrations at EANET (Acid Deposition Monitoring Network in East Asia) stations and at Fukue, a remote site between Japan and China.
2 The aerosol modules
2.1 The different physical processes
In the aerosol module of eulerian models, the size distribution is often modeled using a sectional approach (e.g. Pilinis et al. (2000), Jacobson (1997)) or a modal approach (e.g. Whitby and McMurry (1997), Sartelet et al. (2006)). In the sectional approach, the number of sections varies from study to study, usually from 2 to 15. In the modal approach, typically from 2 to 4 modes are used.
The aerosol composition and distribution are influenced by different physical processes such as condensation/ evaporation, which is thought as one of the major processes influencing aerosol composition, heterogeneous reactions on the surface of particles, coagulation, nucleation, cloud chemistry. Three approaches may be used to model condensation/ evaporation processes (Capaldo et al. (2000), Debry and Sportisse (2006))
-
•
a dynamic approach, i.e. the mass transfer between gas and aerosol phases is explicitly taken into account,
-
•
a full-equilibrium approach, i.e. the dynamic modeling is replaced with an assumption of thermodynamic equilibrium between the gas and aerosol phases,
-
•
an hybrid approach, i.e. full equilibrium is assumed for fine aerosols while the dynamic approach is used for coarse aerosols.
2.2 The aerosol modules in MICS models
The main differences of the different aerosol modules used in the MICS models can be classified as differences in the size distribution, i.e. modal versus size resolved, the number of sections or modes, and differences in physical processes, i.e. coagulation, condensation/evaporation, cloud chemistry, heterogeneous reactions. Although input data, such as boundary conditions and emissions, are common to all models in the MICS study, sea-salt emissions are not given as input data but they are parameterized in some models. These differences are summarized in Table 1.
2.3 Polair3D
The sensitivity study is carried out with the model , i.e. Polair3D (Boutahar et al. (2004)). The aerosol module of Polair3D is fully described in Debry et al. (2006). Aerosols are composed of black carbon, dust, five inorganics (sulfate, nitrate, ammonium, sodium, chloride) and eight organics (Schell et al. (2001)). The number of sections used in the modeling is fixed by the user. The sections’ diameters are log-distributed in the diameter size-range considered, m to m in this study. The bounds of the sections are , , , , , , , , , , m. Brownian coagulation is modeled as described in Debry and Sportisse (2007), and condensation/evaporation as described in Debry and Sportisse (2006) with a moving sectional scheme. The three approaches, the full equilibrium approach, the dynamic approach or the hybrid approach, may be used. For cloud chemistry, the variable size resolved module (VSRM) of Fahey and Pandis (2003) can be switched on or off. Heterogeneous reactions on the surface of particles are modeled following Jacob (2000)
| (R 1) |
| (R 2) |
| (R 3) |
| (R 4) |
They are considered irreversible processes with a first order reaction rate.
The parameterizations of sea-salt emissions and vertical diffusion are preprocessed. Sea-salt emissions are computed with the parameterization of Monahan et al. (1986) generalized to varying relative humidity following Zhang et al. (2005). Vertical diffusion is computed with the parameterization of Troen and Mahrt (1986).
| Size distribution | 16 bins | None | None | 8 bins |
| [0.02; 20m] | [0.5; 90m] | |||
| Thermod. model | SCAPE2 [1] | MARS [2] | None | SCAPE2 [1] |
| Cond./evap. | Dynamic | Full Equil. | None | Full Equil. |
| Coagulation | Yes | No | No | No |
| Heter. reactions | [3] | No | No | No |
| Sea-salt emission | Yes | Yes | No | Yes |
| Size distribution | 4 bins | None | 3 modes | 10 bins |
| [0.1; 10m] | [0.01; 10m] | |||
| Thermod. model | SCAPE2 [1] | [6] | ISORROPIA | ISORROPIA |
| [7] | [7] | |||
| Cond./evap. | Full Equil. | Full Equil. | Full Equil. | Full Equil. |
| Coagulation | Yes | No | Yes | Yes |
| Heter. reactions | [8] | No | [9] | No |
| Cloud chemistry | [4] | [10], [11] | [4] | No |
| Sea-salt emission | Yes | No | No | No |
| Sections | 10 | 3 | 10 | 10 | 10 | 10 | 10 |
|---|---|---|---|---|---|---|---|
| Cond./evap. | Equil. | Equil. | Hybrid | Equil. | Equil. | Equil. | Equil. |
| Coagulation | Yes | Yes | Yes | No | Yes | Yes | Yes |
| Heter. react. | No | No | No | No | Yes | No | No |
| Cloud chem. | No | No | No | No | No | Yes | No |
| Sea-salt em. | No | No | No | No | No | No | Yes |
2.4 The sensitivity study
In this sensitivity study, only the concentrations of sulfate and nitrate are studied. The sensitivity tests concern the size distribution, i.e. the number of sections, and physical processes, i.e. coagulation, condensation/evaporation, cloud chemistry, heterogeneous reactions and sea-salt emissions. Sensitivity to nucleation is not tested because nucleation would involve particles of size between m to m, a size range smaller than the one considered in this study (m to m). The sensitivity to whether condensation/evaporation is treated dynamically or assuming thermodynamic equilibrium is also studied. However, the sensitivity to the thermodynamic model is not tested, although it may not be negligible as shown in Zhang et al. (1999). Heterogeneous reactions as described in Jacob (2000) are coded in Polair3D. Other models used in MICS may however take into account different heterogeneous reactions, or similar ones but with a different reaction rate.
In the default run , ten sections are used, condensation/evaporation processes are modeled with the full equilibrium approach, coagulation is taken into account, cloud chemistry, sea-salt emissions and heterogeneous reactions are ignored. In each of the runs to , one option differs from the run . For example, in the run , only three sections are used. A summary of the different runs is presented in Table 2. In the run , the hybrid approach is used with a cutoff diameter of : the finest 6 sections are computed with the full equilibrium approach, while the dynamic approach is used for the coarsest 4 sections. To show that the aerosol concentrations are not only influenced by the parameterizations in the aerosol module, a run is done with a different parametrization of the vertical diffusion. The sensitivity study of Mallet and Sportisse (2006) shows a great sensitivity to the parametrization of the vertical distribution for ozone. Therefore, the parameterization of Louis is used instead of the parametrization of Troen-Mahrt in the run .
The sensitivity of sulfate and nitrate concentrations to the different options is now assessed by comparing monthly averaged concentrations.
3 Monthly averaged concentrations
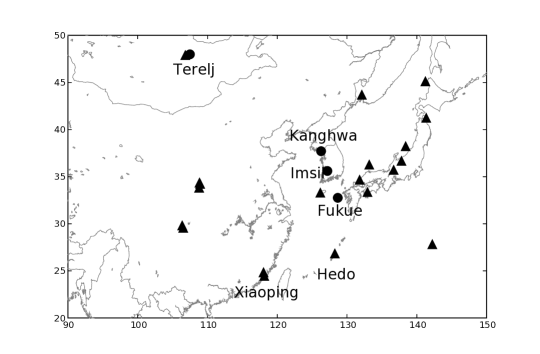
Monthly averaged concentrations of sulfate and nitrate were measured at some of the EANET (Acid Deposition Monitoring Network in East Asia) stations (Hayami et al., 2007). The sensitivity to the aerosol module is assessed by comparing the different runs at 23 EANET stations and at a remote site between Japan and China, Fukue, a station operated by CRIEPI (Hayami et al., 2007). The location of the stations is given in Figure 1. Measurements for aerosols, that are in the computational domain of the eight models, are available at only three of the EANET stations (Terelj –Mongolia, Kanghwa and Imsil –Republic of Korea) and at Fukue.
3.1 Sensitivity to the aerosol module
To quantify the sensitivity of the different aerosol options, the normalized mean absolute error (NMAE) between and () and the normalized mean bias (NMB) are computed for sulfate and nitrate, as follows (Yu et al. (2006))
| (1) |
where is the number of stations (23 EANET stations + Fukue), (, ) represents the concentration of sulfate or nitrate at the station for the run . For each run , the higher the NMAE and NMB are, the more sensitive the results are to the option . A summary can be found in Table 3.
| Sulfate | Nitrate | |||
|---|---|---|---|---|
| NMAE | NMB | NMAE | NMB | |
| 6% | 5% | 15% | 15% | |
| 2% | 2% | 13% | -12% | |
| 11% | -10% | 15% | -15% | |
| 15% | -14% | 99% | 99% | |
| 17% | 17% | 2% | -1% | |
| 3% | 3% | 10% | 10% | |
| 34% | 34% | 71% | 71% | |
As shown in Table 3, sulfate concentrations are little sensitive to options and , ie. to the hybrid option and to sea-salt emissions, with a NMAE under . Sulfate is little sensitive to sea-salt emissions, because sea-salt sulfate is not considered in the sea-salt emissions here. Sea-salt emissions are assumed to be made exclusively of chloride and sodium.
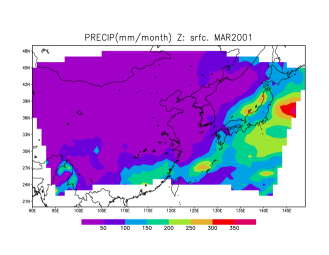
Higher sensitivity of sulfate is observed for options and , i.e. for the size distribution and for coagulation with a NMAE of and respectively. Sulfate concentrations are equally sensitive to options and , i.e. to heterogeneous reactions and cloud chemistry, with a NMAE around -. Although the formation of sulfate is often thought to be dominated by aqueous production (e.g. Seinfeld and Pandis (1998)), the sensitivity of sulfate to cloud chemistry is only here. However, this sensitivity varies strongly with the location of stations. Figure 2 shows the total amount of precipitations for March 2001. Precipitations are low over Mongolia and central China, but high over south China and Japan. Accordingly, the sensitivity of sulfate to cloud chemistry is only at Terelj in Mongolia (see Figure 1), whereas it is as high as and in Xiaoping and Hedo. Note that higher sensitivity to cloud chemistry would have been observed in July, when precipations are higher than in March.
NMAE tends to be higher for nitrate than for sulfate concentrations, except for the option 6, i.e. for cloud chemistry. Nitrate is more sensitive to the options of the aerosol module than sulfate, explaining the larger discrepancies observed between the models , …, for nitrate than for sulfate. The effects of the size distribution, the hybrid scheme and sea-salt emissions are stronger on nitrate than sulfate because they alter thermodynamic equilibrium. Sulfate is less affected because of its low volatility.
For nitrate, the highest sensitivity is observed for option , i.e. heterogeneous reactions, with a NMAE as high as . Only cloud chemistry (option ) does not significantly modify nitrate concentrations. The effects of the size distribution, the hybrid scheme, coagulation and sea-salt emissions (options , , and ) are of similar strength in terms of NMAE with a NMAE around -.
The positive NMB of the run for sulfate illustrates that the concentration of sulfate increases due to cloud chemistry as expected by the oxidation of dissolved into sulfate.
Nitrate concentrations increase by heterogeneous reactions as shown by the high positive NMB of for the run , whereas sulfate concentrations decrease although the NMB is not as high in absolute value as for nitrate. As deduced from the set of reactions R 1, R 2, R 3 and R 4, heterogeneous reactions lead to higher and concentrations and to lower concentrations. Higher concentrations in would increase sulfate concentrations in the real atmosphere. However, this does not occur in the model runs because excludes aqueous chemistry. A more detailed comparison of the runs and shows that monthly averaged and concentrations are also lower when heterogeneous reactions are taken into account. Because of lower concentrations, oxidation of by is lower resulting in lower sulfate concentrations. Lower sulfate may in turn lead to higher nitrate, which is then required to neutralize ammonia. Higher nitrate concentrations may also be a consequence of the higher concentrations that condense on particles to form ammonium-nitrate.
Coagulation is more efficient for small particles, limiting their concentrations. Figure 3 shows the size distribution of sulfate and nitrate monthly averaged concentrations, averaged over all stations. When coagulation is not taken into account, the distribution is centered at smaller diameters than when coagulation is taken into account.


For both sulfate and nitrate, a high sensitivity to the parameterization of the vertical diffusion (run ) is observed. For sulfate, this sensitivity is much higher than the sensitivity to any of the options tested in the aerosol module. For nitrate, this sensitivity is very high as well, although not as high as the sensitivity to heterogeneous reactions.
3.2 Comparison to the sensitivity to the chemistry transport model
To compare the sensitivity to the aerosol module to the sensitivity to the chemistry transport model, the NMAE is computed for stations where measurements are available (Terelj, Kanghwa, Imsil, Fukue) as follows
| (2) |
where is the number of stations where measurements are available, () is the concentration of sulfate or nitrate at station . Table 4 shows the mean NMAE for runs to as well as the smallest (Min) and largest (Max) value of NMAE obtained for these runs. These values Min, Max and mean of NMAE are computed not only for runs to but also for models to , in order to compare the sensitivity of the aerosol module (runs to ) to the sensitivity of the chemistry transport model (models to ). For sulfate, all eight models are included when computing the mean NMAE. For nitrate, the model is not included because it did not provide results. Furthermore, because the NMAE observed with the model is one order of magnitude higher than other models for nitrate, results with and without taking into account are presented.
| Sulfate | Nitrate | |||||
|---|---|---|---|---|---|---|
| Min | Mean | Max | Min | Mean | Max | |
| 12% | 13% | 14% | 20% | 34% | 85% | |
| 10% | 14% | 18% | 13% | 57% | 188% | |
| (no ) | – | – | — | 13% | 35% | 69% |
Values of NMAE are higher for nitrate than sulfate, confirming again the higher sensitivity of nitrate.
For sulfate, variability is larger for models to than for runs to . The NMAE varies by only for runs to whereas it varies by as much as for models to . For nitrate, the NMAE varies by for runs to whereas it varies by as much as for models to . However, without taking into account the model for nitrate, the NMAE varies by for models to , that is the variations are of the same order of magnitude as those of runs to . In other words, for nitrate, the variability within the aerosol module ( to ) is as large as the variability between models ( to ).
Apart from the uncertainty in aerosol parameterizations, the variability among models to is linked to numerical schemes and parameterizations used for transport, diffusion, deposition, scavenging, chemical mechanism, choice of computational domain and input data. Although input data are the same for all models for emission and boundary conditions, meteorological data that are different from the standard MICS meteorological file have sometimes been used. For example, a difference in the relative humidity field used by models as high as has been observed (Hozumi et al., 2005). Such variability in relative humidity contributes to variability in aerosol concentrations.
Variability linked to numerical schemes and parameterizations outside the aerosol module is important especially for sulfate for which the variability to parameterizations in the aerosol module is not so high. For example, the sensitivity to the parameterization of the vertical diffusion has shown to be higher than the sensitivity to any options of the aerosol module for sulfate.
Because only uncertainties in aerosol parameterizations are considered for the runs to , uncertainties observed for models to should be larger. This is true for sulfate. However, for nitrate, if the results of the model are not considered, the NMAE varies as much for models to as for runs to . This strong variability of nitrate to the aerosol module stresses the difficulties in modeling nitrate concentrations accurately.
4 Conclusion
For March 2001, the sensitivity to the aerosol module of the model , Polair3D, is assessed and compared to the sensitivity to the chemistry transport model. Because in the MICS comparison, all models are assumed to use the same input data, the variability between the different models is due to differences in physical parameterizations, differences in numerical schemes and differences in the chemical mechanism. Concerning the sensitivity to the aerosol module, only the sensitivity to the size distribution (number of sections) and the sensitivity to physical parameterizations (coagulation, whether condensation is solved assuming full equilibrium or using an hybrid scheme, cloud chemistry, heterogeneous reactions, and sea-salt emissions) are considered. However, there is also a sensitivity to numerical algorithms for simulation of condensation/evaporation for example as shown by Zhang et al. (2004).
To assess the sensitivity to the aerosol module and to the chemistry transport model, monthly averaged concentrations over 24 stations are computed. Sulfate concentrations are little sensitive to the hybrid scheme and to sea-salt emissions, with a normalized mean absolute error () and a normalized mean bias under . Nitrate concentrations are little sensitive to cloud chemistry. For sulfate, the sensitivity to cloud chemistry is important although not dominant with a NMAE of about . For sulfate and especially for nitrate, high sensitivity to heterogeneous reactions is observed. For nitrate the sensitivity to heterogeneous reactions is particularly high, with a NMAE as high as for monthly averaged concentrations.
To compare the sensitivity to the chemistry transport model to the sensitivity to the aerosol module, the minimum, the mean and the maximum of the NMAE are computed for , i.e. for runs associated to sensitivity tests on the aerosol module, and for , i.e. for models participating in the MICS comparison. The values of NMAE are higher for nitrate than sulfate, confirming the higher sensitivity of nitrate. For monthly averaged concentrations at all EANET stations for nitrate, the variations of the NMAE for are of the same order as the variations for , suggesting a very high sensitivity to the aerosol module. For sulfate, the variations of the NMAE for are much smaller than the variations of the NMAE for ( against ), suggesting that the sensitivity to the aerosol module is less strong than the sensitivity to the chemistry transport model. However, if , i.e. the sensitivity to the parameterization of the vertical diffusion, is added in the computation of the variations of the NMAE for , then the variations of the NMAE for are almost of the same order as the variations for ( against ).
The high variability observed for nitrate stresses the difficulties in modeling nitrate concentrations accurately. Because nitrate concentrations are highly sensitive to heterogeneous reactions, better knowledge of reaction probabilities for example, some of which may be expressed as a function of aerosol composition, temperature and relative humidity (e.g. Evans and Jacob (2005) for R 4), may help to improve the models accuracy.
5 Acknowledgements
The authors are very thankfull to C. Bennet, G.R. Carmichael, M. Engardt, C. Fung, Z. Han, M. Kajino, U. Park, T. Sakurai, N. Thongboonchoo, H. Ueda for providing the data for the different models, the EANET monitoring data and for very valuable discussions. We would also like to thank T. Holloway for providing boundary counditions, and A. Kannari for emissions.
References
- Berge (1993) Berge, E., 1993. Coupling of wet scavenging of sulphur to clouds in a numerical weather prediction model. Tellus 45B, 1–22.
- Boutahar et al. (2004) Boutahar, J., Lacour, S., Mallet, V., Qu lo, D., Roustan, Y., Sportisse, B., 2004. Development and validation of a fully modular platform for numerical modelling of air pollution: Polair3D. International Journal of Environmental Pollution 22 (1-2).
- Capaldo et al. (2000) Capaldo, K., Pilinis, C., Pandis, S., 2000. A computationally efficient hybrid approach for dynamic gas/aerosol transfer in air quality models. Atmospheric Environment 34, 3617–3627.
- Carmichael et al. (2002) Carmichael, G., Calori, G., Hayami, H., Uno, I., Cho, S., Engardt, M., Kim, S.-B., Ichikawa, Y., Ikeda, Y., Woo, J.-H., Ueda, H., Amann, M., 2002. The mics-asia study: model intercomparison of long-range transport and sulfur deposition in east asia. Atmospheric Environment 36, 175–199.
- Carmichael et al. (2007) Carmichael, G., Sakurai, T., Streets, D., Hozumi, H., Ueda, H., Park, S., Fung, C., Han, Z., Kajino, M., Engardt, M., Bennet, C., Hayami, H., Sartelet, K., Holloway, T., Wang, Z., Kannari, A., Fu, J., Matsuda, M., Thongboonchoo, N., Amann, M., 2007. MICS-Asia Phase II the model intercomparison study for asia phase ii, methodology and overview of findings. Atmospheric Environment Submitted.
- Chameides and Davis (1982) Chameides, W., Davis, D., 1982. The free radical chemistry of cloud droplets and its impact upon the composition of rain. Journal of Geophysical Research 87 (C7), 4863–4877.
- Debry et al. (2006) Debry, E., Fahey, K., Sartelet, K., Sportisse, B., Tombette, M., 2006. A new SIze REsolved Aerosol Model: SIREAM. Atmos. Chem. Phys. Discuss. 6, 11,845–11,875.
- Debry and Sportisse (2006) Debry, E., Sportisse, B., 2006. Reduction of the condensation/evaporation dynamics for atmospheric aerosols: theoretical and numerical investigation of hybrid methods. Journal of Aerosol Science 37 (8), 950–966.
- Debry and Sportisse (2007) Debry, E., Sportisse, B., 2007. Solving aerosol coagulation with size-binning methods. Applied Numerical Mathematics In press.
- Evans and Jacob (2005) Evans, M., Jacob, D., 2005. Impact of new laboratory studies of n2o5 hydrolysis on global model budgets of tropospheric nitrogen oxides, ozone, and oh. Geophysical Research Letters 32, L09813, doi:10.1029/2005GL022469.
- Fahey et al. (2005) Fahey, K., Debry, E., Foudhil, H., Sportisse, B., 2005. Formulation, development and preliminary validation of the SIze REsolved Aerosol Model, SIREAM. In: Proceedings GLOREAM 2004.
- Fahey and Pandis (2003) Fahey, K., Pandis, S., 2003. Size-resolved aqueous-phase chemistry in a three-dimensional chemical transport model. Journal of Geophysical Research 108, 4690.
- Hayami et al. (2007) Hayami, H., Sakurai, T., Han, Z., Ueda, H., Carmichael, G., Streets, D., Holloway, T., Wang, Z., Thongboonchoo, N., Engardt, M., Bennet, C., Fung, C., Chang, A., Park, S., Kajino, M., Sartelet, K., Matsuda, K., Amann, M., 2007. Model intercomparison study of chemical transport models for east asia (mics-asia): Particulate sulfate, nitrate and ammonium. Atmospheric Environment Submitted.
- Heikes and Thompson (1983) Heikes, B., Thompson, A., 1983. Effects of heterogeneous processes on no3, hono and hno3 chemistry in the troposphere. Journal of Geophysical Research 88 (C5), 10,883–10,895.
- Hov and B.A. (1994) Hov, O., B.A., H., 1994. Transport distance of ammonia and ammonium in northern europe. 1. model description. Journal of Geophysical Research 99 (D9), 18,735–18,748.
- Hozumi et al. (2005) Hozumi, Y., Ueda, H., Sakurai, T., Matsuda, K., Hayami, H., 2005. Mics-asia: Comparison study on meteorological fields on the mics-asia. In: Proceedings of the 46th Annual Meeting of Japan Society for Atmospheric Environmnent. p. 586.
- Jacob (2000) Jacob, D., 2000. Heterogeneous chemistry and tropospheric ozone. Atmospheric Environment 34, 2131–2159.
- Jacobson (1997) Jacobson, M., 1997. Development and application of a new air pollution modeling system - part iii . aerosol-phase simulations. Atmospheric Environment 31 (4), 587–608.
- Mallet and Sportisse (2006) Mallet, V., Sportisse, B., 2006. Uncertainty in a chemistry-transport model due to physical parameterizations and numerical approximations: An ensemble approach applied to ozone modeling. Journal of Geophysical Research 111 (D01302), doi:10.1029/2005JD006149.
- Meng et al. (1995) Meng, Z., Seinfeld, J., Saxena, P., Kim, Y., 1995. Atmospheric gas-aerosol equilibrium, iv: thermodynamics of carbonates. Aerosol Science and Technology 23, 131–154.
- Monahan et al. (1986) Monahan, E., D.E., S., K.L., D., 1986. A model of marine aerosol generation via whitecaps and wave disruption. In: Oceanic whitecaps. D. Reidel, pp. 167–174.
- Mozurkewich (1993) Mozurkewich, M., 1993. The dissociation constant of ammonium nitrate and its dependence on temperature, relative humidity and particle size. Atmospheric Environment 27A, 261–270.
- Nenes et al. (1998) Nenes, A., Pandis, S., Pilinis, C., 1998. Isorropia : A new thermodynamic equilibrium model for multicomponent inorganic aerosols. Aquatic geochemistry 4, 123–152.
- Pilinis et al. (2000) Pilinis, C., Capaldo, K., Nenes, A., Pandis, S., 2000. Madm - a new multi-component aerosol dynamic model. Aerosol Science and Technology 32, 482–502.
- Riemer et al. (2003) Riemer, N., Vogel, H., Vogel, B., Schell, B., Ackermann, I., Kessler, C., Hass, H., 2003. Impact of the heterogeneous hydrolysis of n2o5 on chemistry of nitrate aerosol formation in the lower troposphere under photosmog conditions. Journal of Geophysical Research 108 (D4-4144), doi:10.1029/2002JD002436.
- Sartelet and Hayami (2004) Sartelet, K., Hayami, H., 2004. Application of the 3d ctm polair to air quality over greater tokyo. In: Proceedings of the 45th annual meeting of Japan Society for Atmospheric Environmnent. p. 529.
- Sartelet et al. (2006) Sartelet, K., Hayami, H., Albriet, B., Sportisse, B., 2006. Development and preliminary validation of a modal aerosol model for tropospheric chemistry: Mam. Aerosol Science and Technology 40 (2), 118–127, doi: 10.1080/02786820500485948.
- Saxena et al. (1986) Saxena, P., Hudischewskyj, A., Seigneur, C., Seinfeld, J., 1986. A comparative study of equilibrium approaches to the chemical characterization of secondary aerosols. Atmospheric Environment 20, 1471–1483.
- Schell et al. (2001) Schell, B., Ackermann, I., Hass, H., Binkowski, F., Ebel, A., November 2001. Modeling the formation of secondary organic aerosol within a comprehensive air quality model system. Journal of Geophysical Research 106 (D22), 28275–28293.
- Seinfeld and Pandis (1998) Seinfeld, J., Pandis, S., 1998. Atmospheric chemistry and Physics. Wiley-interscience.
- Tang et al. (2004) Tang, Y., Carmichael, G., Seinfeld, J., Dabdub, D., Weber, R., Huebert, B., Clarke, A., Guazzotti, S., Sodeman, D., Prather, K., Uno, I., Woo, J.-H., Yienger, J., Streets, D., Quinn, P., Johnson, J., Song, C.-H., Grassian, V., Sandu, A., Talbot, R., Dibb, J., 2004. Three-dimensional simulations of inorganic aerosol distributions in est asia during spring 2001. Journal of Geophysical Research 109 (D19S23), doi:10.1029/2003JD004201.
- Tombette et al. (2005) Tombette, M., Fahey, K., Sartelet, K., Sportisse, B., 2005. Aerosol modelling at regional scale: a sensitivity study with the Polyphemus platform. In: Proceedings of GLOREAM 2005.
- Troen and Mahrt (1986) Troen, I., Mahrt, L., 1986. A simple model of the atmospheric boundary layer: sensitivity to surface evaporation. Boundary-Layer Meteorology 37, 129–148.
- Walcek and Taylor (1986) Walcek, C., Taylor, G., 1986. A theoretical method for computing vertical distributions of acidity and sulfate production within cumulus clouds. Journal of Atmospheric Science 43, 339–355.
- Whitby and McMurry (1997) Whitby, E., McMurry, P., 1997. Modal aerosol dynamics modeling. Aerosol Science and Technology 27, 673–688.
- Yu et al. (2006) Yu, S., Eder, B., Dennis, R., Chu, S.-H., Schwartz, S., 2006. New unbiased symmetric metrics for evaluation of air quality models. Atmos. Sci. Let. 7, 26–34.
- Zhang et al. (2005) Zhang, M. K., Knipping, E., Wexler, A., Bhave, P., Tonnesen, G., 2005. Size distribution of sea-salt emissions as a function of relative humidity. Atmospheric Environment 39, 3373–3379.
- Zhang et al. (2004) Zhang, Y., Pun, B., Vijayaraghavan, K., Wu, S.-Y., Seigneur, C., Pandis, S., Jacobson, M., Nenes, A., J.H., S., 2004. Development and application of the model of aerosol dynamics, reaction, ionization, and dissolution (madrid). Journal of Geophysical Research 109 (doi:10.1029/2003JD003501).
- Zhang et al. (1999) Zhang, Y., Seigneur, C., Seinfeld, J., Jacobson, M., Binkowski, F., 1999. Simulation of aerosol dynamic: A comparative review of algorithms used in air quality models. Aerosol Science and Technology 31, 487–514.