Very High Energy -ray and Near Infrared observations of 1ES2344+514 during 2004-05
Abstract
We have observed the BL Lac object 1ES2344+514 (z = 0.044) in Very High Energy (VHE) gamma-ray and near-infrared wavelength bands with TACTIC and MIRO telescopes respectively. The observations were made from 18th October to 9th December 2004 and 27th October 2005 to 1st January 2006. Detailed analysis of the TACTIC data indicates absence of a statistically significant gamma-ray signal both in overall data and on a nightly basis from the source direction. We estimate an upper limit of I(1.5 TeV) photons cm-2 s-1 at a 3 confidence level on the integrated -ray flux. In addition, we have also compared TACTIC TeV light curves with those of the RXTE ASM (2-12keV) for the contemporary period and find that there are no statistically significant increases in the signal strengths from the source in both these energy regions. During 2004 IR observations, 1ES2344+514 shows low level ( 0.06 magnitude) day-to-day variation in both, J & H bands. However, during 2005 observation epoch, the source brightens up by about 0.41 magnitude from its October 2005 level J magnitude = 12.64 to J = 12.23 on December 6, 2005. It then fades by about 0.2 magnitude during 6 to 10 December, 2005. The variation is seen in both, J & H, bands simultaneously. The light travel time arguments suggest that the emission region size is of the order of cms.
1 Introduction
Very High Energy blazars belong to the the class of objects referred to as radio-loud Active Galactic Nuclei (AGN) and are characterised by non-thermal continuum spectrum, optical polarisation, flat radio spectrum and strong variability in all frequency bands. Their broad band Spectral Energy Distribution (SED) which extends from radio up to the TeV range, consists typically of two broad peaks [7, 40, 41]. The low energy one peaks in the 0.1 - 100 keV domain and is commonly attributed to synchrotron emission from ultra-relativistic leptons in the jet. The second component which is, relative to the synchrotron emission, at high frequency is considered to be due to the Inverse Compton (IC) scattering by the leptons of either synchrotron photons (Synchrotron-Self-Compton process SSC) [12, 30, 33, 38], or External Compton (EC)[10, 18, 19, 20, 24, 37, 42]. Alternative processes which are generally considered responsible for the second peak are ‘hadronic’ processes, which include interactions of a highly-relativistic jet outflow with ambient matter [6, 17], proton-induced cascades [32] and synchrotron radiation due to protons [2, 35]. Emission of TeV photons provides evidence for the presence of particles at roughly the same energy if we assume IC radiation in the Klein-Nishina regime [13]. Therefore, it requires an extremely efficient particle acceleration mechanism at work in the close environment of the super massive black hole which forms the central engine of the AGN.
1ES2344+514 or QSO B2344+514 is a BL Lac type object (z 0.044, l,b 112.89∘, -9.91∘) which has been the target of many studies. In the VHE -ray window, it was discovered by the Whipple Collaboration in 1995 [14], wherein the evidence for emission came mostly from an apparent flare on December 20, 1995 and was subsequently confirmed independently by the HEGRA Collaboration [39]. TeV spectra derived by the Whipple group during the flaring state of the source in 1995 [36] are steeper than for the brightest flare of Mrk421 and Mrk501, both located at about 66 distance of 1ES2344+514. The MAGIC collaboration have reported VHE -ray signal in the energy range 140 GeV - 5.4 TeV during the period August 3, 2005 - January 1, 2006 and found that the source was in a low state [3]. The differential spectra obtained by them shows a steeper photon spectrum and six times lower flux level as compared to the 1995 flaring state. At X-ray energies (0.2-4 keV) it was detected by the Einstein Slew Survey [23]. The source has also shown a rapid x-ray variability feature on a time scale of few hours during a week-long campaign in December 1996 using BeppoSAX satellite in the 0.1 - 10 keV energy band when the source was in a high state [25]. In addition, a large decrease of 0.35 magnitude had been observed in the V band during 3-17 January 2001 [45] indicating an optical variability.
TeV Blazars are now known to undergo flaring episodes both at x-ray and TeV -ray energies and the emissions are generally correlated albeit the correlation appears to be fairly loose [11]. By following the spectral evolution it is possible to test the models that predict simultaneous flux changes in different parts of the spectrum, such as in the SSC model, where the x-ray and TeV regions are expected to show correlated variations. Further, these objects are characterised by variability features including short, medium and long terms variations and the cross correlation of such features in different wavelength bands may yield new physics of these most violent objects. A strong correlation between GeV -ray and near infrared luminosities has been reported earlier[44] and it has been suggested that it may be a common property of blazars.
In this communication, we present TeV and near infrared results on 1ES2344+514 obtained during our 2004-05 observations with TACTIC (TeV Atmospheric Cherenkov Telescope with Imaging Camera) gamma-ray and MIRO (Mount Abu Infrared Observatory) telescopes respectively. In addition, RXTE ASM[4] x-ray data (2 - 12keV) of the contemporary period have also been used to study the source behaviour in three energy regimes. In the following sections we describe the results of these observations, including the data analysis procedure and follow it up by a discussion and the main conclusions drawn from this study.
2 TeV Observations
| Year | Month | Observation | Total Obs. | Selected Obs. |
|---|---|---|---|---|
| Dates | Time (hrs) | Time (hrs) | ||
| 2004 | Oct. | 18-19 | 3.21 | 3.21 |
| 2004 | Nov. | 3-5, 7-10, 15 | 24.79 | 11.72 |
| 2004 | Dec. | 2-6, 8, 9 | 19.14 | 15.45 |
| 2005 | Oct. | 27-29 | 9.08 | 9.08 |
| 2005 | Nov. | 3, 20-22, 24-30 | 19.41 | 9.86 |
| 2005 | Dec. | 1-5, 20-21, 24-30 | 15.06 | 12.52 |
2.1 Experimental Setup
TACTIC gamma-ray telescope is located at Mt. Abu (24.6∘ N, 72.7∘ E, 1300 m asl), a hill resort in Western India. It uses a tessellated light-collector of 9.5 area which is configured as a quasi-parabolic surface, yielding a measured spot-size of 0.3∘ for on-axis parallel rays.
| Year | Month | Observation | Total Obs. | Selected Obs. |
|---|---|---|---|---|
| Dates | Time (hrs) | Time (hrs) | ||
| 2004 | Dec. | 4-6, 8-9 | 10.92 | 10.92 |
| 2005 | Dec. | 21-22, 24, 27-30 | 8.84 | 8.84 |
| 2006 | Jan. | 1 | 0.52 | 0.52 |
The PC-controlled 2-axes drive system of the telescope ensures a pointing / tracking accuracy of better than 3 arc-mins. The pixel resolution of the imaging camera is 0.31∘ throughout the camera FoV of 6∘ 6∘. We have used the inner 225 pixels (15 15 matrix) of the camera for the present studies. The event-trigger generation is based on the 3NCT (Nearest Neighbour Non-Collinear Triplets) logic for the 2004 observations and NNP ( Nearest Neighbour Pair) logic for the 2005-06 observations, demanding 8 photoelectrons and 25 photoelectrons for the Triplet and Pair pixels respectively, which participate in the trigger-generation. Whenever the single’s rate of one or more pixels goes outside the preset operational band, it is automatically restored to within the prescribed range by appropriately adjusting the pixel(s) high voltage(s). The resulting change in the pixel(s) gain is monitored by repeatedly flashing a bright LED lamp, improvised to produce a homogeneous light intensity over the entire camera [8]. From the logged digital counts (dc), the relative gains of all the pixels are derived with respect to 4 ’calibration’ pixels for which the high voltage is always kept fixed. In addition, these pixels, which are located on the 4 edges of the camera are provided with -embedded scintillator based optical flashers for on-line absolute calibration. The relative calibration and the sky pedestal data of the camera pixels are recorded several times in the course of observations for Cherenkov image-cleaning and calibration purposes. The absolute occurrence time of each individual event is recorded with a resolution of 1s and an accuracy of a few s, using GPS provided reference time-markers for synchronisation of the local observatory clock. The telescope is sensitive to -rays with energies between approximately 1.5 TeV to 20 TeV and can detect the Crab Nebula at 5 significance level in 25 hours of on- source observation [9].
2.2 Observations and Data Analysis
Observations on 1ES2344+514 were taken during October 18 to December 9, 2004 and October 27, 2005 to January 1, 2006, hereafter referred to as spell 1 and spell 2 respectively, during cloudless and moonless nights. Total duration of actual observations on the source is 91.2 hours in a zenith angle range of about 27 to 45 degrees. Several standard data quality checks have been used to evaluate the overall system behaviour and the general quality of the recorded data. These include conformity of the prompt coincidence rates with the expected zenith angle dependence, compatibility of the arrival times of prompt coincidence events with Poissonian statistics and the behaviour of the chance coincidence rate with time. After applying these data quality checks we have selected good quality data sets of 60.15 hours as per the details given in Table 1. In order to maximise the on-source observation time, we have used tracking observation method[29], for recording both the on and off-source data, wherein background measurements are made from the candidate gamma-ray source direction itself, thus eliminating the need for a dedicated off-source observation run corresponding to each on-source run and ensuring that data are taken under identical atmospheric conditions. However, independent off-source data have also been collected for about 20.32 hours, details of which have been given in Table 2, to eliminate the possibility of significant systematic errors in the instrumentation and data analysis procedure. Accordingly, off -source data sets were also subjected to the same data quality checks as were applied to the on-source data sets.
| Parameters | Cut Values |
|---|---|
| Length | 0.11∘ L(0.155 + 0.0260*log(size))∘ |
| Width | 0.06∘ W (0.080 + 0.01250*log(size))∘ |
| Distance | 0.4∘ D 1.3∘ |
| Size | S 450 dc counts (6.5 digital counts =1.0 pe) |
| Alpha | 18∘ |
Detailed analysis of imaging atmospheric Cherenkov telescope data involves a number of steps including filtering of the light of night sky background, accounting for the differences in the relative gains of the PMTs, finding Cherenkov image boundaries, image parameterization, event classification, energy and direction determination etc. In the first step the pedestal mean value of a Charge to Digital Converter (CDC), which we estimate by artificially triggering the camera 2000 times, is subtracted from the CDC counts of each pixel of the camera. In the second step, the relative gain calibration related data is obtained by recording 2000 images triggered by an artificial pulsed light source (LED) in front of the camera surface. A light-diffusing medium in front of the pulsed light source has also been used to ensure uniformity of the photon field across the camera surface. The refined calibration data are then used to determine the relative gains of each pixel by comparing their mean signals with respect to a reference pixel. In the next step, a picture threshold of 6.5 , boundary threshold of 3 and an isolated picture threshold of 10 have been used to select maximum number of PMTs with signal and boundaries of the event image, while limiting the inclusion of pixels with noise alone. After performing flat fielding and image cleaning the next step in the data analysis is the image parameterisation and event selection.
Characterisation of the Cherenkov images formed at the focal plane is done using the moment analysis of Hillas [28] and various image parameters, viz., Length (L), Width (W), Distance (D), Alpha () and Size (S) are calculated for all the cleaned images. Based on the dynamic supercuts methodology [34] and CORSIKA-based simulation studies of the TACTIC [31], -ray-like events are preferentially picked from the overall data-base of the source by appropriately changing the permitted L, W and D ranges as a function of S. The imaging cuts used in the analysis are listed in Table 3.

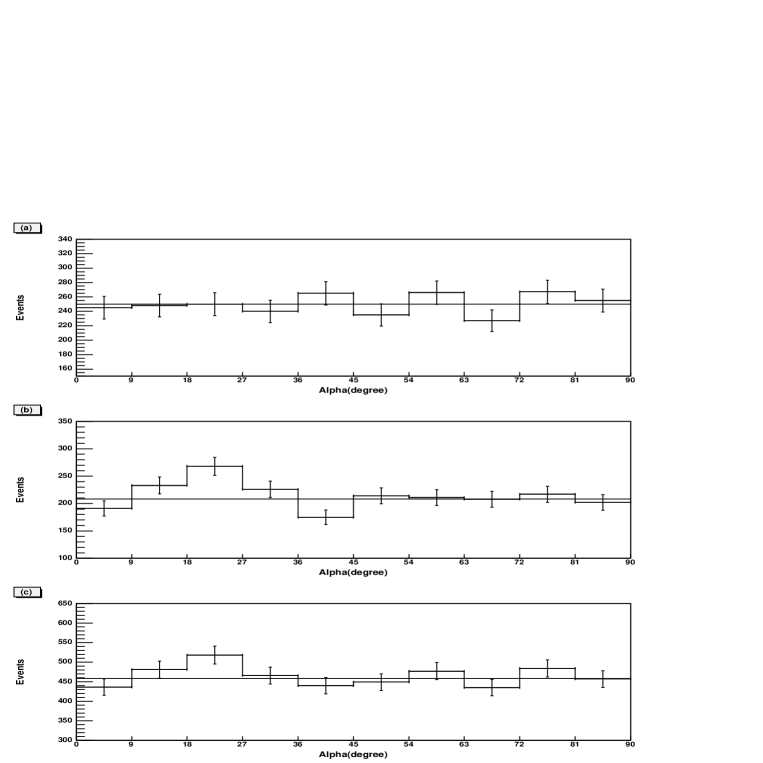
Under ideal conditions the alpha distribution is expected to be flat in the absence of a gamma-ray signal from the source direction. From the TACTIC simulation studies and recent observations of the Crab Nebula and Mrk421 in flaring state [46], we find that a TeV gamma-ray emitting source shows an excess of events in the alpha range of 0∘ - 18∘ and the distribution is reasonably flat in the alpha range of 27∘ - 81∘. This flat distribution has been used for determining the background level required for estimating the on-source excess of events as is discussed in [46].
2.3 Results of TeV Observations
In Figure 1, we show the derived alpha distributions after applying imaging cuts as are given in Table 3, for (a) spell 1 (b) spell 2 and (c) spell 1 and spell 2 together. It is clear that all the alpha plots are consistent with flat distribution. None of the distributions of Figure 1 shows an excess of events in the expected signal region of the alpha plot which is from 0∘ -18∘ [46] as has been mentioned earlier. Hence we do not find any evidence for a statistically significant TeV -ray signal from the source direction during the two epochs of TACTIC observations of 1ES2344+514. Excess or deficit obtained during spell 1 and 2 observations are -28.0 38.5 and 73.6 42.8 respectively, which are not statistically significant. Accordingly we have derived an upper-limit on the TeV gamma-ray flux at a 3 confidence level, of 5.08 photons cm-2 s-1 and 5.77 photons cm-2 s-1 for spell 1 and 2 respectively, using the method of Helene [27]. The upper-limit on the integrated -ray flux from the source direction above 1.5 TeV, estimated using the data of spell 1 and 2 together ( excess 45.6 47.5) is photons cm-2 s-1 at the 3 confidence level. We have also carried out off -source data analysis using the same procedure and the corresponding alpha plots are shown in Figure 2 (a) spell 1 (b) spell 2 and (c) both spells taken together, after applying various imaging cuts, as are given in Table 3. These plots are also consistent with the expected distribution of the alpha parameter in the absence of a gamma-ray signal. In order to compare the TACTIC upperlimit with the MAGIC group 2005 detection of the source, we have calculated integral gamma-ray flux F(1.5 TeV ) = photons cm-2 s-1 using their differential energy spectrum given in [3, 43], which is clearly much lower than the upperlimit obtained in this work. Therefore, the TACTIC upperlimit is in agreement with the MAGIC group detection in 2005.

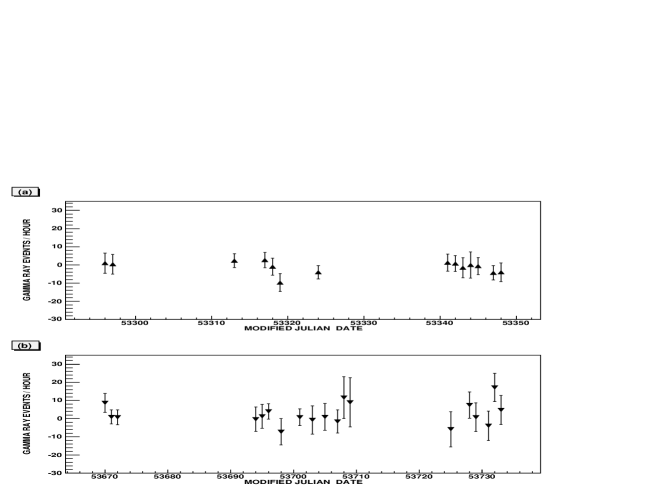
As mentioned earlier, the TeV blazars show a high flux- variability on time scales ranging from months to less than an hour. Interestingly, in the Whipple discovery paper on the source [14], a flare of VHE gamma-ray emission (above 350 GeV) was detected on 20th Dec. 1995 during which a 6 excess was reported. In this work, we have also searched for possible strong TeV flaring episodes during the epochs of our observations and accordingly divided the data on nightly basis and repeated the analysis using the same methodology as mentioned earlier. Figures 3 a and b show the day-to-day variations of the -ray rate (-rays/hour) for spell 1 and spell 2 observations respectively. These two light curves are characterised with reduced values of 0.42 and 0.75 respectively. The magnitude of an excess or deficit recorded on different nights is within 2 level and hence indicates the absence of statistically significant variable TeV gamma-ray signal during the period of TACTIC observations. These results suggest that the source 1ES2344+514 was possibly in a quiescent state in the VHE gamma-ray range during the two periods of TACTIC observations.
We have also shown for comparison in Figure 4, the corresponding light curve, of the source in the x-ray energy range of 2-12 keV using the RXTE ASM one day average sum band intensity data [4]. These two light curves for the period of spell 1 (Fig. 4a) and spell 2 (Fig. 4b) are characterised by reduced values of 1.66 and 1.51 with respect to the average count levels of 0.120.03 and 0.110.04 respectively. In addition, we have also obtained the above said ASM light curves corresponding to the following three epochs: (1) Oct. -Dec. 1997, (2) Aug.- Nov. 1998 and (3) Sept. 2002, for which HEGRA group had reported 4.4 detection in 72.5 hours, which mainly resulted from their 1998 observations[1]. The three light curves are characterised by reduced values of 1.64, 1.45 and 2.11 with respect to the average count levels of 0.200.02 , 0.180.02 and 0.140.04 respectively thereby, indicating that the source was possibly in nearly similar emission state during the two TACTIC observation epochs (in terms of variations on the time scale of a day) as it was during the epochs of the HEGRA observations in the RXTE ASM energy range.
| Spell | Non | Noff | Excess | Upper Limit |
|---|---|---|---|---|
| photons cm-2 s-1 | ||||
| 2004 | 1107 33 | 1135.19 | -28.0 38.54 | 5.08 |
| 2005 | 139337 | 1319.33 20 | 73.66 42.81 | 5.77 |
| 2004-2005 | 250050 | 2454.3328 | 45.66 57.6 | 3.84 10-12 |
3 Near Infrared Observations and Results
The Mount Abu Infrared Observatory is located at Gurushikar, a few kms away from the TACTIC -ray telescope, at an altitude of 1680m. It houses a 1.2m f/13 Cassegrain focus infrared telescope [21, 22]. The observations in near infrared J and H bands were taken during: (1) November 18, 22,23,24 and December 5, 6 in 2004 and (2) October 26,27 and December 6, 10,11 in 2005, using back end instrument NICMOS-3 near infrared detector array camera mounted on the 1.2m IR telescope. NICMOS-3 is a 256x256 pixels HgCdTe array detector, giving a FoV of with a pixel resolution of 0.96 arc sec. The detector is liquid nitrogen cooled to keep dark current low. In the near infrared region the background is very high leading to detector saturation at longer exposure times. To avoid detector saturation and improve upon the signal-to-noise ratio in near infrared bands, a set of large number of frames with short exposure times are taken at one position. Several such sets of images are taken keeping the source at different locations on the detector with 280 and 220 seconds of total integration times in J and H bands, respectively. At least two comparison stars are kept in each frame for magnitude calibration. A large number of dark frames with same exposure times as used in source observations were also taken every night.
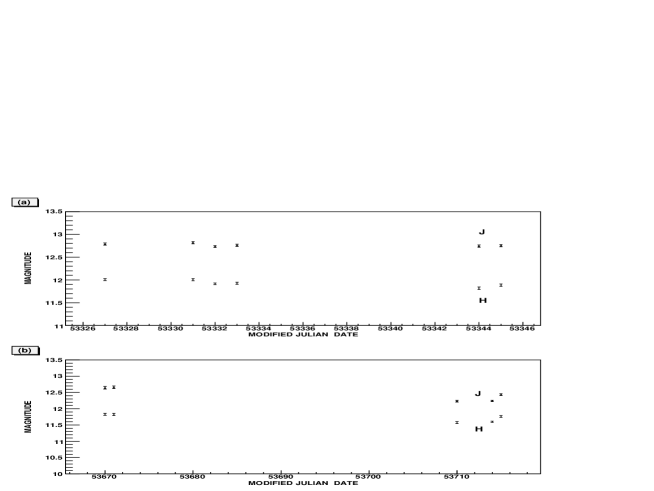
Data reduction and analysis was performed using IRAF and locally developed scripts details of which are given elsewhere [5]. All the source images in a set were combined and dark subtracted. To take care of background sky, sky image was constructed from all the images taken during the night and subtracted from the source images. The resultant 1ES2344+514 images were then flat fielded and treated for bad pixels and cosmic ray correction. The final images containing the source, 1ES2344+514, and calibration stars were subjected to aperture photometry keeping the aperture size same for the source and the comparison stars. The instrumental magnitudes thus obtained were used for differential photometry light curves. The source magnitudes were corrected using standard magnitude values of the comparison stars and these corrected J and H band magnitudes are plotted in Figure 5 as a function of time in MJD. It is clear from the figure that during 2004 observations, 1ES2344+514 shows low level ( 0.06 magnitude) day-to-day variation in both, J & H bands. The J band magnitude of the source remains around 12.85 which is about the average value for the source. The source, therefore, does not show any flaring/outburst activity in this energy regime during this period. It should be noted that the host galaxy of the 1ES2344+514 is relatively bright and stellar light from the host is capable of affecting the measurement of nuclear emissions, particularly when the seeing conditions are not good [15]. Under such observing conditions, while making observations in optical and near infrared, it is necessary to keep the aperture size fairly large in order to minimise the effect of host emission on the intrinsic variations in the nuclear flux. On the other hand, too large an aperture allows dilution of the nuclear emission and dampens amplitude of its intrinsic variation. Both these factors decide the size of aperture used in the photometric observations when the host is bright. We have taken care of these aspects in the present study by following the recommendation given in [15]. In our case, the seeing FWHM varied from about 2.5′′ to 3.3′′ (in the worst case) and therefore to optimize the photometric results, we have used 8 pixels as photometric aperture radius. The choice enables us to achieve good S/N ratio while keeping any spurious variation in source brightness, caused by seeing change and host galaxy contribution, below 0.01 mag. However, during most of the nights observing conditions were very good, photometric or close to photometric. We exercised extra precaution whenever we noticed variation in seeing. In particular, during the October 2005 epoch when the sky conditions were not stable leading to poor seeing, we used several standard stars to calibrate the source magnitude apart from the measures mentioned above. Stars were chosen to have about same magnitude as the source as recommended by [16, 26].
In the 2005 observation epoch, the source is seen in fainter (J magnitude 12.6) state during October 26- 27 (MJD 53670- 53671), brightening up by 0.41 magnitude on December 6, 2005 (MJD 53710). It then fades by about 0.2 magnitude during 6 to 10 December, 2005. However, intra-night variations appear to be within 1 level. It shows similar behaviour in both, J and H, bands. Since we do not have a continuous coverage of the source during October - December, 2005, it is not possible for us to state whether 1ES2344+514 had several flares or a slow increase in flux during the brightening phase. It would be very interesting to know the behaviour of the source in radio, optical and x-ray regions in order to infer the nature of near infrared emission - whether it is thermal or mostly non-thermal. The RXTE ASM(2-12 keV) x-ray data used here does not indicate any significant variation during this period. We are not aware of any observations in radio or optical region which could throw more light on the nature of the source during this period.
4 Discussion and Conclusions
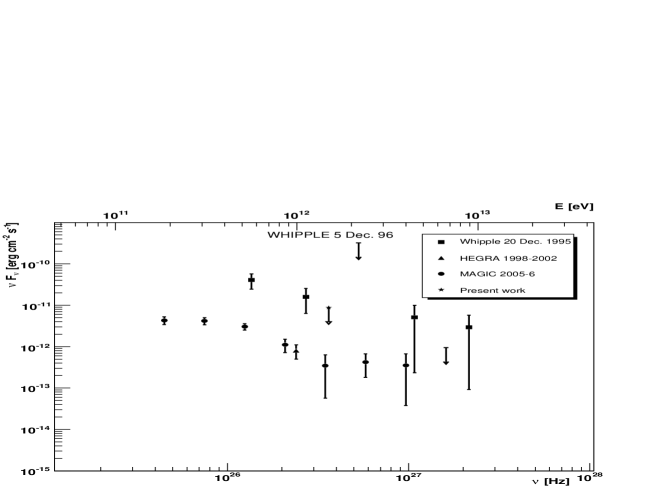
We have studied the BL Lac object 1ES2344+514 in VHE gamma-ray and near infrared wavelength bands with TACTIC and MIRO telescopes respectively during 2004-2005. We do not find any evidence for the presence of a statistically significant VHE gamma-ray signal, both in the overall data and on a nightly basis from the source above the threshold energy of 1.5 TeV. An upper limit of I(1.5 TeV) photons cm-2 s-1 has been obtained at a 3 confidence level on the integrated -ray flux and we conclude that the source was below the upper limit flux during the periods of these observations. The derived upperlimit has been shown in Figure 6 for comparison with the other VHE results from Whipple [36], HEGRA [1] and MAGIC [3, 43] groups on the same blazar 1ES2344+514. As is clear from this figure the TACTIC upperlimit is not in conflict with the MAGIC [3, 43] group detection of the source in 2005, as it is placed at I(1.5 TeV) photons cm-2 s-1 whereas the MAGIC detected integral flux F(1.5 TeV ) = photons cm-2 s-1 is much lower than the TACTIC upperlimit. In the RXTE ASM energy domain (2-12 keV) too, the light curves obtained from the RXTE site [4], which we have shown in Figure 4, do not show any statistically significant evidence for variations in the day averaged sum band intensity counts.
Our observational results in the near infrared wavelength bands are, however mixed, wherein the source 1ES2344+514 shows low level ( 0.06 magnitude) day-to-day variation in both, J & H bands during 2004 observations. Whereas, during 2005 observations in the same bands, the source brightens up by about 0.41 magnitude from its October 2005 level J magnitude = 12.64 to J = 12.23 magnitude on December 6, 2005. It then fades by about 0.2 magnitude during 6 to 10 December, 2005. The variation is seen in both, J & H, bands simultaneously. From these near infrared observations, we conclude that the source has possibly undergone a brightening phase during 2005 MIRO observations.
Further, the flux variations within a timescale of a day in the RXTE ASM and TACTIC energy ranges are low, when the source brightens by 0.41 magnitude in low energy near infrared region over a period of about 42 days or fades by 0.2 magnitude over a period of about 5 days. By considering the light travel time arguments and taking the fastest source variation in this study (0.2 magnitude in 5-days), the size of the near infrared emission region is about 5-light days (1.08 cm). Here, we have taken into account the Doppler factor of the jet as 8.4, obtained by [3] for the low state of the source and assuming that the variable near infrared emission is likely produced in the relativistic jet.
This source is dimmer than Mrk 421 and Mrk 501 at every wavelength so it is perhaps not surprising that the VHE emission of 1ES2344+514 appears to be weaker on average. Long term simultaneous multi-wavelength observations, with improved sensitivity particularly in TeV domain, are required to understand the emission mechanisms.
5 Acknowledgements
The authors would like to convey their gratitude to all the concerned colleagues of the Astrophysical Sciences Division for their contributions towards the instrumentation and observation aspects of the TACTIC telescope. The valuable suggestions from anonymous referees are gratefully acknowledged. Finally, we are thankful to Dr. R. M. Wagner of Max-Planck-Institut für Physik, D-80805 München, Germany, for providing useful inputs with respect to earlier 1ES2344+514 work.
6 References
References
-
[1]
Aharonian, F. A., et al., 2004, A&A, 421, 529
-
[2]
Aharonian, F. A., et al., 2000, A & A, 353, 847
-
[3]
Albert, J., et al., 2006, astro-ph, 0612383
-
[4]
ASM http://xte.mit.edu
-
[5]
Baliyan, K. S., Joshi, U.C., & Ganesh, S., 2005, BASI, 33, 181.
-
[6]
Bednarek, W., 1993, ApJ, 402, L29
-
[7]
Bednarek, W., 1997, arXiv astro-ph/9711189
-
[8]
Bhatt, N., et al., 2001, Meas. Sci & Tech 12, 167
-
[9]
Bhatt, N., et al., 2002, BASI, 30, 385
-
[10]
Blandford, R. D. & Levinson, A., 1995, ApJ, 441,79
-
[11]
Blazejowski H., et al., 2005, ApJ, 630, 130
-
[12]
Bloom, S. D. & Marscher, A.P., 1996, ApJ, 461, 657
-
[13]
Blumenthal G.R. and Gould R.J., 1970, Rev. of Mod. Physics 42, 237
-
[14]
Catanese, M., et al., 1998, ApJ, 501, 616
-
[15]
Cellone, S.A., Romero, G.E., Combi, J.A., 2000, AJ, 119,
1534
-
[16]
Cellone S.A., Romero, G.E., Araudo, A.T., 2007 MNRAS 374, 357
-
[17]
Dar, A. & Laor, A., 1997, ApJ, 478, L5
-
[18]
Dermer, C. D., Schlickeiser, R. & Mastichiadis, A., 1992, A & A, 256, L27
-
[19]
Dermer, C. D.& Schlickeiser, R., 1993, ApJ, 416, 458
-
[20]
Dermer, C. D., Struner, S.J., & Schlickeiser, R., 1997, ApJS, 109,103
-
[21]
Deshpande, M.R., 1995, JApAS 16, 444
-
[22]
Deshpande, M.R., 1995, BASI, 23, 13
-
[23]
Elvis, M. et al., 1992, ApJS, 80, 257
-
[24]
Ghisellini, G. & Madau,P., 1996, MNRAS, 280,67
-
[25]
Giommi, P. et al., 2000, MNRAS, 317, 743
-
[26]
Howell, S.B., Mitchell, K.J., Warnock, A., 1988, AJ, 95, 247
-
[27]
Helene, O., 1983, Nucl. Instrum. Methods Phys. Res., 212, 319
-
[28]
Hillas, A. M., 1985, in Proc 19th ICRC, 3, 445
-
[29]
Kerrick, A. D., et al., 1995, ApJ, 452, 588
-
[30]
Knigl, A. 1981, ApJ, 243, 700
-
[31]
Koul, M. K., et al., 2002, BASI, 31, 361
-
[32]
Mannheim, K., 1993, A&A, 269, 76
-
[33]
Maraschi, L. Ghisellini, G., & Celotti, A. 1992, ApJ, 397, L5
-
[34]
Mohanty, G., et al. 1998, Astroparticle Physics, 9, 15
-
[35]
Mücke, A. & Protheroe, R. J., 2001, APh, 15, 121
-
[36]
Schroedter, M., et al., 2005, ApJ, 628, 617
-
[37]
Sikora, M., Begelman, M.C., & Rees, M.J., 1994, ApJ, 421, 153
-
[38]
Sikora, M. & Madjeski,G., 2001, in AIP Conf. Proc. 558, High Energy Gamma-ray Astronomy, ed. A.F. Aharonian & H.J. Volk(New York: AIP), 275
-
[39]
Tluczykont, M., et al. 2003, 28th ICRC, volume 5, pages 2547
-
[40]
Ulrich, M. H., et al. 1997, Ann. Rev. Astron. and Astroph., 35, 445
-
[41]
Urry, C. M., Padovani,P., 1995, PASP, 107,803
-
[42]
Wagner, S. J., et al., 1995, A & A, 298, 688
-
[43]
Wagner, R. M., 2006, Ph.D thesis,Max-Planck-Institut für Physik, D-80805 München, Germany
-
[44]
Xie, Z. G., et al., 1997, Ap.J, 477, 114
-
[45]
Xie, Z. G., et al., 2002, MNRAS, 329, 689
-
[46]
Yadav K.K., et al., 2006, Accepted in Astopartcle Physics