The Sextet Arcs: a Strongly Lensed Lyman Break Galaxy in the ACS Spectroscopic Galaxy Survey towards Abell 1689
Abstract
We present results of the HST Advanced Camera for Surveys spectroscopic ground-based redshift survey in the field of A1689. We measure 98 redshifts, increasing the number of spectroscopically confirmed objects by sixfold. We present two spectra from this catalog of the Sextet Arcs, images which arise from a strongly-lensed Lyman Break Galaxy (LBG) at a redshift of =3.038. Gravitational lensing by the cluster magnifies its flux by a factor of 16 and produces six separate images with a total -band magnitude of . The two spectra, each of which represents emission from different regions of the LBG, show H I and interstellar metal absorption lines at the systemic redshift. Significant variations are seen in Ly- profile across a single galaxy, ranging from strong absorption to a combination of emission plus absorption. A spectrum of a third image close to the brightest arc shows Ly- emission at the same redshift as the LBG, arising from either another spatially distinct region of the galaxy, or from a companion galaxy close to the LBG. Taken as a group, the Ly- equivalent width in these three spectra decreases with increasing equivalent width of the strongest interstellar absorption lines. We discuss how these variations can be used to understand the physical conditions in the LBG. Intrinsically, this LBG is faint, 0.1, and forming stars at a modest rate, 4 . We also detect absorption line systems toward the Sextet Arcs at =2.873 and =2.534. The latter system is seen across two of our spectra.
1 Introduction
From a certain observational standpoint, our understanding of Lyman-break galaxies (LBGs) is akin to that of the Milky Way nearly half a century ago. The discovery of the connection between stellar abundances and kinematics to the history of galaxy evolution made for a significant step forward in the growing understanding of galaxies (Freeman & Bland-Hawthorn, 2002; Eggen et al., 1962).
For LBGs, the large leap forward came with the discovery of nearly one-thousand galaxies at 3 initially targeted via color selection for the Lyman-series break inherent in their spectra (Steidel et al., 2003). The general properties of this galaxy population have been investigated in detail (Adelberger et al., 2003, 1998; Steidel et al., 1998). To examine the intrinsic properties of LBGs as a group, Shapley et al. (2003) produced a composite spectrum from over 800 individual LBG spectra. They found that the combined absorption plus emission rest equivalent width (REW) of Ly- depended on four primary spectral characteristics: for increasing Ly- REW the total REW of the low ionization interstellar lines decreased, the rest frame UV spectrum became bluer, the velocity offset between Ly- and the mean redshift of the interstellar lines decreased, and the star formation rate went down. They explained these effects as a combination of incomplete coverage of the UV continuum light by gas and dust, and a range of velocities over which gas is absorbed.
The coaddition of many hundred LBG spectra by Shapley et al. (2003) was necessary because individual LBGs are faint, and the spectral properties of individual LBGs are hard to record at high spectral resolution and signal-to-noise. A notable exception is the strongly-lensed LBG MS1512cB58 (hereafter cB58) at =2.73 (Yee et al., 1996). Magnification by the cluster MS151236 increases the flux of the LBG to , making it possible to observe this galaxy at a resolution high enough to obtain accurate abundances from interstellar absorption lines. Pettini et al. (2002, 2000) found the gas outflowing from cB58 to be highly enriched in -elements (from Type II supernovae), with abundances of O, Mg, Si, P and S all times the solar value. At the same time, the N and Fe-peak elements of Mn, Fe and Ni were underabundant by a factor of three. Such a pattern implied that the outflowing gas had been enriched for only Myr.
The class of strongly-lensed LBGs (hereafter SLLBGs), of which cB58 is a member, is characterized by its enhanced flux. Ordered by increasing -band flux, the recently discovered ‘8 o’clock arc’ is the brightest with a total magnitude of =19.22 (Allam et al., 2006). It is followed by LBG J2135.2-0102 the ‘Cosmic Eye’ (Smail et al., 2006), cB58, A2218-384 (Ebbels et al., 1996), the Sextet Arcs (this paper), 1E0657-56-A (Mehlert et al., 2001), and Q0000-D6 (Giallongo et al., 2002). Note there is also one bright strongly-lensed galaxy known at lower redshift, =1.9, but the Ly-series break is not redshifted into the optical bands and so it is not included here (Lemoine-Busserolle et al., 2003). They are brighter than the majority of field LBGs, making medium spectral resolution observations feasible. Additionally, the five brightest SLLBGs, (including the one presented in this paper), are also extended on the sky, enabling spatially-resolved spectroscopy of high redshift galaxies. This has already been achieved for two fainter, higher redshift objects: the quadruply-lensed giant arc in A2390 at =4.040 (Frye et al., 1997; Bunker et al., 1998), and a galaxy at (Swinbank et al., 2007).
While detailed studies of this class are in progress, there are already clues that the intrinsic properties of luminosity and extinction for at least some of the SLLBGs are different from the general LBG population. The brightest SLLBG, the 8 o-clock arc, has an estimated unlensed magnitude that is brighter than the general LBG population by four magnitudes in . In another recently discovered SLLBG, the so-called Cosmic Eye arc, LBG J2135.2-0101, the extinction is high enough to place it on the borderline of the reddening selection criterion for the Steidel et al. (2003) sample.
We present here spectra of a new SLLBG at =3.038 whose lensed images we designate as the “Sextet Arcs.” The Sextet Arcs consist of six separate images towards the massive lensing cluster A1689 (=0.187) with a total magnitude integrated over all images of . This bright LBG was first identified by Broadhurst et al. (2005) as a part of the strong lensing study of A1689 and is relatively rare in being a multiply-imaged galaxy with a reported spectroscopic redshift. Only three of the 30 multiply imaged galaxies have confirming spectra, and thus this system of arcs has featured prominently in several recent strong lensing analyses used to derive dark matter mass distributions in this well studied cluster (Leonard et al., 2007; Limousin et al., 2006; Zekser et al., 2006; Halkola et al., 2006; Broadhurst et al., 2005).
Most of these data were taken for the HST Advanced Camera for Surveys (ACS) spectroscopic ground-based redshift survey. Some data were acquired prior to the start of this GTO program on A1689. We present a redshift catalog of nearly 100 objects in the field of A1689, with nearly three-fourths of them being new arclets with 0.23. Until this paper, only the redshifts of 10 objects in the background of A1689 have appeared in the literature (Broadhurst et al., 2005; Frye et al., 2002).
This paper is organized as follows: We summarize the imaging and spectroscopic observations in §2, and outline the custom-built reductions and analysis in §3. We show the spectra for the Sextet Arcs in §4, and the spectra for the spatially-resolved intervening absorption system in §5. In §6 we discuss the variations of spectral characteristics seen along the Sextet Arcs and the =2.534 absorption system and how these results can be used to further constrain the lens model. We also measure the intrinsic properties of star formation rate and intrinsic luminosity. Finally in §7 we give the summary and conclusion. The results of our spectroscopic catalog, and comparison with the literature, is given in the Appendix. Throughout this paper we assume a cosmology with km s-1 Mpc-1, , .
2 Observations
2.1 Imaging
Abell 1689 was observed in June, 2002 as part of HST ACS GTO time. Deep exposures were taken in the , , , and passbands, reaching limiting magnitudes of 27.5, 27.2, 27.2 and 26.7 respectively. Details of the ACS observations can be found in Broadhurst et al. (2005). To calculate robust photometric redshifts, we obtained ground-based images. The -band image was acquired from the DuPont Telescope at Las Campanas and was taken in conditions of seeing, as measured from the PSF off the images. The -band image was acquired from the Nordic Optical Telescope (NOT) at La Palma, from which we measure seeing. Broadband , , images, and a narrow-band band image taken with the NB9148 filter were obtained in March 1999 with LRIS on Keck 2 taken under conditions of , , , and seeing, and limiting magnitudes of 27.17, 26.96, 26.41, and 24.81 respectively for the four filters. Finally, the , , and images were obtained with Son of Isaac (SOFI) on the ESO New Technology Telescope (NTT) taken under conditions of , , and seeing to limiting magnitudes of 25.12, 24.22, and 24.06. A complementary -band Infrared Spectrometer and Array Camera (ISAAC) VLT image taken under conditions of seeing was also analyzed.
2.2 Imaging Results
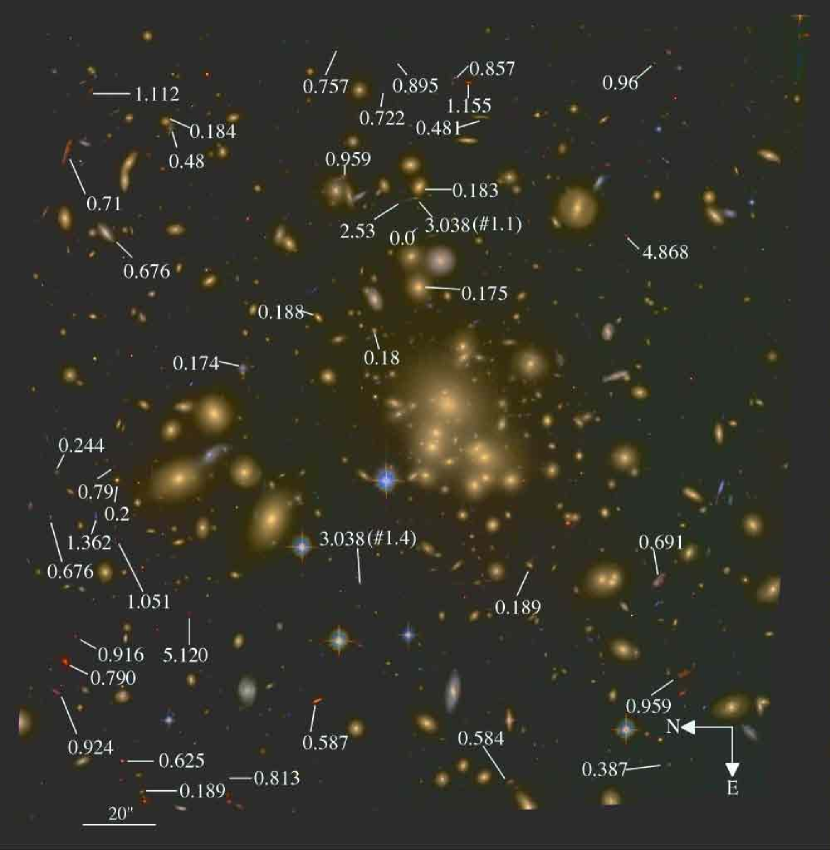
The ACS true color image of the central portion of Abell 1689 is shown in Figure 1. This image was made using the Sloan Digital Sky Survey pipeline photo (Lupton et al., 2001). The asinh stretch was applied, as described in Lupton et al. (2004); it is fast, and qualitatively similar to the ACS image presented by Broadhurst et al. (2005). Cluster members appear as extended yellow objects in the center and left of center, and the objects from our sample in common with our larger Keck LRIS field are marked. Additionally, two images of the six Sextet Arcs at are circled.
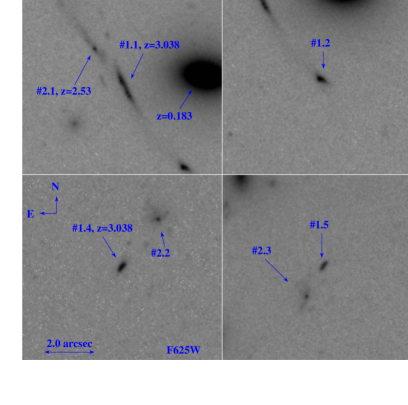
The Sextet Arcs were identified by Broadhurst et al. (2005) to be one object lensed into six separate arcs. The arcs are labeled #1.1 through #1.6 and each of them are shown in our HST ACS -band data, (Figure 5). The image in the upper left panel of this 6-panel image is a fold arc comprising two unseparated images but taken to be one image, named #1.1. Image #1.1 has an estimated magnified image area of 16, as measured from the delensed images in Broadhurst et al. (2005). Images #1.1 and #1.2 subtend a length of 6 arcseconds, similar in apparent size to the other known strongly-lensed LBGs. The five images comprising source #2, which we designate as the ‘Quintet Arcs,’ are also shown. Table 4 gives the positions of all images of the Sextet Arcs and Quintet Arcs in ACS , , and -band magnitudes.
We recount the argument in Broadhurst et al. (2005) to show that the six separate images comprising the Sextet Arcs all belong to one source galaxy. First, each image of the Sextet Arcs, except for the central demagnified one, has the same elongated morphology. Each image of the Sextet Arcs is also always accompanied by a neighboring image which has a distinctive core-plus-halo morphology. These neighboring images, with an average angular separation of 2 arcsec depending on the differing magnifications for each image, are the Quintet Arcs (Source #2). The image pairs, comprising one image each of the Sextet Arcs (Source #1) and Quintet Arcs (Source #2), appear with strikingly-similar morphologies at multiple locations despite being stretched, rotated, and parity-flipped, thus allowing for their confident identification by-eye as multiply-lensed (Figure 5). From this initial identification a mass model was constructed and used to predict and verify the positions of other counterarcs, including the central demagnified image. Photometric redshifts were then calculated and found to match the data. Finally, spectra were taken of two of the images which yielded the same redshift, .
2.3 Spectroscopy
A summary of the ground-based spectroscopic observations is given in Table 1. Observations were carried out at the Keck Observatory, the Very Large Telescope (VLT), and Las Campanas Magellan-Clay Observatory. Targets were color-selected in Keck LRIS bands to be behind the cluster, and the limiting magnitude selected to suit the allocated observing time and instrument. In total, spectra were obtained for 255 objects. Of those, 98 objects with secure spectroscopic redshifts are presented here (see Tables 3 and 4).
2.3.1 Keck Observations
Nearly three-fourths of the data were obtained from Keck LRIS over a course of five observing runs, from April 1996 to March 2003. Seven multislit masks were used with either the 300 lines/mm grating (blazed at a central wavelength of 5000 Å), or the 400 lines/mm grating (blazed at 8500 Å). The observed resolution varied slightly over the observing runs, with the lower dispersion grating providing a resolution of 12 Å FWHM and the higher one, 9 Å FWHM, determined from the 6300 Å skyline. Typical exposure times for both setups were 6 1200 sec with 10 dithers between exposures to correct for fringing and uneven illumination along the slits. The slit widths were chosen to be from 0.8″1″, and the conditions ranged from ″ 085 seeing. The spectrum of the brightest image of the Sextet Arcs, #1.1, was obtained in June, 1997 with the 300 line/mm grating in 2.8 hours of integration (see Figure 5).
2.3.2 VLT Observations
Spectroscopic data were obtained at VLT on FORS2 in June and July 2001 in service mode. One multislit mask was used with the 300 lines/mm grism, providing 12 Å resolution at 6300 Å. Exposure times were 33 1200 sec with 10 dithers between exposures. The slitwidths were 1″. Objects fainter than were targeted, and the results are given in Table 1. One high redshift galaxy was discovered, an emission line object at =4.705 and =25.3 (see Table 4). Also additional data on the bright triply-lensed system at =4.868 was obtained and will appear in an upcoming paper (see Frye et al. 2002 for the Keck LRIS spectrum of this object).
2.3.3 Magellan Observations
One-fourth of the survey was carried out at Magellan Observatory in 2003 May on the low-dispersion survey spectrograph (LDSS2). Five multislit masks were used with the 300 lines/mm medium-blue grism blazed at 5500 Å. The grism provided 16 Å resolution at 6700 Å. Exposure times varied from 2 3600 sec to 14 3600 sec, with 1″ dithers after every two exposures. Spectra for arclets #1.4 and #2.1 were obtained in a total of 8 h and 11 h respectively.
3 Data Reduction
3.1 Spectra
We have custom-built a spectroscopic reduction package for this project. The aim is to maximize the signal to noise of background limited data without resampling the pixels, so that groups of pixels carrying faint continuum signal have every chance of being detected as a coherent pattern in the final reduced image. It can operate on full 2d fits frames directly, outputting reduced 2d frames. It is unique in that it can follow the object signal over the full dispersion range even if the object signal drops off, by following the curvature of the similarly-distorted spectrum box edges. Also it can correct for mask defects such as the complex spatial slit profile, and can accommodate subpixel shifts between the flatfield and the data frames by modeling the slit profile with a dispersed flatfield. The details of the reduction pipeline can be found in Frye et al. (2002).
The spectral data for image #1.1 of the Sextet arc was fluxed by taking the spectrum of an early-type cluster member at =0.187, observed simultaneously through the multislit mask, and comparing it to the standard empirical E/SO spectrum of Kennicutt (1992). The spectral data for images #1.4 and #2.1 from Magellan were taken at low 20 Å resolution. The data were flux calibrated with the standard star LTT3218. A sensitivity function was created using the IRAF task sensfunc, which was then scaled to the spectrum and divided into the data.
3.2 Photometry
Objects within the ACS FOV were detected in a +++ “galaxy-subtracted” image using SExtractor (Bertin & Arnouts, 1996). The galaxy subtraction involved carefully modeling the A1689 cluster galaxies, and subtracting their light from each image. This helps both to detect extra galaxy images (especially near the center of the cluster) and to improve the photometry of the faint, low-surface brightness background galaxies. This meticulous process has not been extended to our ground-based images. Bayesian photometric redshifts were obtained based on this galaxy-subtracted These redshift estimates provided a means of confirming the thirty sets of multiply-imaged objects identified in the field (Broadhurst et al., 2005). These images are very faint, , making spectroscopy unfeasible for all 100 images.
To include galaxies within a larger FOV, objects were also detected in the deepest Keck image (the -band). Aperture-matched PSF-corrected photometry was then obtained across the 14-filter ACS and ground-based image set using techniques since made available in the ColorPro software package (Coe et al., 2006). A separate Bayesian photometric redshift catalog was obtained based on these magnitudes. A good general agreement is found between measured redshifts for objects detected in both catalogs. For objects within the ACS FOV, we report photometric redshifts as measured in the above-mentioned ACS catalog, while for objects outside the ACS FOV, we quote results from this Keck-based catalog. More details will be published along with the full photometric catalogs in an upcoming paper (Coe et al., 2007).
4 Source #1: The Sextet Arcs
4.1 Image #1.1
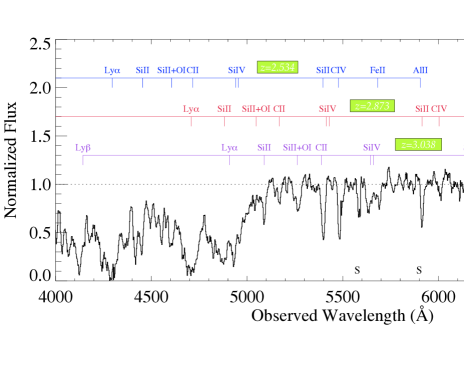
The spectrum of image #1.1 was optimally-extracted and is shown in Figure 6. Several strong low ionization absorption lines are detected. They are Si II 1260, O I + Si II (where we take the mean wavelength of these blended lines to be 1303 Å), C II 1334, SiIV 1393, 1402, Si II 1527, Fe II 1608, and Al II 1671. The rest equivalent widths of these lines are listed in Table 4, including their 1- errors. A fit to the line centroids of the four strongest interstellar absorption lines, Si II 1260, O I Si II , C II 1334, and Si II 1527, yields an absorption line redshift of =3.041.
The Ly- absorption line profile shows considerable structure, some of which appears to be caused by the superposition of a weak emission line at 4907 Å. Although this feature may simply be an artifact of complex multicomponent Ly- absorption lines close to the redshift of Source #1, we find a similar, unambiguously identified Ly- emission line in the spectrum of image #1.4 at an identical redshift (see §5.2). For this reason, we believe the weak feature near the deepest part of the Ly- absorption line profile in the spectrum of image #1.1 is indeed a Ly- emission line. As there are no stellar photospheric features, we cannot measure the systemic redshift of the SLLBG directly. We obtain the velocity offset correction by following the prescription in Adelberger et al. (2003, their equation (5)). Based on a mean velocity difference of -75 km s-1 between Ly- emission and the low ionization interstellar lines, we calculate a velocity offset of km s-1 smaller than the nebular redshift, or =.
The Ly- absorption is wide, and has a shape reminiscent of a Damped Ly- (DLA) line. However, the flux of the line never reaches zero, as would be expected for a DLA observed at the resolution of our data. As discussed above, this is probably because the absorption is filled in with Ly- emission. Apart from this contamination, the underlying absorption must arise from some combination of high and low H I column density clouds overlapping in velocity. At the resolution of our data, however, we cannot untangle the velocity structure of the absorption. On the other hand, we can at least set an upper limit to the H I column density, H I, assuming that the absorption comes from a single high-(H I) cloud. We can set the absorption redshift to be the same as that of the SiII 1260 line, which is the only metal line not blended with metal lines from lower redshift absorption line systems. The redshift of this line is =3.038 (the same as the Ly- emission) must therefore reflect the redshift of the bulk of the H I gas. The upper limit to (H I) can then be determined by fitting the red wing of the Ly- absorption between 1200-1250 Å. This procedure is not straightforward, since not only do we not know the full velocity extent of the contaminating Ly- emission, and the wing may well be contaminated by SiIV 1393, 1402 at =2.534 (see §6. Using the available continuum, however, it seems likely that the H I column density is log (H I) . We also find that at =3.038, the Ly- line expected from the Ly- absorption does not line-up well with the feature identified as Ly- at 4122 Å. It thus seems likely that the Ly- absorption line is also filled in with Ly- emission, and cannot be used to better constrain (H I).
The low ionization absorption lines are all strong, and reminiscent of the SLLBG MS1512-cB58 (Pettini et al., 2002). A comparison of rest equivalent widths of all the lines that are in common with those seen towards cB58 shows that the absorption in the spectrum of image #1.1 is weaker. Only C II 1334 is of equal strength, but this is due to a chance blend with two other intervening absorption lines, SiIV 1394, 1402 at =2.873, and SiII 1527 at =2.534. As is true for cB58, the metal lines in our data are also likely saturated. For example, the ratio of the rest equivalent width of SiII 1260 to SiII 1527 should be 6 for optically thin lines (Morton, 2003). We measure the ratio of rest equivalent widths to be , as compared to 0.95 for the composite LBG spectrum (Shapley et al., 2003). As for SiIV 1393, 1402, while we do detect both lines, they are blended with AlII 1608 at =2.534 and so are of no use other than redshift confirmation. Note at our resolution we do not detect any weak absorption features which fall on the linear part of the curve of growth.
The spectrum of image #1.1 appears to show little evidence for gas motions. The velocity difference between the line centroid of Ly- emission and the mean of the interstellar absorption lines is km s-1. Gas with such a velocity offset that is consistent with a static medium or even a blueshift is observed in only 5% of cases in the general LBG population (Shapley et al., 2003). The theoretical prediction from Monte Carlo simulations of galaxies is for Ly- to be redshifted from the stellar redshift by twice the velocity shift of the interstellar lines from Ly- (Verhamme et al., 2006). For our data Ly- is blueshifted from the interstellar lines by km s-1, and Ly- is also blueshifted from the stellar redshift, by km s-1. At the same time, the absorption line profile of Si IV 1394 shows broad blueshifted absorption indicative of gas outflow. We require higher resolution data to address the somewhat unusual kinematics of this galaxy.
To measure the extinction in this spectrum, we fit our multiwavelength photometry to the starburst SED templates of Calzetti et al. (1994). Six starburst galaxy templates are provided with various levels of extinction. To these we add interpolations of adjacent templates until a best fit is found. We measure , and consider this value to be an upper limit owing to an unknown level of light contamination from a nearby cluster elliptical at .
In addition to the absorption at =3.038, there are also two other intervening absorption systems, both of which are marked in Figure 6. The first is at =2.873. It shows strong Ly- absorption, O I 1302 Si II 1304, C II 1334, SiIV 1393 (blended with C II 1334 at =3.038 and Si II 1527 at =2.534), and Si II 1527. The second absorption system is at =2.534. It shows O I 1302 Si II 1304, , SiIV 1393, 1402, Si II 1527, Fe II 1608, and Al II 1671. Interestingly, we observed the absorption system at =2.534 also in another spectrum taken only 2 arcsec away on the sky, which will be discussed in §5.
4.2 Image #1.4
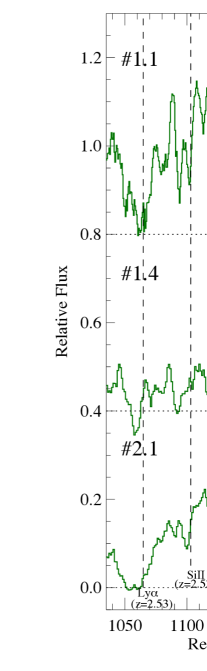
Image #1.1 discussed above and image #1.4 are both images of the same source. In Figure 7 we show the spectrum of image #1.4. It shows strong Ly- emission and Ly-series decrement (Figure 7). We see indications of gas motions in the linewidth of the Ly- line as indicated by a large deconvolved FWHM = 1700 km s-1. Further, the P-Cygni type profile of Ly- is indicative of large scale gas outflow, and is in contrast to the Ly- absorption seen in image #1.1 (Figure 7). The implications of the variations in Ly- seen across a single galaxy will be discussed in §7.
We calculate the extinction in image #1.4 to be . It was calculated in the same way as that for image #1.1, discussed above. Given the small size of this image compared to the slitwidth of the multislit mask, we are confident that we are capturing all of the stellar component of this LBG in the spectrum of image #1.4. This is in contrast to image #1.1, for which the spectrum records only 1 arcsec of the giant (5.5 arcsec long) arc. For this reason we adopt our measured value of the extinction of =0.10 as the best value for the Sextet Arcs. The value is similar to the values measured by Shapley et al. (2003) in their composite LBG spectra.
5 Source #2: The Quintet Arcs
The Quintet Arcs (our designation for the five images of Source #2 identified by Broadhurst et al. 2005), are shown in Figure 5. They are spatially-resolved and characterized by a two component compact bright core plus extended halo. This morphology is recognizable from image to image along the critical curve of the cluster despite being stretched, rotated, and parity-flipped. The Quintet Arcs subtend an average lensed separation from the Sextet Arcs of 2 arcsec, with the variation in angular separation between the images accounted for by the differing magnifications along this second strongly-lensed object in this paper.
5.1 Image #2.1
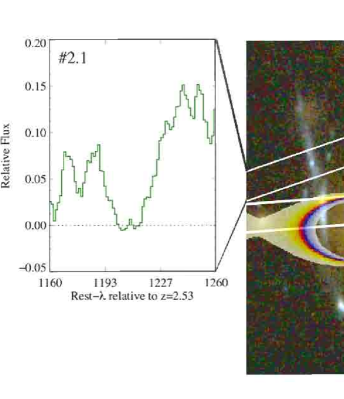
The spectrum for image #2.1 is shown in Figure 7. Unlike the spectra for either image #1.1 or #1.4, Ly- is seen in emission only, with no corresponding Ly- absorption. The low ionization lines of SiII 1260 and C II 1334 (Si II 1527 at =2.534 and SiIV 1393, 1402 at =2.87). We see indications of gas motions in the linewidths of this spectrum, reporting a deconvolved FWHM for Ly- of 1350 km s-1. The total profile of emission plus absorption for Ly- is symmetric, in contrast both to the absorption seen in the spectrum of image #1.1 and the P-Cygni type profile seen towards image #1.4. We measure , similar to image #1.4.
There is an intervening absorption system towards this object at =2.534 (Figure 7). Several low ionization lines are detected, including Si II 1260, O I 1302 Si II 1304, C II 1334, Si II 1527, C IV 1448, 1550, and Fe II 1609. Ly- absorption clearly reaches the zero-level of the continuum, and is possibly damped.
5.2 Source Correspondence and Redshift Determination for Image #2.1
The slit used to obtain a spectrum of image #2.1 unexpectedly produced a spectrum with precisely the same redshift as Sextet Arc image #1.1, including a strong emission feature at the expected position of Ly- at =3.038. However, we think it unlikely that this is the true redshift of #2.1. We searched for the same Ly- emission feature in our other spectra of Source #2, but only our 3 h LDSS2 Magellan spectrum of image #2.2 covered the correct wavelength range. The observed equivalent width of Ly- in the spectrum of image #2.1 is measured to be Å. A comparison measurement made of a typical noise feature near the expected position of Ly- in the spectrum of image #2.2 gives Å. It is thus unlikely that we would be able to detect the same Ly- seen in the spectrum of image #1.1 in the available spectrum of image #2.2.
The idea that there may be significant contamination from image #1.1 at the position of image #2.1 was first put forth by Broadhurst et al. (2005), given that both images are found near the critical curve and stretched significantly on the sky. Figure 8 shows the observational setup used to record the spectra of images #1.1 and #2.1 using a one arcsec slit centered on image #2.1, and a one arcsec slit centered on the brightest part of image #1.1. This separation is only two arcsec on the sky, which may not be enough to clear it of stray light from #1.1. In fact, the Ly- emission peak in the spectrum of image #2.1 is found to be separated in velocity by only km s-1 from the Ly- emission from image #1.1.
As discussed in §6.2, there is a strong intervening absorption system at =2.534. While it is not possible to measure a column density at this resolution, the absorption is so broad, 4000 km s-1, that it is probably a damped Ly- system. With this observation and the significant stretching of image #1.1, we propose that the Ly- in the spectrum of image #2.1 is scattered light from Sextet Arc #1.1, and that the redshift of image #2.1 is detected by absorption at =2.534 toward the Sextet Arc #1.1. Note the photometric redshift for image #2.1 is , encompassing both redshifts =2.534 and =3.038 within the errors (see Table 4). If image #2.1 does represent another spatial region of Source #1 at =3.038, then these significant variations in the Ly- profile may have rather interesting implications for the kinematics, as is discussed in §6.
6 Discussion
6.1 Ly- Trends for the Sextet Arcs
The Ly- profiles in the spectra of images #1.1, #1.4 and #2.1 range from strong absorption to a combination of emission plus absorption, to pure emission (Figure 7). The spectra for images #1.1 and #1.4 appear to be representing two different spatial regions of the same spatially-resolved LBG at =3.038, and the spectrum for image #2.1 possibly does as well, depending on the identification of its source of starlight. The spectrum for image #1.1 was taken of a one arcsec portion of what is a giant arc with a total length of more than 5.5 arcsec and an estimated area magnification factor of (Figure 8). In turn, image #1.4, with a smaller estimated magnification of , has a total spatial extent that is smaller than the slitwidth used to record the spectrum, so that our data contains all the light from Source #1. Image #2.1 has an estimated magnification of . Its spectrum shows a second and different one-arcsec portion of the giant arc #1.1, or a companion galaxy in a pair or group of galaxies at the systemic redshift of the Sextet Arcs.
We can compare the equivalent widths of Ly- for the three images with the four LBG subsamples established by Shapley et al. (2003). By sorting their sample of 811 galaxies by rest equivalent width of Ly-, WLyα, they found a significant dependence of WLyα on rest equivalent with of the strongest low ionization interstellar absorption lines WLIS. For each image #1.1, #1.4, and #2.1, we measure rest equivalent width of Ly-, WLyα, with the uncertainty determined by continuum placement in the Lyman- forest and the position of the wavelength boundaries. For image #1.1, there are at least four features that carve into the Ly- absorption line profile at =3.038. In the blue damping wing a second Ly- line appears at =2.783. At the systemic redshift there is a partial emission-filling of the Ly- line, and just redward of this emission feature there are the two absorption features Si IV 1393, 1402 at =2.53. We selected wavelength boundaries by eye from 1182.0 - 1241.6 Å. For image #1.4, Ly- is seen both in emission and absorption. The equivalent width is computed across both components, from 1193.0 - 1223.6 Å. For the metal lines, the total rest equivalent width of Si II 1260, O I1302+Si II1304, and C II 1334 was taken, with the errors based on the noise and continuum placement. Although the errors are large, particularly for the lowest resolution data of images #1.4 and #2.1, WLIS decreases in strength as WLyα increases from Å in absorption to 5.4 Å in emission (Figure 9).
These measurements suggest significant variations of Ly- strength are possible within a single galaxy. Note even if our spectrum for image #2.1 is not a spatial extended region of the Sextet Arc #1.1, there is still a large variation in both the strength and profile of Ly- for images #1.1 and #1.4. The equivalent widths from the literature are included for other SLLBGs, where available. For cB58, WLyα was not reported by Pettini et al. (2002). It is visibly damped at their resolution of 58 km s-1, so in principle one could infer a value of WLyα. It is interesting that their value for WLIS is higher than the Sextet Arcs and four LBG subsamples by a factor of two.
At least two of the three images are representing different parts of an individual galaxy, thus fixing the LBG age. Thus if the dependancy of Ly- strength with the strength of the metal lines is real, then we infer that this trend does not appear to be a function of LBG age. To address whether the correlation may depend on metallicity, Shapley et al. (2003) measured a small line ratio of Si II 1260 and 1527, and so do we for image #1.1, implying that Si II is saturated, and therefore that differences in equivalent width do not depend on metallicity, but rather on the combination of covering factor and a range of velocities over which the gas is absorbed.
6.2 The Absorption System at =2.53
The absorption system at =2.534 is seen toward two of our spectra over a baseline of two arcsec on the sky. Strong Ly- absorption is seen toward both images #1.1 and #2.1. While the data are of insufficient resolution to measure column densities, there is evidence in spectrum #2.1 of absorption that clearly reaches the zero-level of the continuum. It is interesting that our spectrum #1.1 is at an estimated unlensed physical separation of 2 kpc from the center of our slit for spectrum #2.1, and yields Ly- that is strong but probably unsaturated (Figure 8). It is tempting to conclude that we are seeing the HI column density decrease with radius over a size scale a factor of ten larger than the half-light radius of image #2.1. However, two counterarcs of image #2.1 are predicted between images #1.1 and #1.2. Thus it is possible that our spectrum for image #1.1 suffers from contaminated light from these faint additional images.
The high ionization metal lines in this absorption system at =2.534 are similar in strength to those in the Sextet Arc #1.1 at =3.038. It is interesting that interstellar C IV and Si IV should be so prominent in an absorption system at our low resolution. We consider briefly the possibility that this absorption system is not an intervening object, but rather the spectrum of an outflow absorption from the Sextet Arcs LBG. The velocity difference between the and systems is 38,000 km s-1. Such a large velocity difference for an associated outflow is not unusual for QSOs, but the the Sextet Arc #1.1 is an image of an LBG and does not show any signs of AGN-like activity.
6.3 The Lens Model
Our lens model is taken from the surface mass density map in Broadhurst et al. (2005). Briefly, the model was constructed based on 30 multiply-lensed galaxies, by minimizing the angular distance between the predicted images and the observed images in the image plane. The model consists of the sum of a smoothly-varying low-frequency component representing the dark matter, and a high-frequency component representing the nonnegligable cluster galaxy contribution. The resulting mass map reproduces the positions and of the images with a precision of typically 1-3″ from the best fit model, and accurately predicts the morphology, size, orientation, and parity of the lensed images. The critical curve in the region of Sextet Arcs images #1.1 and #1.2, and Quintet Arcs image #2.1, is shown in Figure 8. The local cusp is produced by the massive nearby cluster elliptical at =0.187. The region of high magnification with positive parity (yellow-red), and high magnification with negative parity (blue-white), are shown. The thin black line at the interface between these two regions marks locus of points for which the magnification factor diverges. This model has predictive power to estimate redshifts. A comparison of the observed separations between the Source #1 and #2 image pairs #1.3 and #2.4, #1.4 and #2.2, and #1.5 and #2.3 with model-predicted locations for different source redshifts suggests that source #1 has a higher redshift. Thus the model favors the scenario in which Source #1 and #2 have redshifts =3.038 and =2.534 respectively.
If Sources #1 and #2 appear only as image pairs, there should be the same number of total images of each source, but instead there are seven images of the Sextet Arcs (but identified in Broadhurst et al. (2005) as six separate ones), and five images of the Quintet Arcs. Two images of the Sextet Arcs appear as two merging images, which is referred to as image #1.1. Their locations are predicted by the model, at the intersection of the critical curve with the giant arc (Figure 8). In a similar manner, two additional unseparated images of Source #2 are predicted at the position of the second region of intersection of the critical curve with the giant arc (between images #1.1 and #1.2). These images are created from a small portion of image #2.1 which does not contain the bright emission peak seen in the center of the 1 arcsec slit in Figure 8. This arc is possibly matched with a faint stretched arc that is barely visible in the ACS image, between images #1.1 and #1.2. It is possible that these additional faint images may have been detected by their absorption, even though our spectrum for image #1.1 falls arcsec short of covering the most likely position of these new predicted images. Our spectrum of image #1.1 shows a strong intervening absorption system at =2.534 which is also seen in our spectrum of image #2.1. However, this absorption system is weaker in Ly- than in its counterpart absorption at the same redshift in our image #2.1 (Figure 8). From this we conclude that this absorption system may be the predicted unseparated counterarcs from a small portion of image #2.1. Alternatively, if this intervening absorption system forms a spatially-contiguous extension with origin at the center of image #2.1, we be may detecting the relatively unusual case of a drop-off of H I column density with radius at high-. Spectroscopy along the long axis of this giant arc will enable source identifications of these absorption systems, thus yielding additional constraints on the effort to derive a precision massmap for A1689.
6.4 Intrinsic Properties of the Sextet Arcs
The Sextet Arcs have an estimated reddening of , for images #1.1, #1.4, and #2.1, respectively. As discussed above, the extinction in image #1.1 suffers from contamination by a nearby cluster elliptical. We can use these values for the extinction plus the rest-frame ultraviolet flux to compute a star formation rate. Specifically, the ultraviolet flux of each best SED fit is measured within a synthetic tophat filter of rest-frame width 300 Å, from 1250-1550 Å. Given the galaxy’s redshift, we convert for image #1.1 to a luminosity , which in turn can be converted to a star formation rate:
| (1) |
This conversion rate is computed for a Salpeter (1955) IMF truncated between . Allowing the Salpeter IMF to extend from results in a conversion rate of ergs/s/Hz per /year. This is prefered by some authors. Meanwhile a Scale (1986) IMF yields ergs/s/Hz per /year. If the currently fashionable Kroupa (2001) IMF proves to be more accurate, then our SFR estimates should be multiplied by ; the Kroupa conversion rate is ergs/s/Hz per /year. The conversion we adopt in Eq. 1 is employed by Hopkins (2004). Objects #1.1, #1.4, and #2.1 have star formation rates of 40, 25, and 50 , respectively. We correct these stellar values by the extinction imposed by interstellar gas and dust as: . This attenuation in magnitudes is: , where . (Calzetti et al., 2000). Upon also correcting for the magnification, we measure star formation rates (SFRs) of 4, 4, and 5 for images #1.1, #1.4, and #2.1, respectively. This SFR is roughly one-tenth lower than that found for the general LBG population of 25-52 (Shapley et al., 2003). However, it is similar to the SLLBG recently found at =4.88, for which a SFR of has been measured (Swinbank et al., 2007).
The Sextet Arcs are also rather faint, with unlensed apparent magnitudes of =, , and for #1.1, #1.4, and #2.1 respectively. The brightness for image #1.1 is three magnitudes fainter in than . This makes the Sextet Arcs quite faint, and not consistent with for the LBGs (Shapley et al., 2001). Clearly more data taken at higher resolution and along the long axis of #1.1 in particular will be well rewarded by providing spatially-resolved physical and kinematic information for this rather unusual LBG.
7 Summary and Future Work
We have undertaken a spectroscopic redshift survey and present spectra of the strongly-lensed LBG, the Sextet Arcs, at =3.038. The Sextet Arcs are remarkable for their large apparent total magnitude of . Our results are as follows:
-
1.
Spectra of the Sextet Arcs at =3.038 are presented for two different images, #1.1 and #1.4. The spectrum centered on image #2.1 is also presented, which is either a companion galaxy at the same systemic redshift of the Sextet Arcs or, as we think more likely, a different spatial region of image #1.1. This yields up to three spatial regions across a single LBG: two different parts of image #1.1, and the whole of image #1.4.
-
2.
Unusually, Ly- does not show evidence for gas motions. The velocity difference between Ly- and the low ionization interstellar absorption lines is km s-1. However, the line profile of Si IV 1394 shows broad, blueshifted absorption indicative of gas outflow.
-
3.
Across the spectra for the three images, #1.1, #1.4, and #2.1, the Ly- profile changes dramatically, and WIS decreases in strength with increasing Wα, similar to the four LBG subsamples of Shapley et al. (2003). We emphasize that for the Sextet Arcs this correlation all takes place within a single galaxy.
-
4.
Intrinsically, the Sextet Arcs have a rather modest SFR and luminosity. We infer SFR of , , and for images #1.1, #1.4, and #2.1, respectively. This SFR is very different to that found for the general LBG population, roughly one-tenth as high. The Sextet Arcs are also rather faint intrinsically, for image #1.1, which corresponds roughly to .
-
5.
The same intervening absorption system at =2.534 is seen towards our spectra of image #1.1, where it is possibly damped, and image #2.1, which is weaker. The angular separation is two arcsec on the sky, or an unlensed physical size of kpc for an estimated tangential stretch factor of four. We interpret this either as evidence of another counterimage of image #2.1, or, if it is a spatially-contiguous extension of image #2.1, of a dropoff of H I column density with radius from an origin centered on image #2.1.
-
6.
We present a spectroscopic catalog in the field of A1689 comprising 98 secure redshifts, 82 of which are arclets, 0.23 (see Tables 3 & 4). This survey increases the number of known arclets by six-fold. We augment our catalog with the spectroscopic redshifts of all known cluster members and measure a new cluster redshift for A1689 of =0.187.
LBGs with -band magnitudes brighter than 23 are still fairly rare, but no longer mere oddities. The newest member, the Sextet Arcs at =3.038 presented in this paper, is unique for showing a spatially-resolved strong intervening absorption system as well. While SLLBGs are anomalously bright, strongly-magnified, and spatially-resolved due to gravitational lensing, how their intrinsic characteristics compare with the general LBG population is still a work in progress. As more SLLBGs are discovered and studied, we will be afforded valuable information on how intrinsic properties such as the luminosity, extinction and SFR compare with the general LBG population, and more generally, with the evolutionary state of galaxies at .
Appendix A Spectroscopic Catalog
A.1 General Description
A total of 98 objects with secure redshifts in the A1689 field are presented in Tables 1 and 4. The columns are: right ascension and declination, spectroscopic redshift, magnitude, Bayesian photometric redshift, date of observation and telescope reference. Only objects with secure redshifts appear in the tables, and that we take to mean two or more spectroscopic features be detected at the 2 level in the continuum. In the case of a single emission line, we require that it be detected blueward of rest-frame H and have a photometric redshift consistent with its identification. All other objects with only one spectroscopic feature are considered insecure and not included in this catalog. The magnitude distribution of all of our objects with spectroscopic redshifts shows our catalog to be complete down to roughly .
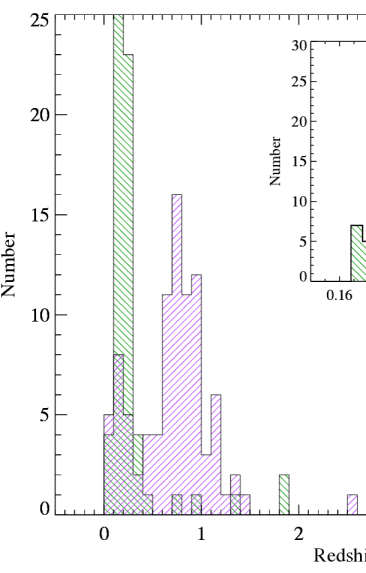
Our catalog is augmented by objects drawn from the literature. This larger catalog of spectroscopic redshifts is shown in Figure 2. The objects are divided into two categories: those from this survey (positive slope fill pattern) and all other published sources (negative slope fill pattern) that are nonredundant (Broadhurst et al., 2005; Mieske et al., 2005; Frye et al., 2002; Duc et al., 2002; Balogh et al., 2002; Teague et al., 1990). Additionally, objects in common between the catalogs were removed. In the inset is shown the redshift histogram for the cluster members from all published sources, including this catalog. Our catalog makes a significant contribution to the number of arclets. Of the 98 objects, 82 are in the background, and 72 of those are new spectroscopic redshifts. Note our 10 duplicate arclets are included in Tables 3 and 4 as they are the result of new data and are useful for the purposes of confirmation. For A1689, there are 186 cluster members in total in the ‘master’ catalog, with ten new contributions out of the 11 cluster members in our sample. From these 186 cluster members we calculate a new mean cluster redshift of =0.1872. Finally, five objects in our catalog are stars and are included in this paper for completeness.
The arcs at =3.038 were first published in Broadhurst et al. (2005), and their references are revised from Table 1 as follows: the spectroscopic redshifts for images #1.1 and #1.4 were first referenced in Broadhurst et al. (2005), and not in Frye et al. (2002) and Fort et al. (1997), as given in their Table 1. As for other catalogs, one object from the Teague et al. (1990) survey was removed as its position lies between two objects, (RA, DEC) = (13:11:30.516, -01:20:45.82). Also the positions of four objects from Mieske et al. (2005) are revised from what appears in their paper as follows: Candidate 2 (RA, DEC) = (13:11:33.11, -01:19:22.5), Candidate 3 (RA, DEC) = (13:11:29.90, -01:20:05.5), Candidate 4 (RA, DEC) = (13:11:31.09, -01:21:42.1), and Candidate 5 (RA, DEC) = (13:11:25.73, -01:21:14.8). All coordinates are J2000.
A.2 Multiply-imaged Systems
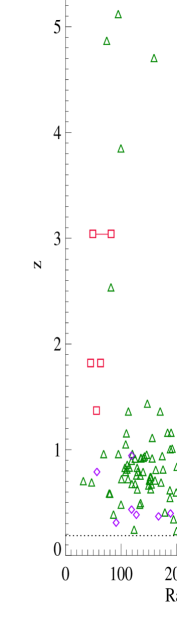
All spectroscopically-confirmed objects in the field of Abell 1689 are shown in Figure 3. The symbols denote different source references, as indicated. This survey increases the number of known background objects significantly, from 12 to 72. Six objects are clearly separated from the bulk of faint background galaxies to be at high-z () and small in radius. Note there are five high-z objects and six high-z points. The two points at =3.038 represent two images of the Sextet Arcs, which is the focus of this paper. Four images of multiply-imaged systems are in our spectroscopic sample, Sources #1.1 and #1.4 (of the Sextet Arcs), Source #2.1 (one of the Quintet Arcs) and Source #7.1. These images were introduced in Broadhurst et al. (2005), in which 30 multiply-imaged systems were identified.
The highest spectroscopically-confirmed redshifts in the A1689 field come from emission line objects at (#7.1) and at (Frye et al., 2002). Object #7.1 is triply-imaged, and FORS2 VLT data show it to have significant structure in the Lyman-series forest. The data include the region below the Lyman-limit, and will be presented in an upcoming paper. The galaxy at is new, and was also discovered with FORS2 at the VLT.
A.3 Photometric Redshifts
The photometric redshifts given in Tables 3 and 4 are derived using a Bayesian approach. The Bayesian photometric redshift (BPZ) method is described in detail in other papers (Benítez et al., 2004; Benítez, 2000), and is found to meet the requirements of a field that is faint, crowded, and magnified. The comparison of spectroscopic and photometric redshifts is shown in Figure 4. There are two clear outliers at , one object with similarly large deviance but with 95% error bars that encompass the true redshift of , and one object at . When these three objects are removed, we find the best fit BPZ redshifts agree with the spectroscopic redshifts to within .
This scatter is somewhat larger than that achieved in previous BPZ studies, with the most recent example being the Ultra Deep Field (UDF) (Coe et al., 2006). The main uncertainty in the photometric redshift calculations is traced back to the difficulty of determining reliable magnitudes for faint objects in rich cluster fields in comparison to other field studies such as the UDF or Great Observatories Origins Deep Survey (GOODS) (Mobasher et al., 2004). Our sample here is characterized by lensed objects with very low surface brightness. The images are background-limited and in many cases, extended into giant arcs, leading to larger photometric errors than comparable unlensed galaxies to similar depth, such as GOODS. Another source of uncertainty is the crowded field. Light from many of our sample galaxies is contaminated by light from cluster members. We have done our best to subtract this cluster light to improve the photometry (§3.2), but the galaxy-modeling is not perfect. Apart from the unavoidable ’root-n’ noise, the subtraction introduces both random error and an error that is filter-dependent and most prominent for the fainter objects.
Additional improvements in the photometric redshifts should result from use of the Coe et al. (2006) BPZ template set, which includes younger (bluer) starbursts. And the reported agreement between photometric and spectroscopic redshifts should tighten further once galaxies with poor SED fits (i.e., ) are removed from the comparison. These issues will all be addressed with the release of the full A1689 photometric redshift catalog (Coe et al., in prep.).
References
- Adelberger et al. (1998) Adelberger, K. L., Steidel, C. C., Giavalisco, M., Dickinson, M., Pettini, M., & Kellogg, M. 1998, ApJ, 505, 18
- Adelberger et al. (2003) Adelberger, K. L., Steidel, C. C., Shapley, A. E., & Pettini, M. 2003, ApJ, 584, 45
- Allam et al. (2006) Allam, S. S., Tucker, D. L., Lin, H., Diehl, H. T., Annis, J., Buckley-Geer, E. J., & Frieman, J. A. 2006, ArXiv Astrophysics e-prints, 11138
- Balogh et al. (2002) Balogh, M. L., Couch, W. J., Smail, I., Bower, R. G., & Glazebrook, K. 2002, MNRAS, 335, 10
- Benítez (2000) Benítez, N. 2000, ApJ, 536, 571
- Benítez et al. (2004) Benítez, N., Ford, H., Bouwens, R., Menanteau, F., Blakeslee, J., Gronwall, C., Illingworth, G., Meurer, G., Broadhurst, T. J., Clampin, M., Franx, M., Hartig, G. F., Magee, D., Sirianni, M., Ardila, D. R., Bartko, F., Brown, R. A., Burrows, C. J., Cheng, E. S., Cross, N. J. G., Feldman, P. D., Golimowski, D. A., Infante, L., Kimble, R. A., Krist, J. E., Lesser, M. P., Levay, Z., Martel, A. R., Miley, G. K., Postman, M., Rosati, P., Sparks, W. B., Tran, H. D., Tsvetanov, Z. I., White, R. L., & Zheng, W. 2004, ApJS, 150, 1
- Bertin & Arnouts (1996) Bertin, E., & Arnouts, S. 1996, A&AS, 117, 393
- Broadhurst et al. (2005) Broadhurst, T., Benítez, N., Coe, D., Sharon, K., Zekser, K., White, R., Ford, H., Bouwens, R., Blakeslee, J., Clampin, M., Cross, N., Franx, M., Frye, B., Hartig, G., Illingworth, G., Infante, L., Menanteau, F., Meurer, G., Postman, M., Ardila, D. R., Bartko, F., Brown, R. A., Burrows, C. J., Cheng, E. S., Feldman, P. D., Golimowski, D. A., Goto, T., Gronwall, C., Herranz, D., Holden, B., Homeier, N., Krist, J. E., Lesser, M. P., Martel, A. R., Miley, G. K., Rosati, P., Sirianni, M., Sparks, W. B., Steindling, S., Tran, H. D., Tsvetanov, Z. I., & Zheng, W. 2005, ApJ, 621, 53
- Bunker et al. (1998) Bunker, A. J., Stern, D., Spinrad, H., Dey, A., & Steidel, C. C. 1998, American Astronomical Society Meeting, 192, 7008+
- Calzetti et al. (2000) Calzetti, D., Armus, L., Bohlin, R. C., Kinney, A. L., Koornneef, J., & Storchi-Bergmann, T. 2000, ApJ, 533, 682
- Calzetti et al. (1994) Calzetti, D., Kinney, A. L., & Storchi-Bergmann, T. 1994, ApJ, 429, 582
- Coe et al. (2007) Coe, D., Benítez, N., Ford, H., & ACS Science Team. 2007
- Coe et al. (2006) Coe, D., Benítez, N., Sánchez, S. F., Jee, M., Bouwens, R., & Ford, H. 2006, AJ, 132, 926
- Duc et al. (2002) Duc, P.-A., Poggianti, B. M., Fadda, D., Elbaz, D., Flores, H., Chanial, P., Franceschini, A., Moorwood, A., & Cesarsky, C. 2002, A&A, 382, 60
- Ebbels et al. (1996) Ebbels, T. M. D., Le Borgne, J. F., Pèllo, R., Ellis, R. S., Kneib, J. P., Smail, I., & Sanahuja, B. 1996, MNRAS, 281, L75
- Eggen et al. (1962) Eggen, O. C., Lynden-Bell, D., & Sandage, A. R. 1962, ApJ, 136, 748
- Freeman & Bland-Hawthorn (2002) Freeman, K., & Bland-Hawthorn, J. 2002, ARA&A, 40, 487
- Frye et al. (2002) Frye, B., Broadhurst, T., & Benítez, N. 2002, ApJ, 568, 558
- Frye et al. (1997) Frye, B., Welch, W. J., & Broadhurst, T. 1997, ApJ, 478, L25
- Giallongo et al. (2002) Giallongo, E., Cristiani, S., D’Odorico, S., & Fontana, A. 2002, ApJ, 568, L9
- Halkola et al. (2006) Halkola, A., Seitz, S., & Pannella, M. 2006, MNRAS, 372, 1425
- Hopkins (2004) Hopkins, A. M. 2004, ApJ, 615, 209
- Kennicutt (1992) Kennicutt, Jr., R. C. 1992, ApJ, 388, 310
- Lemoine-Busserolle et al. (2003) Lemoine-Busserolle, M., Contini, T., Pelló, R., Le Borgne, J.-F., Kneib, J.-P., & Lidman, C. 2003, A&A, 397, 839
- Leonard et al. (2007) Leonard, A., Goldberg, D. M., Haaga, J. L., & Massey, R. 2007, ArXiv Astrophysics e-prints
- Limousin et al. (2006) Limousin, M., Richard, J., Kneib, J. ., Jullo, E., Fort, B., Soucail, G., Elíasdóttir, A., Natarajan, P., Smail, I., Ellis, R. S., Czoske, O., Hudelot, P., Bardeau, S., Ebeling, H., & Smith, G. P. 2006, ArXiv Astrophysics e-prints
- Lupton et al. (2004) Lupton, R., Blanton, M. R., Fekete, G., Hogg, D. W., O’Mullane, W., Szalay, A., & Wherry, N. 2004, PASP, 116, 133
- Lupton et al. (2001) Lupton, R., Gunn, J. E., Ivezić, Z., Knapp, G. R., & Kent, S. 2001, in ASP Conf. Ser. 238: Astronomical Data Analysis Software and Systems X, ed. F. R. Harnden, Jr., F. A. Primini, & H. E. Payne, 269–+
- Mehlert et al. (2001) Mehlert, D., Seitz, S., Saglia, R. P., Appenzeller, I., Bender, R., Fricke, K. J., Hoffmann, T. L., Hopp, U., Kudritzki, R.-P., & Pauldrach, A. W. A. 2001, A&A, 379, 96
- Mieske et al. (2005) Mieske, S., Infante, L., Hilker, M., Hertling, G., Blakeslee, J. P., Benítez, N., Ford, H., & Zekser, K. 2005, A&A, 430, L25
- Mobasher et al. (2004) Mobasher, B., Idzi, R., Benítez, N., Cimatti, A., Cristiani, S., Daddi, E., Dahlen, T., Dickinson, M., Erben, T., Ferguson, H. C., Giavalisco, M., Grogin, N. A., Koekemoer, A. M., Mignoli, M., Moustakas, L. A., Nonino, M., Rosati, P., Schirmer, M., Stern, D., Vanzella, E., Wolf, C., & Zamorani, G. 2004, ApJ, 600, L167
- Morton (2003) Morton, D. C. 2003, ApJS, 149, 205
- Pettini et al. (2002) Pettini, M., Rix, S. A., Steidel, C. C., Adelberger, K. L., Hunt, M. P., & Shapley, A. E. 2002, ApJ, 569, 742
- Pettini et al. (2000) Pettini, M., Steidel, C. C., Adelberger, K. L., Dickinson, M., & Giavalisco, M. 2000, ApJ, 528, 96
- Shapley et al. (2001) Shapley, A. E., Steidel, C. C., Adelberger, K. L., Dickinson, M., Giavalisco, M., & Pettini, M. 2001, ApJ, 562, 95
- Shapley et al. (2003) Shapley, A. E., Steidel, C. C., Pettini, M., & Adelberger, K. L. 2003, ApJ, 588, 65
- Smail et al. (2006) Smail, I., Swinbank, A. M., Richard, J., Ebeling, H., Kneib, J. ., Edge, A. C., Stark, D., Ellis, R. S., Dye, S., Smith, G. P., & Mullis, C. 2006, ArXiv Astrophysics e-prints
- Steidel et al. (1998) Steidel, C. C., Adelberger, K. L., Dickinson, M., Giavalisco, M., Pettini, M., & Kellogg, M. 1998, ApJ, 492, 428
- Steidel et al. (2003) Steidel, C. C., Adelberger, K. L., Shapley, A. E., Pettini, M., Dickinson, M., & Giavalisco, M. 2003, ApJ, 592, 728
- Swinbank et al. (2007) Swinbank, A. M., Bower, R. G., Smith, G. P., Wilman, R. J., Smail, I., Ellis, R. S., Morris, S. L., & Kneib, J. . 2007, ArXiv Astrophysics e-prints, 1221
- Teague et al. (1990) Teague, P. F., Carter, D., & Gray, P. M. 1990, ApJS, 72, 715
- Verhamme et al. (2006) Verhamme, A., Schaerer, D., & Maselli, A. 2006, A&A, 460, 397
- Yee et al. (1996) Yee, H. K. C., Ellingson, E., Bechtold, J., Carlberg, R. G., & Cuillandre, J.-C. 1996, AJ, 111, 1783
- Zekser et al. (2006) Zekser, K. C., White, R. L., Broadhurst, T. J., Benítez, N., Ford, H. C., Illingworth, G. D., Blakeslee, J. P., Postman, M., Jee, M. J., & Coe, D. A. 2006, ApJ, 640, 639
| Site | Date | Exp (h) | Grating (lines/mm) |
|---|---|---|---|
| Keck LRIS | Apr 1996 (1) | 2 | 300 at 5000 Å |
| ′′ | Apr 1996 (2) | 2 | ′′ |
| ′′ | Jun 1998 | 2.8 | ′′ |
| ′′ | Mar 1999 | 2.2 | 400 at 8500 Å |
| ′′ | Apr 1999 | 2 | ′′ |
| ′′ | Mar 2003 (1) | 1.9 | ′′ |
| ′′ | Mar 2003 (2) | 1.9 | ′′ |
| VLT FORS2 | Jun/Jul 2001 | 11 | 300 at 8600 Å |
| Magellan LDSS-2 | May 2003 | 300 at 5500 Å |
| Source # | Identification | W0 | ||
|---|---|---|---|---|
| (Å) | (Å) | Comments | ||
| #1.1 | HI | 1215.67 | ||
| Si II | 1260.42 | |||
| SiII+OI | 1303.27aaThis is the mean vacuum wavelength of O I 1302 and Si II 1304, and all quantities measured refer to the total of these two lines which are blended at our spectral resolution. | |||
| C II | 1334.53 | Blend: SiIV 1394 (=2.87) + SiII 1527 (=2.53) | ||
| SiIV | 1393.76 | |||
| SiIV | 1402.77 | Blend with FeII 1608 (=2.53) | ||
| SiII | 1526.71 | |||
| CIV | 1549.48bbThis is the mean vacuum wavelength of the C IV 1548, 1550 doublet, which is blended in this spectrum. | |||
| FeII | 1608.45 | |||
| AlII | 1670.79 | |||
| #1.4 | HI | 1215.67 | -4.0 | |
| SiII, SiII+OI, CII | 1260.42,1303.27,1334.53 | -6.7 | ||
| SiII | 1526.71 | -2.0 | ||
| #2.1 | HI | 1215.67 | 4.0 | |
| SiII, SiII+OI, CII | 1260.42,1303.27,1334.53 |
| RA | DEC | Date | Telescope | |||
|---|---|---|---|---|---|---|
| 13:11:19.289 | -01:19:43.42 | 0.228 | 22.83 0.46 | — | 96 Apr | Keck LRIS |
| 13:11:20.231 | -01:20:01.10 | 0.81 | 22.51 0.03 | 0.69 | 03 May | Magellan |
| 13:11:20.346 | -01:21:15.94 | 0.626 | 21.90 0.45 | — | 96 Apr | Keck LRIS |
| 13:11:21.056 | -01:17:31.19 | 0.733 | 21.41 0.01 | 0.65 | 03 May | Magellan |
| 13:11:21.503 | -01:17:47.40 | 0.733 | 22.80 0.03 | 0.82 | 03 May | Magellan |
| 13:11:21.853 | -01:17:26.80 | 0.733 | 23.14 0.04 | 4.41 | 03 May | Magellan |
| 13:11:22.523 | -01:20:39.43 | 0.960 | 23.03 0.02 | 0.94 | 99 Mar | Keck LRIS |
| 13:11:22.781 | -01:19:01.65 | 0.709 | 24.06 0.06 | 0.50 | 96 Apr | Keck LRIS |
| 13:11:22.843 | -01:17:06.32 | 0.66 | 22.33 0.02 | 0.70 | 03 May | Magellan |
| 13:11:24.104 | -01:18:52.65 | 0.672 | 21.96 0.01 | 0.67 | 03 May | Magellan |
| 13:11:24.155 | -01:19:56.54 | 1.155 | 21.34 0.01 | 0.96 | 98 Jun | Keck LRIS |
| 13:11:24.240 | -01:19:52.68 | 0.857 | 21.91 0.02 | 1.12 | 98 Jun | Keck LRIS |
| 13:11:24.367 | -01:19:36.87 | 0.895 | 23.75 0.06 | 0.81 | 98 Jun | Keck LRIS |
| 13:11:24.609 | -01:19:20.83 | 0.757 | 24.16 0.09 | 0.69 | 03 Mar | Keck LRIS |
| 13:11:24.652 | -01:20:03.38 | 0.481 | 21.33 0.01 | 0.48 | 96 Apr | Keck LRIS |
| 13:11:24.802 | -01:20:23.08 | 0.0 | 21.84 0.01 | 5.27 | 96 Apr | Keck LRIS |
| 13:11:24.960 | -01:19:36.61 | 0.722 | 24.23 0.11 | 0.27 | 03 Mar | Keck LRIS |
| 13:11:25.617 | -01:18:01.21 | 1.005 | 22.61 0.03 | 0.76 | 03 May | Magellan |
| 13:11:26.237 | -01:19:56.45 | 0.183 | 18.10 0.01 | 0.34 | 98 Jun | Keck LRIS |
| 13:11:26.714 | -01:19:37.49 | 0.959 | 21.0 0.42 | 0.75 | 99 Mar | Keck LRIS |
| 13:11:26.919 | -01:20:00.65 | 0.0 | 22.35 0.03 | 0.05 | 03 May | Magellan |
| 13:11:27.122 | -01:18:48.43 | 0.184 | 19.84 0.01 | 0.16 | 03 May | Magellan |
| 13:11:27.173 | -01:18:49.98 | 0.480 | 21.5 0.44 | 0.49 | 03 May | Magellan |
| 13:11:27.191 | -01:18:26.55 | 1.112 | 22.09 0.02 | 0.94 | 98 Jun | Keck LRIS |
| 13:11:27.851 | -01:20:07.65 | 0.175 | 17.48 0.01 | 0.18 | 03 May | Magellan |
| 13:11:28.221 | -01:20:50.93 | 0.703 | 22.00 0.02 | 0.26 | 03 Mar | Keck LRIS |
| 13:11:28.325 | -01:18:27.50 | 0.710 | 20.59 0.01 | 0.74 | 03 May | Magellan |
| 13:11:28.547 | -01:23:02.85 | 0.756 | 23.76 0.10 | 0.49 | 99 Mar | Keck LRIS |
| 13:11:28.685 | -01:17:37.54 | 0.231 | 22.38 0.02 | 0.14 | 01 Jun | VLT FORS2 |
| 13:11:28.886 | -01:20:01.94 | 0.180 | 21.05 0.01 | 0.20 | 96 Apr | Keck LRIS |
| 13:11:29.100 | -01:19:46.93 | 0.188 | 19.31 0.01 | 0.20 | 03 Mar | Keck LRIS |
| 13:11:30.231 | -01:22:46.10 | 0.0 | 22.68 0.03 | 4.51 | 99 Mar | Keck LRIS |
| 13:11:30.508 | -01:19:34.67 | 0.174 | 20.66 0.02 | 0.23 | 03 Mar | Keck LRIS |
| 13:11:30.677 | -01:18:55.50 | 0.676 | 23.85 0.05 | 3.87 | 03 Mar | Keck LRIS |
| 13:11:30.751 | -01:21:38.78 | 0.691 | 20.32 0.01 | 0.61 | 99 Mar | Keck LRIS |
| 13:11:31.472 | -01:21:05.94 | 0.189 | 20.62 0.01 | 0.19 | 96 Apr | Keck LRIS |
| 13:11:31.622 | -01:23:21.20 | 0.705 | 21.23 0.01 | 0.68 | 03 May | Magellan |
| 13:11:31.824 | -01:17:49.29 | 0.617 | 21.12 0.01 | 0.67 | 01 Jul | VLT FORS2 |
| 13:11:32.025 | -01:21:55.40 | 0.959 | 21.10 0.01 | 0.88 | 98 Jun | Keck LRIS |
| 13:11:32.424 | -01:24:18.19 | 1.204 | 24.17 0.08 | 1.37 | 99 Apr | Keck LRIS |
| 13:11:33.230 | -01:19:16.95 | 0.200 | 20.37 0.01 | 0.19 | 98 Jun | Keck LRIS |
| 13:11:33.028 | -01:19:14.64 | 0.790 | 22.98 0.07 | 0.82 | 96 Apr | Keck LRIS |
| 13:11:33.555 | -01:19:01.50 | 0.244 | 22.11 0.02 | 0.16 | 96 Apr | Keck LRIS |
| 13:11:33.632 | -01:22:02.00 | 0.387 | 22.92 0.04 | 0.39 | 03 May | Magellan |
| 13:11:33.950 | -01:19:15.75 | 1.362 | 22.48 0.03 | 1.49 | 98 Jun | Keck LRIS |
| 13:11:34.211 | -01:19:23.98 | 1.051 | 22.44 0.04 | 0.69 | 98 Jun | Keck LRIS |
| 13:11:34.318 | -01:19:04.93 | 0.676 | 22.60 0.02 | 0.27 | 03 May | Magellan |
| 13:11:34.900 | -01:18:35.62 | 0.918 | 22.31 0.02 | 1.10 | 96 Apr | Keck LRIS |
| 13:11:35.057 | -01:21:26.00 | 0.584 | 21.22 0.01 | 0.57 | 98 Jun | Keck LRIS |
| 13:11:35.227 | -01:20:30.16 | 0.587 | 20.64 0.01 | 0.60 | 98 Jun | Keck LRIS |
| 13:11:35.264 | -01:19:01.50 | 0.918 | 22.27 0.03 | 0.75 | 96 Apr | Keck LRIS |
| 13:11:35.619 | -01:21:52.59 | 0.722 | 23.56 0.04 | 0.65 | 03 Mar | Keck LRIS |
| 13:11:36.052 | -01:19:24.71 | 0.916 | 22.85 0.03 | 0.93 | 99 Apr | Keck LRIS |
| 13:11:36.370 | -01:19:06.25 | 0.937 | 23.66 0.05 | 1.17 | 96 Apr | Keck LRIS |
| 13:11:36.536 | -01:19:25.03 | 0.790 | 20.50 0.01 | 0.77 | 96 Apr | Keck LRIS |
| 13:11:36.638 | -01:22:32.72 | 0.790 | 24.17 0.10 | 0.84 | 98 Jun | Keck LRIS |
| 13:11:37.089 | -01:19:26.10 | 0.924 | 21.60 0.01 | 0.70 | 96 Apr | Keck LRIS |
| 13:11:37.183 | -01:21:40.60 | 0.813 | 21.78 0.01 | 0.73 | 96 Apr | Keck LRIS |
| 13:11:37.284 | -01:21:06.02 | 0.829 | 23.91 0.04 | 0.68 | 03 Mar | Keck LRIS |
| 13:11:37.577 | -01:21:24.34 | 0.831 | 22.02 0.01 | 0.75 | 98 Jun | Keck LRIS |
| 13:11:37.590 | -01:23:00.70 | 1.362 | 24.11 0.07 | 1.45 | 03 Mar | Keck LRIS |
| 13:11:37.694 | -01:19:49.79 | 0.625 | 20.95 0.01 | 0.10 | 03 May | Magellan* |
| 13:11:38.051 | -01:19:58.25 | 0.189 | 22.18 0.01 | 0.07 | 96 Apr | Keck LRIS |
| 13:11:38.239 | -01:21:42.05 | 0.214 | 21.98 0.02 | 0.72 | 03 May | Magellan |
| 13:11:38.348 | -01:22:22.76 | 0.741 | 24.00 0.10 | 0.47 | 98 Jun | Keck LRIS |
| 13:11:38.653 | -01:21:38.87 | 0.496 | 22.06 0.02 | 0.44 | 03 May | Magellan |
| 13:11:38.690 | -01:22:17.78 | 0.743 | 21.77 0.02 | 0.65 | 03 May | Magellan |
| 13:11:38.791 | -01:20:52.17 | 0.829 | 21.03 0.01 | 0.72 | 96 Apr | Keck LRIS |
| 13:11:38.846 | -01:23:41.89 | 0.600 | 20.21 0.01 | 0.61 | 03 Mar | Keck LRIS |
| 13:11:39.101 | -01:23:45.53 | 1.127 | 23.59 0.06 | 1.33 | 03 Mar | Keck LRIS |
| 13:11:39.472 | -01:22:51.09 | 1.161 | 24.21 0.08 | 0.47 | 03 Mar | Keck LRIS |
| 13:11:39.524 | -01:20:46.21 | 0.924 | 22.35 0.02 | 0.83 | 96 Apr | Keck LRIS |
| 13:11:39.544 | -01:20:13.37 | 0.953 | 24.22 0.06 | 0.79 | 96 Apr | Keck LRIS |
| 13:11:39.748 | -01:22:55.89 | 1.161 | 23.88 0.06 | 1.33 | 03 Mar | Keck LRIS |
| 13:11:39.804 | -01:21:31.52 | 0.662 | 24.19 0.06 | 0.44 | 03 Mar | Keck LRIS |
| 13:11:39.833 | -01:22:36.47 | 0.407 | 24.26 0.06 | 0.36 | 98 Jun | Keck LRIS |
| 13:11:39.891 | -01:20:31.08 | 1.436 | 23.36 0.03 | 1.94 | 03 Mar | Keck LRIS |
| 13:11:40.204 | -01:18:52.38 | 0.0 | 21.50 0.01 | 0.91 | 96 Apr | Keck LRIS |
| 13:11:40.284 | -01:23:02.45 | 0.839 | 23.91 0.07 | 0.64 | 03 Mar | Keck LRIS |
| 13:11:40.614 | -01:19:38.24 | 0.94 | 22.09 0.02 | 0.96 | 03 May | Magellan |
| 13:11:41.322 | -01:21:44.92 | 0.813 | 22.71 0.06 | 0.62 | 96 Apr | Keck LRIS |
| 13:11:41.341 | -01:22:39.09 | 0.596 | 23.91 0.12 | 0.58 | 03 Mar | Keck LRIS |
| 13:11:41.620 | -01:20:54.24 | 0.690 | 20.35 0.01 | 0.69 | 03 May | Magellan |
| 13:11:41.986 | -01:19:34.47 | 0.342 | 22.91 0.03 | 0.08 | 96 Apr | Keck LRIS |
| 13:11:42.154 | -01:19:34.06 | 1.01 | 19.35 0.01 | 0.44 | 96 Apr | Keck LRIS |
| 13:11:42.301 | -01:20:07.79 | 0.544 | 21.66 0.01 | 0.71 | 03 May | Magellan |
| 13:11:42.838 | -01:20:25.94 | 0.848 | 22.63 0.46 | — | 96 Apr | Keck LRIS |
| 13:11:43.607 | -01:20:36.93 | 0.848 | 23.26 0.46 | — | 96 Apr | Keck LRIS |
| 13:11:43.825 | -01:19:38.76 | 0.940 | 22.85 0.44 | — | 96 Apr | Keck LRIS |
| 13:11:44.466 | -01:20:30.58 | 1.161 | 22.72 0.46 | — | 96 Apr | Keck LRIS |
| 13:11:46.056 | -01:20:51.94 | 0.0 | — | — | 96 Apr | Keck LRIS |
| RA (J2000) | Dec (J2000) | NameaaPublished name from Broadhurst et al. (2005), where available | |||||
|---|---|---|---|---|---|---|---|
| 13:11:26.450 | -01:19:56.75 | Sextet1.1 | bbBroadhurst et al. (2005) | 3.03 0.53 | 23.34 0.01 | 22.55 0.01 | 22.40 0.01 |
| 13:11:26.281 | -01:20:00.26 | 1.2 | 3.04 0.53 | 24.33 0.01 | 23.60 0.01 | 23.51 0.01 | |
| 13:11:29.777 | -01:21:07.48 | 1.3 | 3.27 0.56 | 25.23 0.02 | 24.53 0.02 | 24.48 0.02 | |
| 13:11:33.063 | -01:20:27.40 | 1.4 | ccFrye et al. (2002) | 2.94 0.52 | 24.67 0.13 | 24.03 0.01 | 24.02 0.01 |
| 13:11:31.935 | -01:20:06.00 | 1.5 | 3.35 0.57 | 25.46 0.03 | 24.63 0.02 | 24.56 0.02 | |
| 13:11:29.853 | -01:20:38.41 | 1.6 | 1.06 | 25.02 0.05 | 24.18 0.05 | 23.94 0.06 | |
| 13:11:26.523 | -01:19:55.45 | Quintet2.1 | 2.534ddThis paper | 2.62 0.48 | 23.56 0.01 | 23.27 0.01 | 23.07 0.01 |
| 13:11:32.783 | -01:20:27.60 | 2.2 | 2.54 | 24.03 0.01 | 23.85 0.01 | 23.76 0.01 | |
| 13:11:31.776 | -01:20:09.24 | 2.3 | 2.54 | 24.29 0.02 | 24.06 0.02 | 24.10 0.02 | |
| 13:11:29.616 | -01:21:07.92 | 2.4 | 2.54 | 24.42 0.02 | 24.23 0.02 | 24.14 0.02 | |
| 13:11:29.689 | -01:20:41.28 | 2.5 | 2.54 | 24.26 0.03 | 23.45 0.03 | 23.04 0.03 | |
| 13:11:29.938 | -01:19:14.65 | 3.770bbBroadhurst et al. (2005) | 4.58 0.73 | 24.98 0.12 | 24.13 0.90 | ||
| 13:11:24.066 | -01:18:47.17 | 4.705ccFrye et al. (2002) | 0.73 | ||||
| 13:11:25.449 | -01:20:51.84 | #7.1 | 4.868bbBroadhurst et al. (2005) | 4.92 0.78 | 26.70 0.67 | 25.12 0.12 | 23.48 0.03 |
| 13:11:34.991 | -01:19:51.07 | 5.120bbBroadhurst et al. (2005) | 4.94 0.78 | 26.59 0.70 | 25.58 0.18 |