Ion condensation on charged patterned surfaces
Abstract
We study ion condensation onto a patterned surface of alternating charges. The competition between self-energy and ion-surface interactions leads to the formation of ionic crystalline structures at low temperatures. We consider different arrangements of underlying ionic crystals, including single ion adsorption, as well as the formation of dipoles at the interface between charged domains. Molecular dynamic simulation illustrates existence of single and mixed phases. Our results contribute to understanding pattern recognition, and molecular separation and synthesis near patterned surfaces.
pacs:
61.46.-w, 64.60.-i, 81.07.-b, 87.68.+zThe interaction of molecules with surfaces or interfaces is a fundamental problem in modern science. Advances in molecular design and maturity of nanoscale microscopy paved the way in a number of novel technological achievements, such as the ability to produce nano-structured surfaces AndelmanScience1995 ; GrovesPRL2005 ; MirkinScience1999 , and complex self-assembled aggregates KalerJCP1992 ; ZembNature2001 ; StuppScience2001 ; Olvera . Periodic and spatially organized surfaces can be used as templates for fabricating nanostructures, magnetic storage media, nanowires JJdePabloNature2003 , or substrates for control of cell adhesion and growth GrovesLangmuir2001 ; Sackmann2005 . From a scientific point of view, charged surfaces and their interactions with ionic environments are particularly interesting due to the long-range nature of electrostatic interactions and its relative independence from molecular structure. The break down of the mean field Poison-Boltzmann approximation to describe adsorption of ions to charged surfaces MarceljaCPL1984 motivated many studies. Simple models such as a single component plasma near a neutralizing background revealed two-dimensional crystallization of adsorbed ions onto homogeneously charged surfaces RouzinaJPhysChem1996 . That is, the electrostatic repulsion between condensed ions results in lateral correlations.
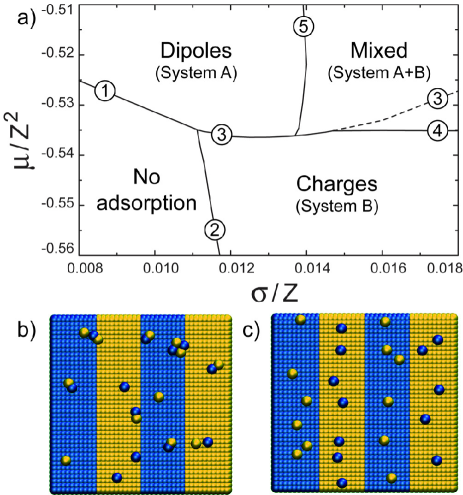
In this letter we study ion condensation on a planar surface with periodic domains of alternating charge. In particular, we consider striped patterns of width and constant surface charge number density (Fig. 1(a)). The half-space above the plane is filled by a solution of positive and negative ions with valency , radius and bulk number density . We consider a symmetric system with ions of equal valency. At low temperatures, the homogeneously charged regions of the surface attract oppositely charged ions. The long-range electrostatic interaction induces periodic arrangement of condensed ions within the plane in analogy with Wigner crystals Madelung . The competition between ion-ion and ion-surface electrostatic interactions, together with the geometrical restrictions set by the surface patterns determine the structure of the ionic crystal. When the ion-ion interaction dominates, we find the formation of dipolar pairs along the interfaces between the surface patterns (Fig. 1(b)). On the other hand, when the ion-surface interaction dominates, the ions localize where the electrostatic potential is strongest, at the center of the stripes (Fig. 1(c)). It is the goal of this letter to formulate an approach that captures the essential physics of the phenomenon and gives a reasonable description of ion condensation near patterned surfaces.
We model the adsorption and the interaction of the ions between themselves and with the surface as follows. The free energy of the absorbed ions is purely electrostatic and includes contributions from interactions between the ions and surface as well as between ions. The free energy of the ions in the bulk is dominated by their translational entropy. We note that the bulk ions are screened from the surface by the condensed ions within the Gouy-Chapman length RouzinaJPhysChem1996 , . This allows us to consider the layer of adsorbed ions separately form the bulk. Equilibrium between the two regions is achieved when the chemical potentials of condensed ions, , and bulk ions, , are equal . Equivalently, this condition can be stated as the requirement that the excess energy of the condensed ions , per unit area , be a minimum with respect to the condensed ion density and arrangement. We write this effective free energy as:
| (1) |
where is Bjerrum length, is a surface number density of condensed ions, is the Madelung constant of a crystal of condensed charged units, is a number of ions per unit, is the energy of ion-surface interaction, and is the self-energy of the condensed units. The condensed unit can be single ion () with zero self energy, , dipole composed of two opposite charges (), with , or more complex structure like a chain or a cluster of ions.
The minimum of the free energy is determined by evaluating and comparing the values of expression Eq. 1 for different ion densities and lattice symmetries. The key step in these evaluations is the determination of the Madelung constant for the basic arrangements of ions (Fig. 1(a,b)). This constant is the effective potential experienced by a charged unit due to the presence of a lattice of similar units. For the system of dipoles (Fig. 1(b)), we have
| (2) |
where and are lattice indices, is a dipole momentum of magnitude , is the electric field at the position . The sum over integers and runs from to and the prime over summation indicates the avoidance of singularity at the vector . Due to the constant width of the stripe, the separation distance between condensed ions along the stripe can be written as , where is the number of positively charged ions in the Wigner crystal cell. For the case of ion absorption to the center of the stripe (Fig. 1(c)), we obtain:
| (3) |
where is the potential at position . These sums can be calculated using Ewald summations Ewald , following, for example, the methods developed by Crandall Crandall . For the dipolar case, which does not pose convergence problems, faster techniques are available Lekner ; Sperb . Besides these two basic arrangements, we have also calculated Madelung constants for lattices with a relative translation along the stripe for adjacent lines of ions. We find that both lattices shown in Fig. 1(b,c) have the lowest energies.
The electrostatic potential near the striped surface (Fig.1(a)) is given by
| (4) |
where is an electron charge (negative), is a surface number charge density, is the width of a stripe and
| (5) |
where determines the shift from the center of the stripe along the axis. Using the identity Sperb the electrostatic potential can be calculated exactly:
| (6) |
The magnitude of the potential decays exponentially and has sinusoidal profile with extremum in the center of the stripes. Thus, the energy of the single charge in the center of the stripe (Fig. 1(c)) is and the energy of the dipole at the interface (Fig. 1(b)) is
In order to investigate the phase behavior of the system first we determine the conditions for ion adsorption into each of the two states. The adsorption of ions into a regular structure starts when the bulk chemical potential is lower than the critical value implicitly determined from the equation:
| (7) |
when we consider the free energy as a function of the chemical potential. It is equivalent to appearance of the first non-trivial extremum of the free energy. This conditions (Eq.7) can be solved exactly for two types of condensed ionic lattices. In the limit of small surface charge density, the adsorption starts from the formation of the dipoles along the boundary of the surface patterns (Fig. 1(b)), due to the weak interaction with the surface. The critical chemical potential for the system of condensed dipoles reads
| (8) |
It is important to note that it is independent. With further increase in the surface charge density, the energy of the electrostatic attraction to the surface overcomes the energy of the dipole formation and the ionic crystal of condensed ions changes its structure. The new ionic crystal (Fig. 1(c)) has a simple rectangular lattice and is formed from the single ions located in the minima of the surface electrostatic potential. The critical chemical potential in that case is
| (9) |
The transition from one structure to another occurs at critical surface charge density
| (10) |
when the energy of both systems are equal, or equivalently, both have the same chemical potential. The critical surface charge density determines the beginning of the coexistence line , which separates regimes for condensed ions forming ionic crystals of dipoles (Fig. 1(b)) from the one of the ionic crystals of single charge (Fig. 1(c)).
Once one of the condensation conditions is satisfied, the associated ions form structures with well defined densities . In these conditions, the density of the condensed ions can be calculated from
| (11) |
for the corresponding lattice symmetry. The preferred symmetry of the ionic crystal is determined by direct comparison of the two energy minima achieved by each of the structures considered. We note that at the transition between structures, when both energies are equal, the associated density is different, and the transition between phases is first order.
The stability of phases A and B is determined as follows. Phase A is composed of dipolar units, and in general, the addition of one more dipole does not reduce the energy. However, the introduction of an isolated ion at the center of an oppositely charged stripe might indeed reduce the energy, signaling the fact that phase A is no longer the minimum-energy conformation. Similarly, we consider the addition to a background of stripe centered ions, phase B, of a single dipole at the interface between two oppositely charged stripes. When these perturbations reduce the energy of the phase with least energy (between A and B), the actual minimum of that state corresponds to a more complex structure. It is likely that the actual minimum structure is a combination of both striped-centered ions and dipoles, denoted here as a mixed phase. For example, for the dipole phase A, the instability criteria reads:
| (12) |
where is the energy of the ion-surface interaction, and
| (13) |
is the energy of a single ion at the center of the stripe in the presence of the dipolar array (Fig. 1(b)), and is a modified Bessel function of first order. The spinodal boundary (when the system is first unstable), appears at values of the chemical potential for which . The spinodal boundary for the stripe-centered case is labelled .
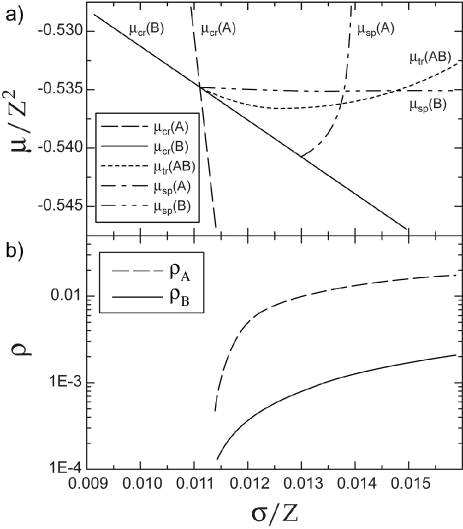
We illustrate these results for the cases and . Figure 2(a) shows the dependence of the critical chemical potential vs. surface charge density for systems of both symmetries (Eqs. 8 and 9). The condition of equal chemical potential between phases A and B determines the coexistence boundary line . Figure 2(a) also shows the location of the spinodal curves for the dipole , and the centered states. Along the coexistence line between phases A and B, the system undergoes a first order phase transition associated with the jump in the density of condensed ions. Figure 2(b) shows the dependence of the density for both systems along the coexistence line. Figure 3(a) summarizes results in a schematic phase diagram in terms of the surface charge density and the chemical potential normalized by the valency of the ions.
Figure 2(a) shows two basic features of the boundaries of stability for the dipolar and centered structures. Note that the spinodal line for the stripe centered state, system B, lies approximately at a constant chemical potential. At lower values of the potential, it is simply more convenient to add single ions at the center of the stripe. Reciprocally, the limit of stability of the dipolar state, system A, appears at near constant value of the surface charge. This surface charge density determines the strength of the electric field at the interface between stripes, and sets the energy gain for a deposited dipole. For strong enough values of the charge density, the energy of the stripe centered state can be lowered by adding dipoles at the boundaries. Large values of both, chemical potential and charge density, lead therefore to the complex mixed state in the upper right corner of our phase diagram.
We explore finite temperature effects in the phase diagram with molecular dynamics simulations. Condensed ions form dipoles along the interfaces and single ions lie in the center (Fig.3(b,c)). The strong correlation between ions, is preserved even at relatively high temperature ; thermal fluctuations do not destroy the long range order. In our simulations we have found, in addition to dipole and single charge phases, chain clusters and paired dipoles suggesting rather complex phase behavior previously found mostly in the bulk FisherPhysicaA1996 ; dePabloPRL2002 .
Our exploration of the low temperature limit of ion condensation onto a structured surface shows that there are many different controllable behaviors that a fixed surface pattern can generate. It seems plausible to use the properties of condensed ions to create complex, tunable structures at interfaces that exhibit a variety of potential applications. For example, electrostatic charge on membrane surface can be used to attract free vesicles or membrane-coated charged microbeads GrovesLangmuir2003 to employ intermembrane adhesion and lipids exchange with substrate-supported patterned membrane. Another example, a new more effective and selective method, compared to previous DNA fractionation techniques, was demonstrated using streaming dielectrophoresis of DNA on the Si surface with micro-scaled Au strips RafailovichPRL2007 . Control of the abundance of the charged species can lead to dramatic transitions, that can be used as catalytic steps of complex chemical reactions, as steps in the formation of secondary self-assembled structures superimposed on a simpler pattern. Though our analysis is focused only on two basic behaviors, stripe-centered, and dipolar arrangements, we show the existence of more complicated, mixed, phases. We expect, in fact, a cascade of transitions between all these complex phases.
This work is supported by NSF grant numbers DMR-0414446 and DMR-0076097. The authors thank G. Vernizzi for helpful and stimulating discussions.

References
- (1) M. Seul, and D. Andelman, Science, 267, 476 (1995).
- (2) R. Parthasarathy, P. A. Cripe, and J. T. Groves, Phys. Rev. Lett., 95, 048101 (2005).
- (3) R. D. Piner, J. Zhu, F. Xu, S. Hong, and C. A. Mirkin, Science, 283, 661 (1999).
- (4) E. W. Kaler, K. L. Herrington, A. K. Murthy, and J .A. N. Zasadzinski, J. Phys. Chem., 96, 6698 (1992).
- (5) M. Dubois, B. Deme, T. Gulik-Krzywicki, J. C. Debieu, C. Vautrin, E. Perez and T. Zemb, Nature, 411, 672 (2001).
- (6) J. D. Hartgerink, E. Beniash, and S. I. Stupp, Science 294, 1684 (2001).
- (7) F. J. Solis, S. I. Stupp, and M. Olvera de la Cruz, J. Chem. Phys. 122, 054905 (2005); Y. S. Velichko, and M. Olvera de la Cruz, Phys. Rev. E 72, 041920 (2005); S. M. Loverde, Y. S. Velichko, and M. Olvera de la Cruz, J. Chem. Phys., 124, 144702 (2006).
- (8) S. O. Kim, H. H. Solak, M. P. Stoykovich, N. J. Ferrier, J. J. de Pablo, and P. F. Nealey, Nature, 424, 411 (2003).
- (9) J. T. Groves, L. K. Mahal, and C. R. Bertozzi, Langmuir, 17, 5129 (2001).
- (10) M. Tanaka, and E. Sackmann, Nature, 437, 656 (2005).
- (11) R. Kjellander, and S. Marcelja, Chem. Phys. Lett., 112, 49 (1984).
- (12) I. Rouzina, and V. Bloomfield, J. of Phys. Chem., 100, 9977 (1996).
- (13) R. P. Feynman, R.B. Leighton, M. Sands, The Feynman Lectures in Physics (Addison-Wesley, Reading, 1964) sect. II.8.3.
- (14) P. Ewald, Ann. Phys. Lpz., 64, 253 (1921).
- (15) R. E. Crandall, and J. P. Buhler, J. Phys. A:Math. Gen., 20, 5497 (1987).
- (16) J. Lekner, Physica A, 176, 485 (1991).
- (17) R. Sperb, Mol Sim., 20, 179 (1998).
- (18) Y. Levin, and M. E. Fisher, Physica A, 225, 164 (1996); J. M. Romero-Enrique, G. Orkoulas, A. Z. Panagiotopoulos, and M. E. Fisher, Phys. Rev. Lett., 85, 4558 (2000).
- (19) Q. Yan, and J. de Pablo, Phys. Rev. Lett., 88, 095504 (2002).
- (20) A. R. Sapuri, M. M. Baksh, and J. T. Groves, Langmuir, 19, 1606 (2003).
- (21) E. Petersen, B. Li, X. Fang, H. Luo, V. Samuilov, D. Gersappe, J. Sokolov, B. Chu, and M. Rafailovich, Phys. Rev. Lett., (in press).