On Gene Duplication Models for Evolving Regulatory Networks
1 Abstract
Background: Duplication of genes is important for evolution of molecular networks.
Many authors have therefore considered gene duplication as a driving force in shaping
the topology of molecular networks. In particular it has been noted that growth via
duplication would act as an implicit way of preferential attachment,
and thereby provide the observed broad degree distributions of molecular networks.
Results: We extend current models of gene duplication and rewiring by
including directions and the fact that molecular networks are not a result of unidirectional
growth. We introduce upstream sites and downstream shapes to quantify potential links
during duplication and rewiring. We find that this in itself generates the observed scaling
of transcription factors for genome sites in procaryotes. The dynamical model can generate a
scale-free degree distribution, , with exponent in the
non-growing case, and with when the network is growing.
Conclusions: We find that duplication of genes followed by substantial recombination of upstream regions could generate main features of genetic regulatory networks. Our steady state degree distribution is however to broad to be consistent with data, thereby suggesting that selective pruning acts as a main additional constraint on duplicated genes. Our analysis shows that gene duplication can only be a main cause for the observed broad degree distributions, if there is also substantial recombinations between upstream regions of genes.
2 Background
Molecular networks are the result of an intricate interplay between history and function. While it is difficult to quantify this interplay, it is possible to develop a frame which allows us to analyze the consequence of simple stochastic aspects of evolutionary rearrangements in network architectures. The driving force in generating new genes in genomes is gene duplication [1, 2, 3, 4, 5]. In fact [6] estimates that about 90% of eucaryotic genes are a result of gene duplication. Accordingly we will consider a simplified evolutionary process where regulatory networks are evolved by random gene duplication, and by random rewiring of genetic regulatory links. This has been done before [7, 8, 9, 10, 11, 12, 13, 14, 15, 16] and [17]. For persistently growing networks it has been shown that the process of duplication in itself provides convincing scale-free networks [13].
This paper analyzes gene duplication in terms of a model which explicitly incorporates upstream and downstream regions for each gene, and thereby incorporates directed links. This setup has some similarity with the binary string simulation of [17]. The separation between regulators and regulated proteins in itself opens for a new perspective on scaling of regulators versus system size, a feature which was also considered in the directed growth model of [15]. Further we focus on non-growing networks, where duplication of one gene on average is associated with removal of another. This situation is particularly suited for single cell organisms, which should be regulated at the same level of complexity as they were a billion years ago. Finally we will discuss the functional composition of hubs, and argue that their composition evolves by recombining upstream regions of different genes with each other.
3 Results
3.1 The model
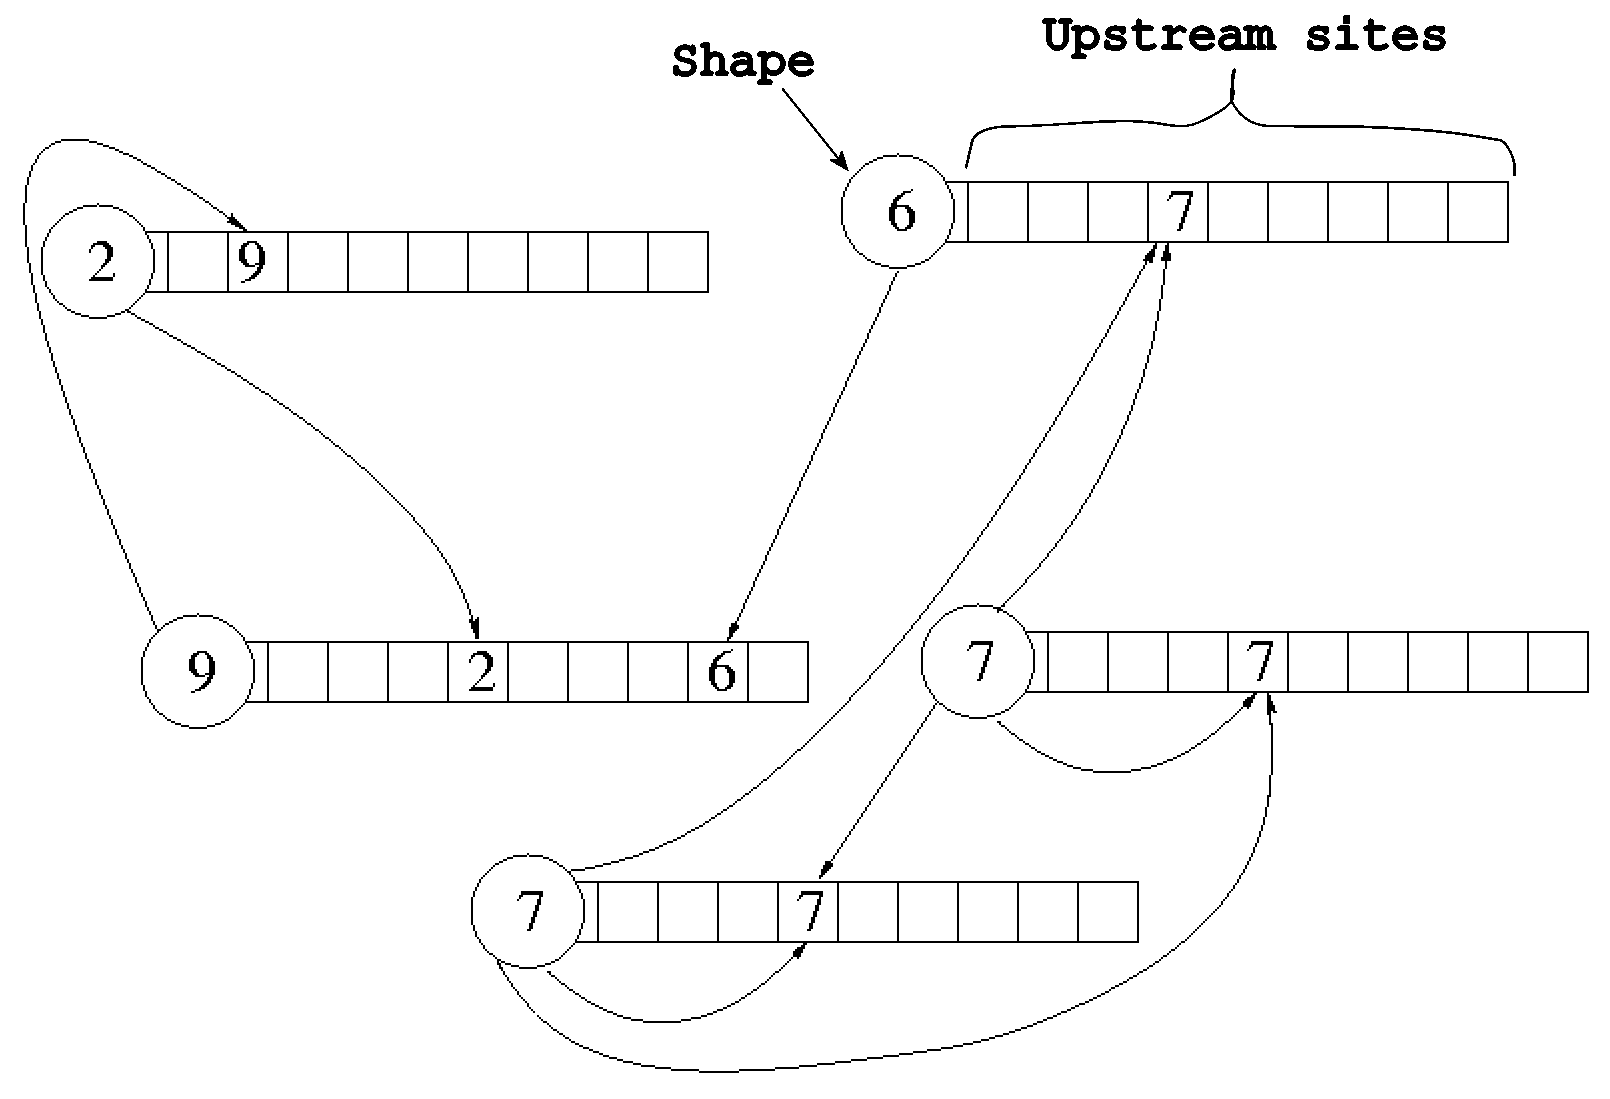
Genes code for proteins, which in turn have highly specific surfaces that code for their binding to other macromolecules, including particular “operator” sites on the DNA. When a protein binds to such an operator site it can regulate nearby genes in the DNA, and thereby act as a transcription factor. Each gene has a set of upstream operator sites, and its production can be regulated by proteins binding to any of these sites. In this way genes build genetic regulatory networks, with upstream regulation defined by operator sequences, and downstream regulation set by the shape/surface of the encoded protein.
The regulatory options (out links) of a regulatory protein are associated with its shape, and the potential ways to regulate a protein are in our model associated with the proteins upstream operator sites. Both the shape and the operator sites are assigned integer numbers. When an operator site has a number, it is regulated by any protein with the same “shape number”. That is, if protein A’s shape matches an upstream site of another protein B then A will control B. An example is found in Fig. 1 where the protein with the shape number 6 regulates the protein with the shape number 9.
Our model is defined in terms of proteins, which can be duplicated or removed. Each protein is assigned one of different shape numbers. Further each protein has a number of operator sites, which each likewise is assigned one of the shape numbers.
By assigning numbers to all proteins and their upstream targets one defines a directed regulatory network. The topology of this network depends on both the diversity of possible numbers, as well as the number of upstream sites for each protein. For example, if we only have two different numbers () and one upstream site (), the probability of a directed link from a random protein A to another random protein B will be . If, on the other hand, we are selecting among random numbers, the probability of having such a link will be . Any protein/gene with at least one out-link is in effect a transcription factor.
We are now in a position to describe the model. Initially each node is assigned random shape and upstream numbers. Subsequently we at each evolutionary step evolve the network by either duplicating or mutating a random node (protein). That is, at each time step one preforms one of the following steps:
-
•
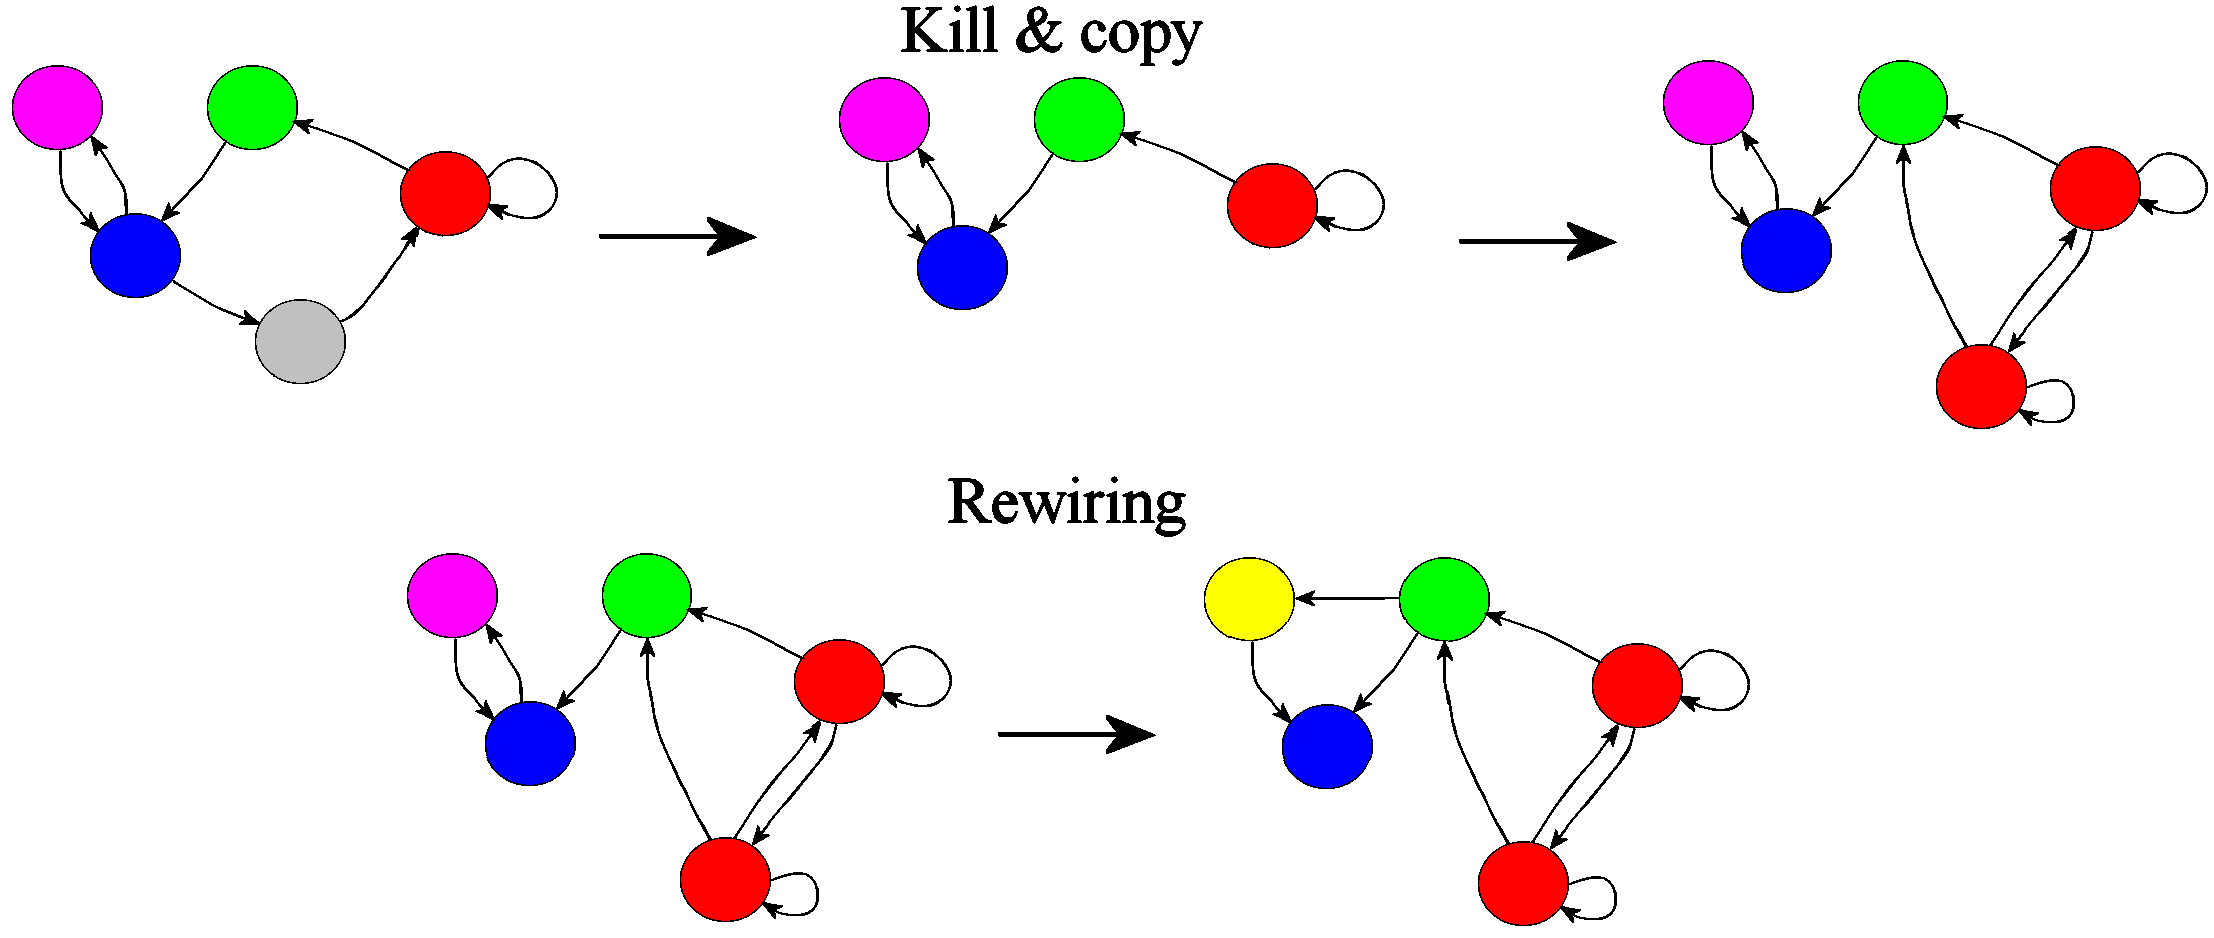
With probability one duplicates a node and its upstream region, by making a complete copy of both the integers representing the upstream and the ones representing the shape. Subsequently one removes a random node and all its upstream sites.
-
•
With probability one changes the shape number of a node.
-
•
With probability one selects random sites among all the upstream sites in the system. Each of these chosen sites is assigned a new random number.
On network level these moves effectively define respectively a duplication and kill move as illustrated in Fig. 2 and a rewiring mutation also illustrated in Fig. 2. The selection of one of 3 possible steps implies that the behavior of the model depends on 2 key parameters: The ratio of duplication to rewiring, , and the ratio of protein mutations to operator mutation . When is large, duplication dominates over rewirings. When , the shapes of proteins mutate faster than typical operator sites on the DNA.
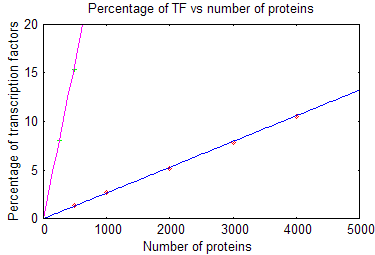
Existing data on scaling of gene regulation constrains the parameters in our model since the ratio of to influences the fraction of transcription factors. For procaryotes Stover et al. [18, 19] found the scaling relation between the number of transcription factors and the system size :
| (1) |
In our model a blind (=random) assignment of numbers to shapes and upstream sites implies that the probability that a given protein is a transcription factor equals the probability that its shape number appears in one of the upstream sites in the total system:
| (2) | |||||
| (3) |
In simulation of our model at steady state we find that also for and also that the prefactor in this scaling chages. We obtain an approximate relation for the fraction of transcription factors at steady state:
| (4) |
with and . This relation is accurate within 1% as long as the fraction of transcription factors is less than 20%.
In Fig. 3 we illustrate the predicted behavior of for a value of that provide the observed scaling for networks sampled in steady state of our model. In general, for small we always obtain the observed linear relationships, with a slope of that increases with the (site) mutation rate .
3.2 Model predictions
Fig. 4 shows two networks of size N=500, one taken as a snapshot of a network evolved at constant , the other being the result of a growing network when it reached size . The figure illustrates that the growing network has smaller hubs (highly connected transcription factors) than the steady state one. This is because growth limits the time normally needed to develop a large hub.
Apart from the directed links and the possibility of having isolated nodes, the growing model is similar to the models of [10] and [7], and thus provides a similar scale-free degree distribution, with frequency distribution of degree scaling as . In contrast the steady state distribution gives either an exponential distribution, or an exceptionally broad scale-free degree distribution, .
In Fig. 5 we investigate the simplest steady state model with only one upstream target, , for various parameter choices. The main observation is that a small shape mutation rate is consistent with a scale-free in-degree distribution, whereas a small upstream mutation rate opens for scale-free out-degree distribution. Intuitively this is because a protein with a large out-degree looses its links when its downstream operator targets mutate. This preferential “punishment” of large out-degrees prevents the development of large hubs.
Overall we emphasize that the model easily generates a very broad degree distribution, which in steady state always scale as . Also we see that the model is consistent with a narrow in-degree distribution, and therefore in principle could be made consistent with the broad out-degree and narrow in-degree found in gene regulatory networks, see for example [20]. When considering “in between” models where we allow growth of the network, one can obtain out-degree distributions of the form with . The exponent increases as the ratio of duplication events to node removal events increases.
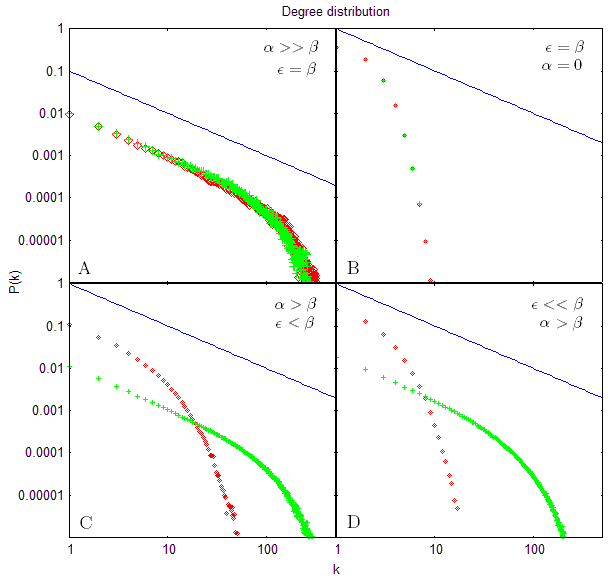
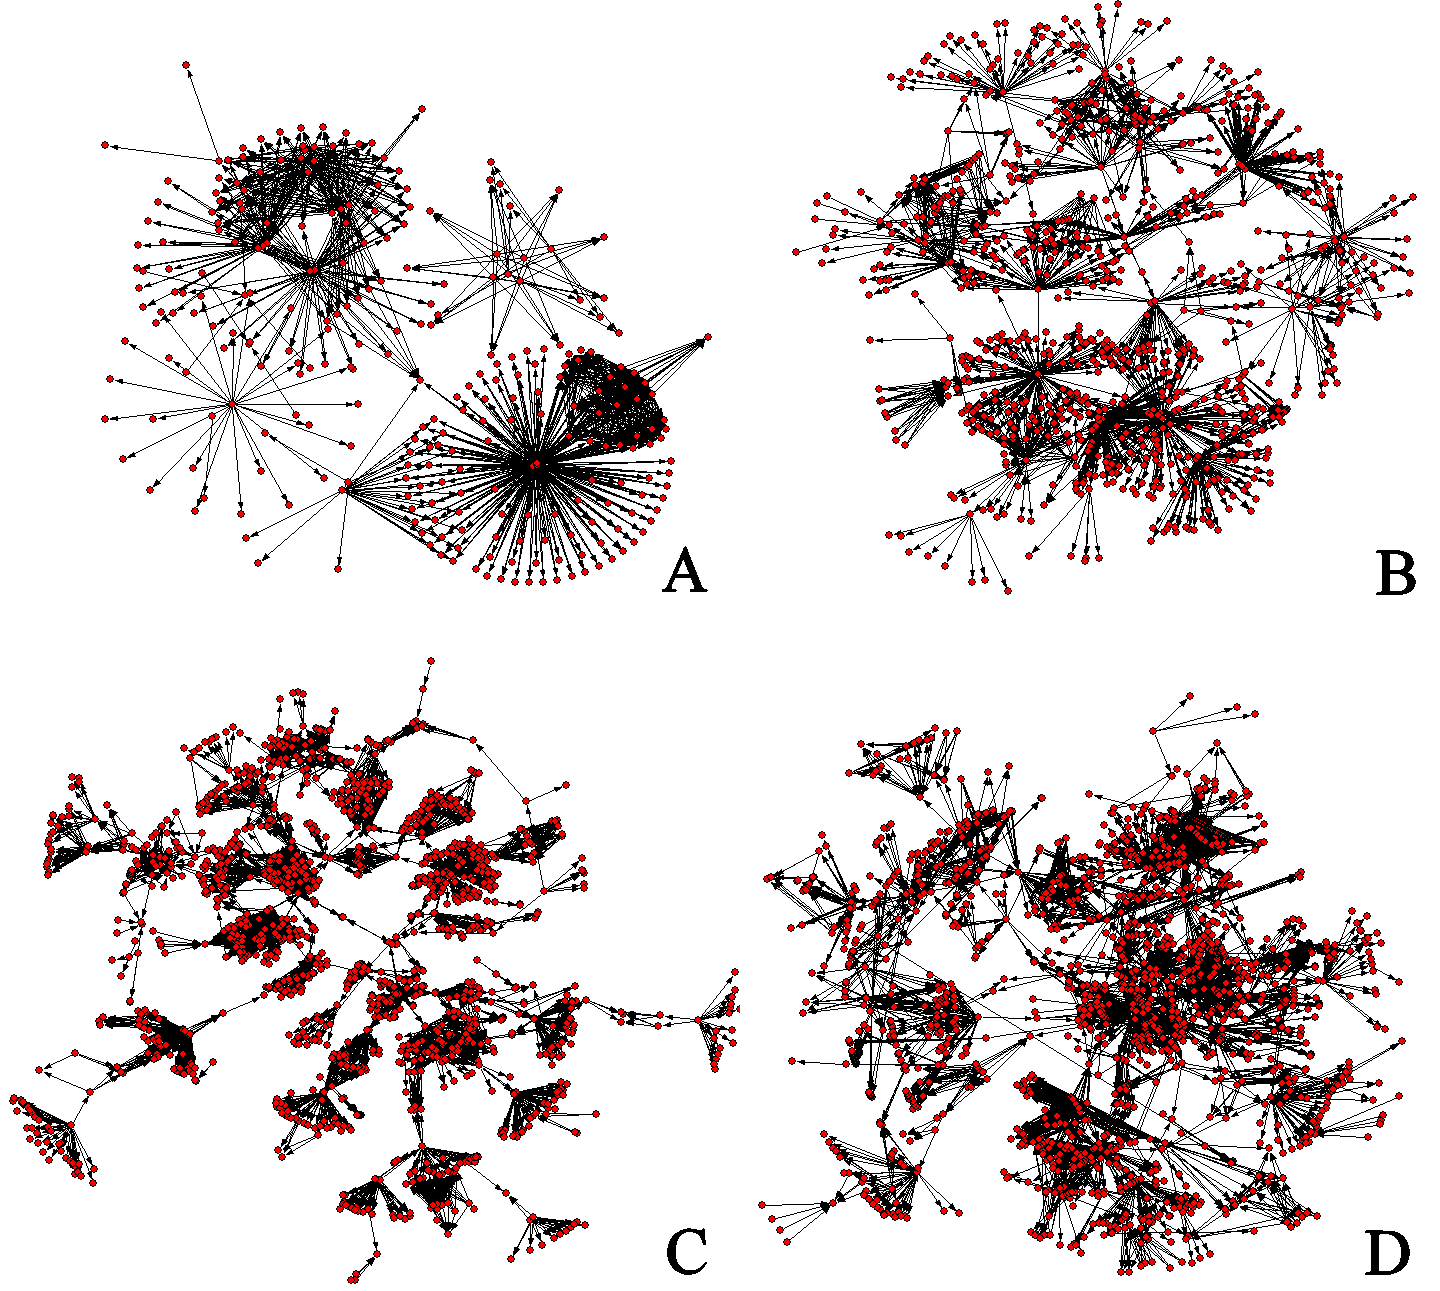
Figure 6 shows snapshots of networks at different sizes, each simulated at steady state. Panel A),B),C) illustrates the increased interconnectedness as the fraction of transcription factors increases with system size, as indeed expected from the scaling shown in Fig. 3. The last panel, Fig. 6D) is for the same system size as in C), and illustrates that the topology varies hugely in time. This is a consequence of any duplication model, where duplication of just one large hub instantly increases the number of links in the system substantially. Similar fluctuations were reported in the phage-bacteria model of Rosvall et al.[21], which also included duplication.
3.3 Analysis
To understand the scaling behavior of our model we simplify it into a scheme where single independent integers are duplicated or annihilated. In terms of the network model the integers may correspond to either the shape or the upstream region. We do not consider any links in this analysis, but simply count the amount of integers with identical values. In the language of our network model, it corresponds to the assignment of a single number to each node. If many nodes have the same number, they correspond to the target genes from a single hub. The partitioning of all nodes into such groups, corresponds to assignment of genes according to their upstream regulators.
The simple “integer model” is defined in terms of time steps, where numbers are removed and added. At each time step one removes one number. Further one adds a number by either copy another node or mutating by selecting a new random number: With probability one copies an already existing number. If a number is not copied one instead generates a new random number.
Let count the number of integers with value . The basic moves are:
| (5) | |||||
| (6) |
The randomization is made for a random shape whereas the duplication move is made for an already represented shape selected with probability . Similarly the “kill move” is executed on a shape selected with . Thus the probability to copy or kill one of the integers with value is:
| (7) |
Using steady state for the number of integers we find:
| (8) |
or
| (9) |
This simplified model can be generalized to the growing case. This is done by abandoning the removal step in the model. In that case one at each time step either copies a number (with probability ) or adds a new integer. This model closely resembles the rich gets richer model by Simon [22] that predict
| (10) |
where takes a value . for , whereas the distribution becomes steeper when is smaller (for explanation see the classic paper of H. Simon [22]). Such exponents are found in preferential attachment models, in the duplication-kill models of [10] and [7] as well as in the strictly growing version of the above model.
4 Discussion
We have presented a model that recapitulates previous models for duplication and rewiring, and in addition addresses the limitations of the duplication-mutation idea. We discus the validity of this class of models by making a list of pro and contra arguments. On the pro side, we found that the duplication and rewiring can:
-
•
Give broad out-degree distribution and narrow in-degree distribution. Out-degree is tunable by both growth rates of network and by number of duplication events per rewiring event.
-
•
Be compatible with the known scaling behavior of transcription factors with number of genes in the genome of various organisms.
-
•
Give a network with distinct hubs and rather few feedback loops. Real transcription networks indeed have remarkably few feedback loops. The biological feedback in procaryotes is mostly associated with metabolic molecules [23].
Arguing against duplication/rewiring model we find that:
-
•
Scale-free out-degree requires that the upstream sites of a gene evolve much slower than the shape of the proteins which form the transcription factors. This seems at odds with data [24], where analysis of diverging paralogs in at least yeast indicates that upstream sites evolve fast compared to “shape” as quantified through protein-protein binding partners.
-
•
The model predicts that proteins regulated by the same highly connected transcription factor should be related. There is little evidence for substantial evolutionary relationships between similarly regulated workhorse proteins (see [6]).
-
•
The scaling exponent for obtained scale-free out-degree distribution is in the steady state case, which is the most realistic scenario for single celled organisms. This is substantially broader than the reported for yeast [20].
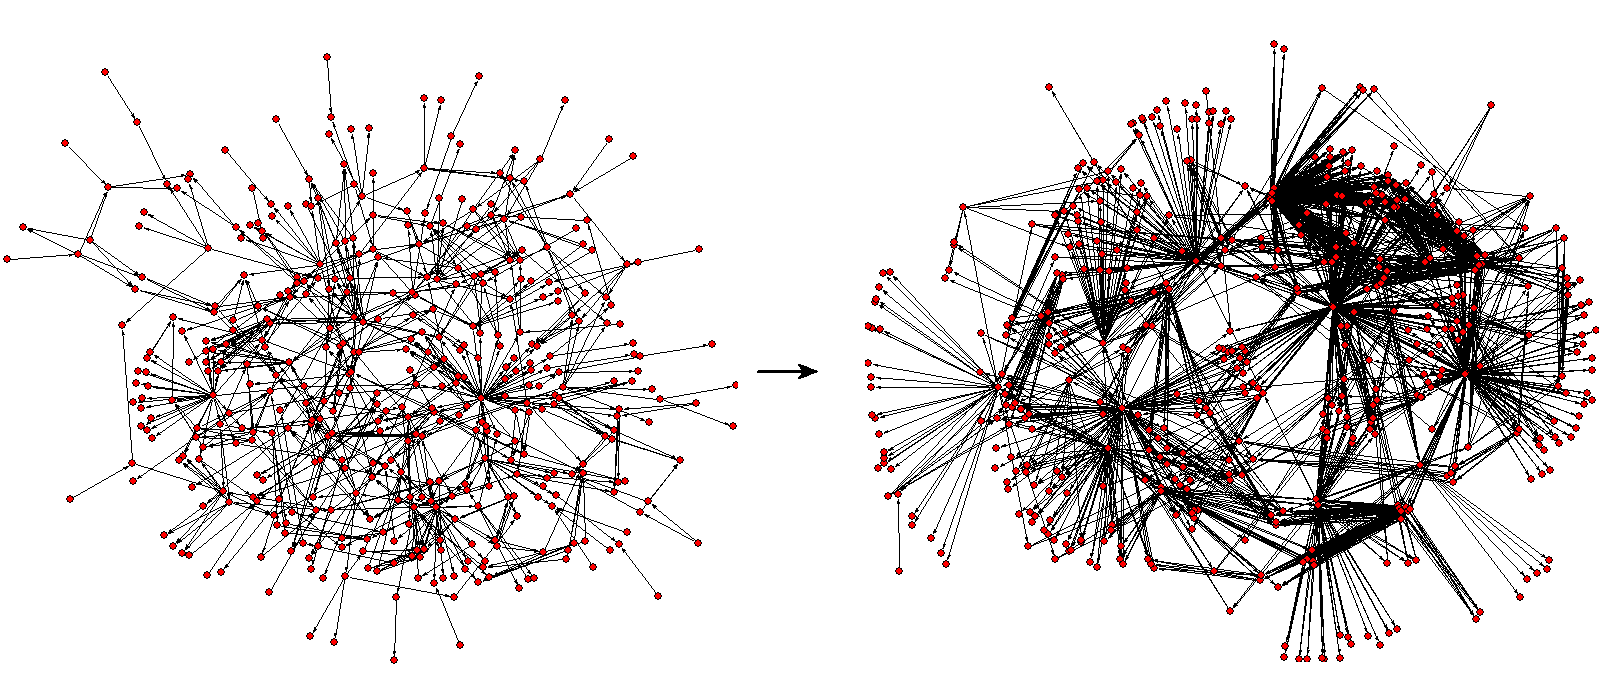
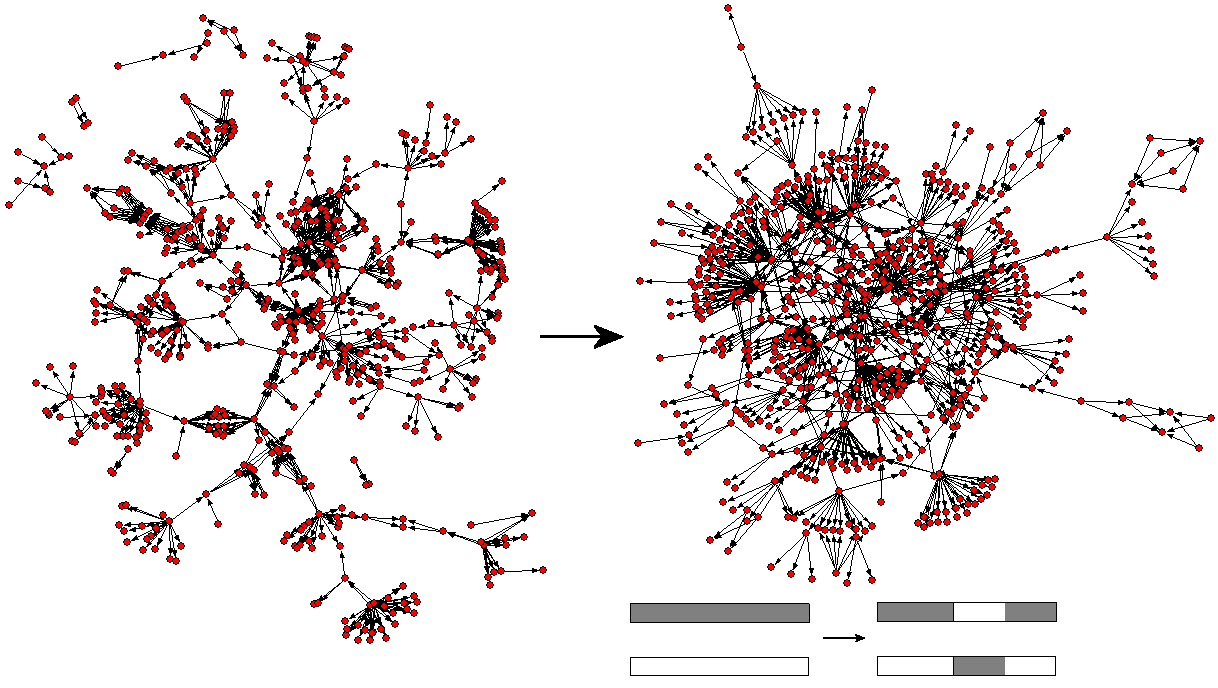
In regards to the first contra-point above, upstream sites could be allowed to evolve much faster provided that the mutational changes mostly consist of recombination events and not random point-mutations. Recombination events can be represented in our model by segment reshuffling. That is we introduce upstream mutations which consist of exchanging a random fraction of one upstream region by the corresponding upstream region of another protein. By doing this frequently, the evolving network develops a more integrated network architecture. This is illustrated in Fig. 7.
Concerning local network properties, we found that recombination of upstream regions leaves both the number of transcription factors and the out-degree distributions nearly unchanged. By recombining upstream regulatory regions, the cell could maintain a low upstream point mutation rate, , and at the same time have a high total upstream mutation rate.
Overall we find that the duplication/rewiring scenario indeed has some appealing consequences, but also that it must be supplemented by a relatively rapid recombination of upstream regulatory regions in order to be plausible. Frequent recombinations also help us to understand why proteins in the same hub typically are unrelated to each other [6]. Extensive re-engineering of upstream regions allows hubs to emerge by duplication, while their content is shaped by newly recombined upstream regions.
Even though a simple stochastic model fits certain rough scale characteristics of regulatory networks, this in no way proves that these evolutionary moves are the cause of the observed degree distribution. Our modeling only demonstrated that duplication with recombination of upstream regions is not at odds with present knowledge. The real dynamics of evolving networks need to involve a heavy bias from their functional roles. A bias which indeed is also needed in order to prune the steady state out-degree distribution from the obtained distribution to something that is narrow enough to be compatible with real regulatory networks.
References
- [1] Alexey G. Murzin, Steven E. Brenner, Tim Hubbard, and Cyrus Chothia. Gene duplication in h. influenzae. Nature, 378:140, Nov 1995.
- [2] Bal zs Papp, Csaba P l, and Laurence D. Hurst. Evolution of cis-regulatory elements in duplicated genes of yeast. Trends in Genetics, 19(8):417–422, Aug 2003.
- [3] Sarah A. Teichmann, Jong Park, and Cyrus Chothia. Structural assignments to the mycoplasma genitalium proteins show extensive gene duplications and domain rearrangements. Biochemistry, 95:14658–14663, 1998.
- [4] Julian Gough, Kevin Karplus, Richard Hughey, and Cyrus Chothia. Assignment of homology to genome sequences using library of hidden markov models that represent all proteins of known structure. J. Mol. Biol., 313:903–919, 2001.
- [5] Zhenglong Gu, Dan Nicolae, Henry H-S. Lu, and Wen-Hsiung Li. Rapid divergence in expression between duplicate genes inferred from microarray data. Trends in genetics, 18(12):609–613, Dec 2002.
- [6] Sarah A Teichmann and M Madan Babu. Gene regulatory network growth by duplication. Nature Genetics, 36(5):492–496, May 2004.
- [7] Ricard V. Sol , Romualdo Pastor-Satorras, Eric Smith, and Thomas B. Kepler. A model of large-scale proteome evolution. Advances in Complex Systems, 5(1):43–54, 2002.
- [8] J.Kim, P.L. Krapivsky, B Kahng, and S. Redner. Infinite-order percolation and giant fluctuations in a protein interaction network. Physical Review E, 66:66–69, 2002.
- [9] Ashish Bhan, David J. Galas, and Gregory Dewey. A dublication growth model of gene expression networks. BIOINFOMATICS, 18(11):1486–1493, 2002.
- [10] Fan Chung, Linyuan Lu, T. Gregory Dewey, and David J. Galas. Dublication models for biological networks. Journal of Computational Biology, 10(5):677–687, 2003.
- [11] Nikolay V. Dokholyan, Boris Shakhnovich, and Eugene I. Shakhnovich. Expanding protein universe and its origin from the biological big bang. PNAS, 99(22):14132–14136, Oct. 2002.
- [12] Alexei Vazquez, Alessandro Flammini, Amos Maritan, and Alessandro Vespignani. Modeling of protein interaction networks. Complexus, 1:38–44, Mar 2003.
- [13] Iaroslav Ispolatov, P. L. Krapivsky, and A. Yuryev. Duplication-divergence model of protein interaction network. Physical review E, 71(061911), 2005.
- [14] Andrey Rzhentsky and Shawn M. Gomez. Birth of scale free molecular networks and the number of distinct dna and protein domains per genome. BIOINFOMATICS, 17(10):988–996, 2001.
- [15] Derrell V. Foster, Stuart A. Kauffman, and Joshua E. S. Socolar. Network growth models and genetic regulatory networks. Physical Review E, 73(031912), 2006.
- [16] Johannes Berg, Michael L ssig, and Andreas Wagner. Structure and evolution of protein interaction networks: A statistical model for link dynamics and gene duplications. BMC Evolutionay Biology, 4(51), 2004.
- [17] P. Dwight Kuo, Wolfgang BanZhaf, and Andr Leier. Network topology and the evolution of dynamics in an artificial genetic regulatory network model created by whole genome duplication and divergence. Biosystems, 85, 2006.
- [18] C. K. Stover et al. Compleate genome sequence og pseudomonas aeruginosa pa01, an opportunistic pathogen. Nature, 406, Aug 2000.
- [19] Erik van Nimwegen. Scaling laws in the functional contents of genomes. Trends in genetics, 19:479–484, 2003.
- [20] Sergei Maslov and Kim Sneppen. Computational architecture of the yeast regulatory network. Physical Biology, 2:94–100, 2005.
- [21] Martin Rosvall, Ian B. Dodd, Sandeep Krishna, and Kim Sneppen. Network models of phage-bacteria coevolution. Phys. Rev. E., 74, 2006.
- [22] Herbert A. Simon. On a class of skew distribution functions. Biometrika, 42(3/4):425–440, 1995.
- [23] Sandeep Krishna, Anna M. C. Andersson, Szabolcs Semsey, and Kim Sneppen. Structure and function of negative feedback loops at the interface of genetics and metabolic networks. Nucleic Acid Research, 34(8):2455–2462, 2006.
- [24] Sergei Maslov, Kim Sneppen, Kasper Asrup Eriksen, and Koon Kiu Yan. Upstream plasticity and downstream robustness in evolution of molecular networks. BMC Evolutionary Biology, 4(9), 2004.