Fluidization of a vertically oscillated shallow granular layer
Abstract
Molecular dynamics simulations are used to study fluidization of a vertically vibrated, three-dimensional shallow granular layer. As the container acceleration is increased above , the granular temperature and root mean square particle displacement increase, gradually fluidizing the layer. For nearly elastic particles, or low shaking frequencies, or small layer depths, the end of the fluidization process is marked by an abrupt increase in the granular temperature and rms particle displacement. The layer is then fully fluidized since macroscopic, fluid-like phenomena such as convection rolls and surface waves are observed. Increasing the total dissipation (by either decreasing the restitution coefficient or increasing the total number of particles) decreases the increase in granular temperature and rms particle displacement at fluidization, and shifts the increase to higher accelerations. Increasing the frequency also decreases the magnitude of the jump, and shifts the change to lower accelerations.
pacs:
45.70.-n,64.70.Dv,05.70.Fh, 07.05.TpI Note from authors
After further investigations, we find that the results for the temperature and rms displacement at low depend on the functional form of the velocity dependence of the restitution coefficient. Changing the dependence from to significantly reduces both and at low . The event-driven algorithm used in the present work has been tested and found to work well for situations where most collisions occur at high velocities, but this algorithm is less accurate for situations where many collisions occur at low velocities, as in the present work. Hence the results we have presented should be checked with an model that is more accurate for low velocity collisions.
II Introduction
Granular materials are collections of many dissipative particles, which can behave as either a solid or a fluid Jaeger et al. (1996). To maintain a fluid-like state, energy must be continually supplied to the grains since it is dissipated during collisions. Often this energy input is realized by shaking a container vertically; the non-dimensional shaking acceleration is given by , where is the acceleration due to gravity, the shaking amplitude, and the shaking frequency. With increasing the behavior of the granular layer changes from solid-like to fluid-like. This fluidization does not occur abruptly at a particular but rather is a process that develops over a range in . Even for , there is relative motion of the particles Pöschel et al. (2000); Renard et al. (2001), and the contact forces between particles show rich dynamics Umbanhowar and van Hecke (2005). As is increased above unity, the particles start to move randomly on length scales small compared to their diameter. This has been measured with laser speckle methods, where it was also found that in deep layers, upper layers fluidize first and then the fluidization proceeds downward Kim et al. (2002) with increasing . The onset of macroscopically visible motion occurs at , depending on the experimental conditions Mujica and Melo (1998).
Quasi two-dimensional geometries allow the study of the fluidization of vertically vibrated layers using direct imaging. Studies of horizontal monolayers have examined crystallization Reis et al. (2006) and the coexistence of different phases that occur during fluidization Olafsen and Urbach (1998, 2005); Nie et al. (2000); Prevost et al. (2004); Götzendorfer et al. (2005). In a vertical, initially crystalline layer a distinct jump in the height of the center of mass of the particles was found as the layer fluidized Götzendorfer et al. (2006).
We present here results from fully three-dimensional molecular dynamics simulations of a shallow granular layer. The process of fluidization is accompanied by a smooth increase in temperature and particle mean square displacement that culminates in an abrupt increase for high coefficient of restitution, or low shaking frequency, or small layer depth. We identify this abrupt change with the end of the fluidization process.
III Molecular Dynamics Simulation
The event driven molecular dynamics simulation described in Bizon et al. (1998) was used for this study. The number of frictional, rotational spheres of diameter used was varied to determine the dependence of fluidization on the layer depth, . The total number of particles was , corresponding to a volume fraction of 0.58 at rest. The container was a box , in the ,, and directions, respectively, with the direction being opposite to gravity. The bottom plate oscillated sinusoidally, . The non-dimensional frequency, , was varied from 0.08 to 0.25. Unless otherwise noted, periodic boundary conditions were imposed in the and directions to avoid convection induced by frictional sidewalls Knight et al. (1993, 1996); Talbot and Viot (2002); Wildman et al. (2001). Surface waves were prevented from forming by choosing the horizontal dimensions () to be smaller than the pattern wavelength, which was found to be in simulations in a large box for a layer with depth , frequency , and .
The parameters characterizing the particles are the coefficient of normal restitution (the ratio of the relative normal velocity after collision to that velocity before collision), the coefficient of friction , and the tangential restitution , which gives the change in the relative surface velocity Bizon et al. (1998); Walton (1993). For this study, and were fixed at and , which were the values used to reproduce surface wave patterns observed experimentally in oscillated layers of lead spheres Bizon et al. (1998). The normal restitution depended upon the relative normal velocity, , of the colliding particles according to: , as in Bizon et al. (1998). The minimum value of , , was varied from to .
Simulations were started from random initial conditions at . After 300 plate oscillation cycles, was reduced by 0.02. Particle positions and velocities were recorded in at the phase where the plate was at its mean position and moving upwards. This procedure was repeated with decreasing by 0.02 each time until the particle collisions became too frequent for the event-driven algorithm to be usable Luding and McNamara (1998). This limited our investigations to 1.6, but we found that the accessible range in included the transition to full fluidization.
IV Results
IV.1 Fluidization
The horizontal granular temperature is the kinetic energy of the relative random motion of the particles,
| (1) |
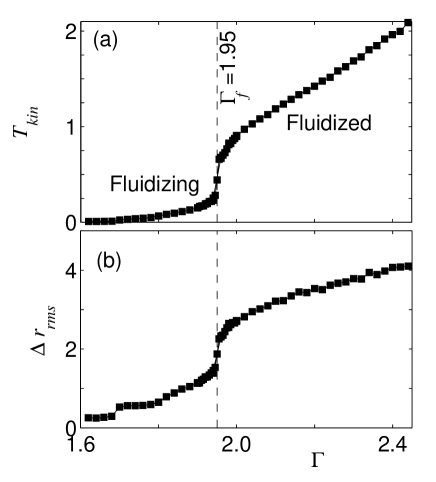
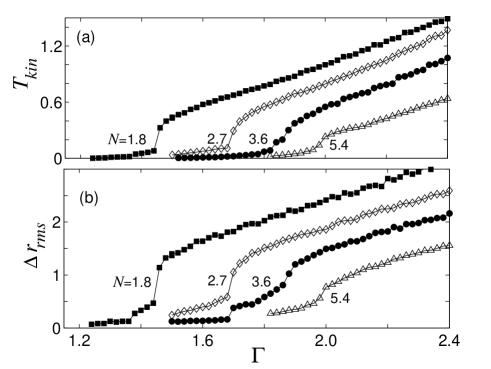
where the averages are taken over all the particles and has been made nondimensional by dividing it by the gravitational potential energy of a single particle raised by a height equal to its diameter. The averages are taken only in a horizontal plane to minimize the influence of the vertical shock wave Bougie et al. (2002). An example of the dependence of on is shown in Fig.1(a). A sharp increase in is evident in the range .
We compare with the root mean square displacement,
| (2) |
where and are the and positions of a particle at time . To minimize the impact of particles crossing the periodic boundary on the measurement, the average is computed over all particles at least from the boundary at . The rms displacement for cycle(Fig. 1(b)) exhibits an increase at , just as found for (Fig.1(a)).
We define as fluidization the process that begins when and ends at , the acceleration where the abrupt increase in and occurs. After the increase, the layer is defined as vibrofluidized. This transition is history independent and non-hysteretic: it occurs at the same whether decreasing from 3.00 or increasing from 1.84, for step sizes that were as small as 0.01.
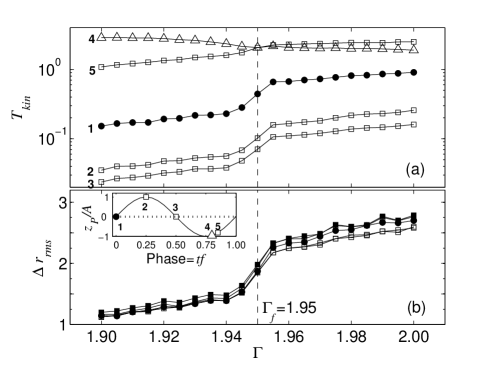
The granular temperature and density of vertically oscillated layers depend on the phase of the plate oscillation because, after each impact of the layer with the plate, a shock propagates upward through the layer Bougie et al. (2002). The phase dependence of and was examined for twenty equally spaced phases throughout a cycle, and all but one phase were found to yield similar behavior (Fig. 2). The one phase that yielded a different dependence on is labeled 4 in Fig. 2; at this point in the cycle the plate is near its minimum height and moving upward, which is where the shock has the greatest effect Bougie et al. (2002). However, the shock quickly travels through the layer, and its effects are negligible for most of the cycle. We therefore recorded data at the phase when the plate was at its mean position and moving upward.
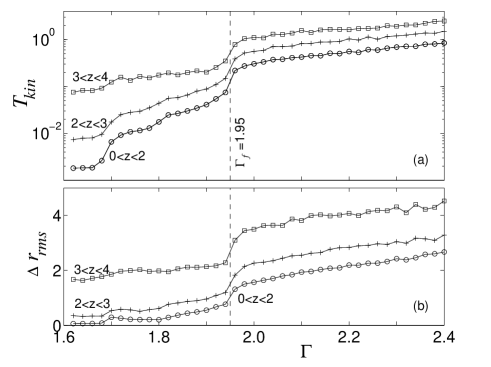
Just as the vertical forcing may add a dependence on the phase of the driving cycle, it also creates gradients in the direction. The top layers are more fluidized than the lower layers, as Fig. 3 illustrates. While the fluidization process proceeds more rapidly for the topmost layers, it does not complete until all layers have fluidized (3). Similar behavior was found for .
IV.2 Dependence on System Parameters
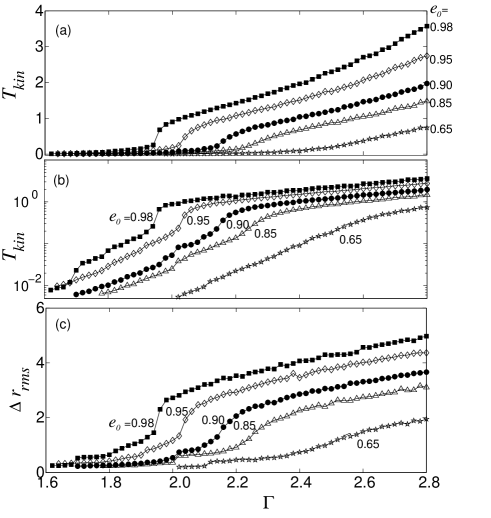
Changing the normal restitution coefficient has a dramatic effect on the granular temperature and rms displacement, as shown in Fig. 4. The transition to the fully fluidized state is most pronounced for our highest restitution value, , and becomes less obvious as is decreased; for the lowest restitution value examined, , no transition is discernible. As is decreased, the fully fluidized state is reached at higher : for , ; for , .
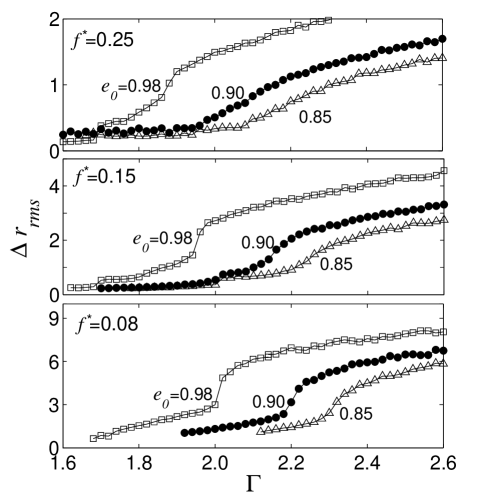
The dependence of on and is compared for three frequencies in Fig. 5. Increasing the frequency makes the fluidization process more gradual and decreases . For example, for (with ), , while if is increased to 0.25, .
Increasing the layer depth leads to a less pronounced increase in and , and the increase is shifted to higher (Fig. 6). For , the end of the fluidization process occurs at , while for the change is smaller and . Thus, as the total dissipation of the system increases, either by decreasing the restitution coefficient or by increasing the number of collisions (by adding more particles), the change from the fluidizing to the fluidized state becomes less pronounced and increases.
After the layer has completed the fluidization process, fluid-like phenomena appear in addition to the increases in and . For example, as is well known, surface waves appear at , Bizon et al. (1998); Umbanhowar and Swinney (2000); Melo et al. (1994), where Mujica and Melo (1998). We have done some simulations in a container large enough to accommodate waves and have found that waves emerge in a thin layer at about , while for a deeper layer, pattern onset occurs for (see Table 1). Additional simulations were made for a container with solid frictional lateral walls, and a single convection roll was found to develop at , the same at which the fluidization process completes (Table 1).
| Phenomenom | ||||||
|---|---|---|---|---|---|---|
| Waves | 1.95 | 0.98 | 5.4 | 0.22 | ||
| Waves | 0.85 | 3.6 | 0.15 | |||
| Convection | 2.24 | 2.24 | 0.85 | 3.6 | 0.15 |
IV.3 Comparison with Experiment
Comparing these simulations to experiment is problematic. Measurements of the granular temperature or rms displacement in a three-dimensional experiment are challenging since the trajectories of the grains in the bulk of the layer can not be recorded with just a simple video camera. Recently speckle visibility has been developed to measure the granular temperature in a 3D sample Dixon and Durian (2003) and should be utilized to fully explore this process.
Umbanhowar and Swinney investigated the transition to surface waves for systems with similar layer depths and frequency using the pressure exerted by the layer on the bottom plate. They therefore recorded data at a different point in the driving cycle than was used in this work. In addition, the fluidization process may have completed at a lower value than they report for the pattern transition as in our own work (Table 1) Umbanhowar and Swinney (2000).
Two groups have studied fluidization in deep layers ( in Mujica and Melo (1998) and in Kim et al. (2002)) and have reported that the fluidization of the layer begins at the top and proceeds downward as is increased. Evidence of this top down fluidization can be seen in Fig. 3. Particles higher in the container are in a more fluidized, but fluidization is completed at the same value of for particles at all heights studied.
V Discussion
We have shown that in shallow layers of nearly elastic particles, abrupt increases of both the granular temperature and the root mean square displacement indicate that the process of fluidization is completed. If the dissipation in the system is increased by adding more particles or decreasing the coefficient of restitution, the increases in granular temperature and rms displacement at full fluidization become more and more gradual.
While the granular temperature and root mean square displacement are good indicators of the onset of the vibrofluidized state, the question remains if there exists a single control parameter for the fluidization of a vertically oscillated granular sample. The non-dimensional acceleration is not satisfactory since layers with different characteristics fluidize at different values of . The value of the temperature depends on the phase of the cycle, and both the rms displacement and at the onset of the vibrofluidized state depend on granular parameters such as coefficient of restitution and layer depth. Thus they do not make good measures. Others have suggested , but this measure does not collapse our data since we find a different dependence on than that reported in Götzendorfer et al. (2006). We hope that our results will inspire further work on the process of fluidization in three-dimensional granular layers.
The authors thank William McCormick and Chris Krülle for helpful discussions. This work is supported by the Robert A. Welch Foundation grant F-0805.
References
- Jaeger et al. (1996) H. M. Jaeger, S. R. Nagel, and R. P. Behringer, Rev. Mod. Phys. 68, 1259 (1996).
- Pöschel et al. (2000) T. Pöschel, T. Schwager, and C. Salueña, Phys. Rev. E 62, 1361 (2000).
- Renard et al. (2001) S. Renard, T. Schwager, T. Pöschel, and C. Salueña, Eur. Phys. J. E 4, 233 (2001).
- Umbanhowar and van Hecke (2005) P. Umbanhowar and M. van Hecke, Phys. Rev. E 72, 030301(R) (2005).
- Kim et al. (2002) K. Kim, J. J. Park, J. K. Moon, H. K. Kim, and H. K. Pak, J. Kor. Phys. Soc. 40, 983 (2002).
- Mujica and Melo (1998) N. Mujica and F. Melo, Phys. Rev. Lett. 80, 5121 (1998).
- Reis et al. (2006) P. M. Reis, R. A. Ingale, and M. D. Shattuck, Phys. Rev. Lett. 96 (2006).
- Olafsen and Urbach (2005) J. Olafsen and J. Urbach, Phys. Rev. Lett. 95, 098002 (2005).
- Prevost et al. (2004) A. Prevost, P. Melby, D. Egolf, and J. Urbach, Phys. Rev. E 70, 050301 (R) (2004).
- Olafsen and Urbach (1998) J. S. Olafsen and J. S. Urbach, Phys. Rev. Lett. 81, 4369 (1998).
- Götzendorfer et al. (2005) A. Götzendorfer, J. Kreft, C. A. Kruelle, and I. Rehberg, Phys. Rev. Lett. 95, 135704 (2005).
- Nie et al. (2000) X. Nie, E. Ben-Naim, and S. Y. Chen, Europhys. Lett. 51, 679 (2000).
- Götzendorfer et al. (2006) A. Götzendorfer, C.-H. Tai, C. A. Kruelle, I. Rehberg, and S.-S. Hsiau, Phys. Rev. E 74 (2006).
- Bizon et al. (1998) C. Bizon, M. Shattuck, J. Swift, W. McCormick, and H. Swinney, Phys. Rev. Lett. 80, 57 (1998).
- Talbot and Viot (2002) J. Talbot and P. Viot, Phys. Rev. Lett. 89, 064301 (2002).
- Knight et al. (1993) J. B. Knight, H. M. Jaeger, and S. R. Nagel, Phys. Rev. Lett. 70, 3728 (1993).
- Knight et al. (1996) J. B. Knight, E. E. Ehrichs, V. Y. Kuperman, J. K. Flint, H. M. Jaeger, and S. R. Nagel, Phys. Rev. E 54, 5726 (1996).
- Wildman et al. (2001) R. D. Wildman, J. M. Huntley, and D. J. Parker, Phys. Rev. Lett. 86, 3304 (2001).
- Walton (1993) O. Walton, in Particulate Two-Phase Flow, edited by M. Roco (Butterworth-Heinemann, Boston, 1993), p. 884.
- Luding and McNamara (1998) S. Luding and S. McNamara, Granular Matter 1, 113 (1998).
- Bougie et al. (2002) J. Bougie, S. J. Moon, J. B. Swift, and H. L. Swinney, Phys. Rev. E 66, 051301 (2002).
- Umbanhowar and Swinney (2000) P. B. Umbanhowar and H. L. Swinney, Physica A 288, 344 (2000).
- Melo et al. (1994) F. Melo, P. Umbanhowar, and H. L. Swinney, Phys. Rev. Lett. 72, 172 (1994).
- Dixon and Durian (2003) P. K. Dixon and D. J. Durian, Phys. Rev. Lett. 90, 184302 (2003).