Infrared spectroscopy of HCOOH in interstellar ice analogues
Abstract
Context. HCOOH is one of the more common species in interstellar ices with abundances of 1–5% with respect to solid H2O. With the launch of the Spitzer Space Telescope new infrared spectra have become available of interstellar ices in different environments. So far systematic laboratory studies on HCOOH-containing interstellar ice analogues are lacking.
Aims. This study aims at characterizing the HCOOH spectral features in astrophysically relevant ice mixtures in order to interpret astronomical data.
Methods. The ices are grown under high vacuum conditions and spectra are recorded in transmission using a Fourier transform infrared spectrometer. Pure HCOOH ices deposited at 15 K and 145 K are studied, as well as binary and tertiary mixtures containing H2O, CO, CO2 and CH3OH. The mixture concentrations are varied from 50:50% to 10:90% for HCOOH:H2O. Binary mixtures of HCOOH:X and tertiary mixtures of HCOOH:H2O:X with X = CO, CO2, and CH3OH, are studied for concentrations of 10:90% and 7:67:26%, respectively.
Results. Pure HCOOH ice spectra show broad bands which split around 120 K due to the conversion of a dimer to a chain-structure. Broad single component bands are found for mixtures with H2O. Additional spectral components are present in mixtures with CO, CO2 and CH3OH. The resulting peak position, full width at half maximum and band strength depend strongly on ice structure, temperature, matrix constituents and the HCOOH concentration. Comparison of the solid HCOOH 5.9, 7.2, and 8.1 m features with astronomical data toward the low mass source HH 46 and high mass source W 33A shows that spectra of binary mixtures do not reproduce the observed ice features. However, our tertiary mixtures especially with CH3OH match the astronomical data very well. Thus interstellar HCOOH is most likely present in tertiary or more complex mixtures with H2O, CH3OH and potentially also CO or CO2, providing constraints on its formation.
Key Words.:
Astrochemistry, Line: profiles, Molecular data, Molecular processes, Methods: laboratory, ISM: molecules, Infrared: ISM1 Introduction
Formic acid is one of the few molecules in star forming regions that is detected both in the solid state and in the gas phase (see e.g., Schutte et al., 1999; Ikeda et al., 2001). Infrared observations of ices in high mass Young Stellar Objects (YSOs) with the Infrared Space Observatory (ISO) contain absorption features that are assigned to HCOOH and that correspond to the C=O stretch, (C=O), at 5.9 m and the OH and CH bending modes, (OH) and (CH) at 7.2 m (Schutte et al., 1997, 1999). The (C=O) band is the strongest spectral feature of HCOOH ice, but suffers from partial overlap with the OH bending mode of solid H2O at 6 m, (OH). The (OH/CH) band at 7.2 m is significantly weaker than the (C=O) band, but is present in a relatively clean region and has previously been detected toward high mass star forming regions (Schutte et al., 1999). More recently, these features have also been observed toward low mass YSOs and possibly toward background stars (Boogert et al. in prep.; Knez et al., 2005). Typical abundances of HCOOH vary between individual sources from 1 to 5% with respect to solid H2O. The aim of this paper is to study the (C=O), (OH/CH) and other infrared features of HCOOH ices in different astrophysically relevant laboratory matrices and to compare the results with astronomical spectra to infer the chemical environment of HCOOH in interstellar ices.
In the gas phase HCOOH is detected in envelopes surrounding high and low mass star forming regions, as well as in shocked regions toward the galactic center (van Dishoeck et al., 1995; Ikeda et al., 2001; Bottinelli et al., 2007; Requena-Torres et al., 2006; Bisschop et al., 2007). HCOOH is part of the surface chemistry network leading to the formation of complex organic molecules seen in hot cores (Tielens & Charnley, 1997) and is therefore expected to be present in compact hot regions where it has evaporated from dust grains. In contrast, interferometric observations show that gas phase HCOOH emission can be extended beyond the hot core and is not coincident with other oxygen-bearing species such as CH3OCHO (Liu et al., 2002; Hollis et al., 2003; Remijan & Hollis, 2006). The observed gas phase HCOOH has low rotation temperatures and its abundance is a factor of 10-4 lower than that of solid HCOOH (Bisschop et al., 2007). It is very likely that gaseous and solid HCOOH co-exist in the same region. A low level of non-thermal desorption due to e.g., cosmic ray spot heating is sufficient to explain the observed gas phase abundances of HCOOH.
Previously, laboratory ice spectra have been studied for pure HCOOH and mixtures of HCOOH with H2O and/or CH3OH by Schutte et al. (1999) and Hudson & Moore (1999). These studies only focused on specific spectral features. The data clearly showed that the morphology and composition of the ice matrix strongly influence the HCOOH infrared spectrum. Recently, experiments have been reported for the layered ice system HCOOH/H2O in which the interaction of HCOOH and H2O in the interface is studied (see e.g., Cyriac & Pradeep, 2005; Bahr et al., 2005; Souda, 2006).
There is a clear need to understand the spectroscopy of the main ice constituents such as HCOOH, as new observational tools become available for the study of infrared features of interstellar ices, such as the Spitzer Space Telescope, the Stratospheric Observatory For Infrared Astronomy (SOFIA), and the James Webb Space Telescope (JWST). Solid HCOOH is likely mixed with species such as H2O, CO, CO2 and CH3OH that are abundant in the ice and have related formation mechanisms. Infrared ice features of mixtures with these species have been studied in this paper. Pure HCOOH is measured as well for comparison. Quantitative and qualitative analysis of the 5.9 m, 7.2 m and other HCOOH ice features allows for a better determination of the amount of HCOOH present in interstellar ices as well as its ice environment.
The paper is organized as follows: Sect. 2 explains the experimental method, Sect. 3 the analysis techniques, Sect. 4 discusses the results of experiments with pure ices, as well as mixtures with H2O, CH3OH, CO and CO2, in Sect. 5 the effects of ice matrix and temperature on the band strength are presented, Sect. 6 discusses the physical aspects of the interactions of HCOOH in the solid state with other species, Sect. 7 presents the astrophysical implications, and finally Sect. 8 summarizes the main conclusions of this paper.
2 Experimental procedure
The experiments are performed in a high vacuum (HV) set-up with a base pressure of 10-7 Torr, that has been previously described in detail by Gerakines et al. (1995). A CsI window mounted in close thermal contact with a closed cycle He cryostat is situated at the center of the chamber. It is used as a substrate holder and can be cooled down to 14 K. The sample temperature is controlled to better than 0.1 K using the cryostat cold finger, a resistive heating element and a Lakeshore 330 temperature control unit. The system temperature is monitored by two KP-type thermocouples (0.07% Au in Fe versus chromel), one mounted on the substrate face and the second close to the heater element. Ices are grown in situ onto the substrate, by exposing the cold surface to a steady flow of gas that is introduced into the chamber via an all metal flow control valve with a modified outlet directed at the substrate center along the surface normal. The ices are monitored by Fourier Transform Infrared (FTIR) absorption spectroscopy with 1 cm-1 spectral resolution covering the 4000–500 cm-1 range.
To test the effect of dilution of HCOOH (98% purity, J. T. Baker) by H2O (deionized) four mixtures are prepared in a glass vacuum manifold. Both HCOOH and H2O are further purified by subsequently freezing and thawing the samples in the vacuum manifold. The mixture ratios range from the relative abundances derived from observations of interstellar ices of 1 to 5% (see e.g., Gibb et al., 2004) to more HCOOH-rich ices with relative HCOOH:H2O concentrations up to 50:50%. The astrophysical motivation for these higher mixture ratios is that other species such as CH3OH are present in solid state environments with nearly equal amounts of H2O and/or CO2 (Ehrenfreund et al., 1998, 1999; Dartois et al., 1999). The different HCOOH:H2O mixtures that are used here are summarized in Table 1. A pure H2O sample is prepared for comparison. Furthermore, some features of the solid CO band can be explained with mixtures or layers of CO with non-hydrogen-bonding molecules or with hydrogen-bonding species other than H2O (e.g., Tielens et al., 1991; Pontoppidan et al., 2003; Fraser et al., in prep.). Accordingly, we have also studied a set of binary mixtures of HCOOH:X and tertiary mixtures of HCOOH:H2O:X, where X stands for CO (99.997% purity, Praxair), C18O2 (97% purity, Praxair) or CH3OH (99.9% purity, Janssen Chimica) are prepared with concentrations of 10:90% and 7:67:26%, respectively. These mixtures are chosen such that the matrix species determine the structure of the ice. Uncertainties on the concentrations of the ice constituents are 10% due to inaccuracies in the pressure reading. The C18O2 isotopologue is used to distinguish solid C18O2 from regular atmospheric gas phase CO2.
| H2O | HCOOH | X | Total exposure | Deposition time |
|---|---|---|---|---|
| (%) | (%) | (%) | (L) | (min) |
| – | 100 | – | 900 | 15 |
| 100 | – | – | 900 | 15 |
| 50 | 50 | – | 900 | 15 |
| 66 | 34 | – | 900 | 15 |
| 80 | 20 | – | 900 | 15 |
| 91 | 9 | – | 900 | 15 |
| – | 11 | 89(CO) | 1800 | 30 |
| – | 9 | 91(C18O2) | 900 | 15 |
| – | 10 | 90(CH3OH) | 1800 | 30 |
| 62 | 8 | 30(CO) | 1800 | 30 |
| 67 | 6 | 27(C18O2) | 1800 | 30 |
| 68 | 6 | 26(CH3OH) | 1800 | 30 |
A typical experiment starts with taking a background spectrum at 15 K. Subsequently, the ices are deposited with a flow of 1.010-5 Torr s-1. An exposure of 1.010-6 Torr s-1 corresponds to 1 Langmuir (L) or equivalently 1 monolayer (ML) s-1 assuming that the molecular surface density is 1015 molecules cm-2 and the sticking probability is 1 at 15 K. The deposition times and total exposures are summarized in Table 1. After deposition, FTIR spectra are taken at 15 K, and subsequently every 15 K for binary mixtures of HCOOH with H2O or CO2 and every 30 K for all other mixtures up until a temperature of 165 K is reached. At each temperature, the sample stabilizes for 20 minutes before a spectrum is recorded.
One pure HCOOH experiment is performed where HCOOH is deposited at 145 K. The aim of this experiment is to determine whether the HCOOH ice structure depends on the deposition temperature and whether potential phase changes are reversible. Subsequently, the experiment is cooled down to 15 K and from then on FTIR spectra are taken every 15 K during warm-up.
3 Data reduction and analysis
| Ice composition | Baseline range |
|---|---|
| (cm-1) | |
| HCOOH & HCOOH:H2O | 4000–3800, 1850–1800, 1050–1030, 540–500 |
| HCOOH:CH3OH & HCOOH:H2O:Xa | 4000–3700, 1850–1800, 1580–1500, 950–900, 500–450 |
| HCOOH:CO | 4000–3800, 2440–2260, 2000–1800, 1550–1400, 600–500 |
| HCOOH:CO2 | 4000–3900, 2100–1800, 1550–1430, 550–500 |
a X = CO, C18O2 or CH3OH.
The spectral range from 4000–500 cm-1 is very rich in absorption features of complex organic species, and HCOOH is no exception. Consequently special care has to be taken in the data reduction. Depending on the mixture, different frequency ranges are used to fit third order polynomial baselines (see Table 2). An additional local baseline is subtracted in the 1800–1100 cm-1 frequency range. This is necessary as the HCOOH (C=O) mode around 1700 cm-1 (5.9 m) overlaps with the (OH) mode of H2O at 1655 cm-1 (6.0 m). This H2O feature is much weaker than the HCOOH feature, even when only 10% of HCOOH is present, but it is responsible for a wing on the (C=O) band. Finally, a correction is made on the (OH/CH) feature around 1390 cm-1 (7.2 m) as it is close to a variable background feature. Spectra that comprise only the background feature are subtracted from the sample spectra for each temperature, but due to its variability, the subtraction does not fully remove the artifact.
The absolute band strengths are difficult to calibrate in our experiment, because the number of molecules that stick to the substrate sample is not exactly known. Instead, we focus in this paper on the relative band strengths that can be accurately measured. The relative values discussed here can be combined with previously measured values for the band strengths available from the literature (summarized in Table 3). The absolute band strengths for the vibrational modes depend on whether HCOOH is in the gas phase or solid state and consequently the numbers in the table do not perfectly match.
| Ice matrix | (C=O) | (C–O) | (OH/CH) |
|---|---|---|---|
| cm molecule-1 | cm molecule-1 | cm molecules-1 | |
| HCOOHa | 6.7(-17) | — | 2.8(-18) |
| HCOOH:H2O 7:93%b | — | 1.5(-17) | — |
| HCOOH–5H2Oc | 8.5(-17) | 5.0(-17) | 1.1(-18) |
| HCOOH–6H2Oc | 7.7(-17) | 4.3(-17) | 3.5(-18) |
a Laboratory gas phase data by Marechal (1987).
b Laboratory solid state data by Hudson & Moore (1999).
c Theoretical calculations by Park & Woon (2006).
To determine the relative band strengths, the (C=O), (OH/CH), and (C–O) features of HCOOH as well as the (OH) and libration ((lib)) bands of H2O are integrated over the frequency ranges given in Table 4. The integration boundaries for H2O are identical to those used recently by Öberg et al. (2007). Since the (OH) band at 930 cm-1 (10.8 m) and the OCO bending mode ((OCO)) at 705 cm-1 (14.2 m) of HCOOH overlap with the H2O (lib) band at 750 cm-1(13.3 m), these two features are subtracted before integration.
| Vibrational mode | Wavenumber |
|---|---|
| (cm-1) | |
| HCOOH | |
| (C=O) | 1800–1550 |
| (OH/CH) | 1450–1370 |
| (C–O) | 1300–1150 |
| H2O | |
| (OH) | 3700–3000 |
| (lib) | 1000–500 |
The relative band strengths of the HCOOH and H2O spectral features are calculated with respect to pure HCOOH and H2O via:
| (1) |
Here Y is the HCOOH ice fraction, the integrated absorbance of the band in the mixture, the band strength for pure HCOOH ice at 15 K, and the integrated absorbance for pure HCOOH ice at 15 K. A similar formula is used for H2O. The resulting relative band strengths are studied as a function of temperature (see Sect. 5). An extensive discussion of the uncertainties of the band strengths is given by Öberg et al. (2007). In short, the largest fraction of the uncertainties arises from inaccuracies on the mixing ratio of the ice and yields relative uncertainties that are below 10%. Additionally, baseline subtraction and deposition time inaccuracies are 1 to 2%. A conservative approach yields an overall uncertainty of 12% in the resulting calculations for the relative band strengths. Furthermore, it is important to note that the relative uncertainty between different temperatures for a single experiment amounts to 2% as only baseline inaccuracies contribute. Observed temperature trends are thus much more certain than concentration dependencies.
The (C=O), (OH/CH) and (C–O) bands of HCOOH are fitted with Gaussian line profiles for the astrophysically most relevant 1800–1100 cm-1 range. To fit the asymmetric profile of the (C=O) stretch around 1700 cm-1 two components are needed. It turned out to be difficult to disentangle the properties of the absorption bands of HCOOH in some mixtures, in particular those containing CO and CO2. In such cases average peak positions are given. In general the uncertainties of peak positions and FWHMs are 1 cm-1 and 2 cm-1, except for the (OH/CH) feature in the 9:91% HCOOH:H2O mixture, where the values are 2 cm-1 and 4 cm-1, respectively.
4 Results
The following section summarizes the results for the pure and mixed HCOOH ices at different temperatures. All spectra are available at http://www.strw.leidenuniv.nl/lab/databases/.
4.1 Pure HCOOH ices
| Wavenumber | Wavelength | Mode | Label | Comment |
|---|---|---|---|---|
| (cm-1) | (m) | |||
| HCOOH | ||||
| 3115 | 3.21 | (OH) | has several sub-maxima | |
| 2953 | 3.39 | (CH) | ||
| 2754 | 3.63 | (OH) | has several sub-maxima | |
| 2582 | 3.87 | (OH) | has several sub-maxima | |
| 1714 | 5.83 | (C=O) | out-of-phase between adjacent chains | |
| 1650 | 6.06 | (C=O) | in-phase between adjacent chains | |
| 1387 | 7.21 | (OH) & (CH) | & | |
| 1211 | 8.26 | (C–O) | ||
| 1073 | 9.32 | (CH) | out-of-plane | |
| 930 | 10.75 | (OH) | out-of-plane | |
| 705 | 14.18 | (OCO) | ||
| H2O | ||||
| 3280 | 3.05 | (OH) | a | |
| 1655 | 5.88 | (OH) | ||
| 750 | 13.33 | (lib) | ||
| CO | ||||
| 2140 | 4.67 | (CO) | ||
| C18O2 | ||||
| 3671 | 2.72 | overtone | + | |
| 3513 | 2.85 | overtone | 2+ | |
| 2310 | 4.33 | (CO) | ||
| 645 | 15.50 | (OCO) | ||
| CH3OH | ||||
| 3251 | 3.08 | (OH) | ||
| 2951 | 3.39 | (CH) | ||
| 2827 | 3.54 | (CH) | ||
| 1460 | 6.85 | CH3 deformation and (OH) | b | |
| 1130 | 8.85 | CH3 rock | ||
| 1026 | 9.75 | (CO) | ||
| 694 | 14.41 | torsion | ||
a refers to the symmetric stretching mode and to the anti-symmetric stretching mode of H2O.
b and are anti-symmetric deformations, is a symmetric deformation of CH3OH and is the OH bending mode for CH3OH.

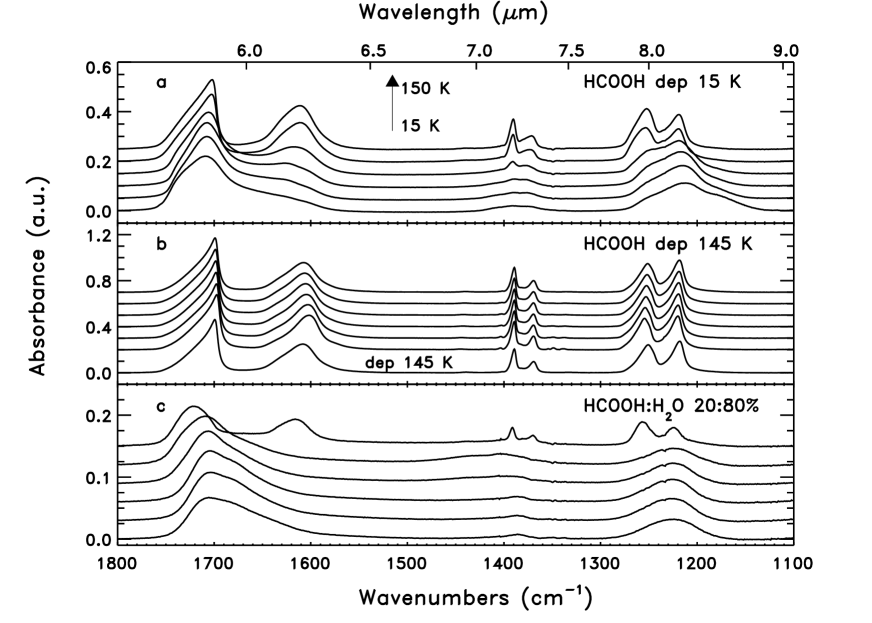
Clearly, the pure HCOOH ice spectrum shown in Fig. 1 for 15 K is complex. For completeness we summarize the spectroscopic assignments for all bands here (see Table 5), but in this paper we mainly focus on the astrophysically relevant features (C=O), (OH/CH), as well as (C–O). The measured peak positions and FWHMs in the astrophysically relevant 1800-1100 cm-1 range are given in Table 7 of the online material. The features at 3115 cm-1, 2754 cm-1, and 2582 cm-1 (3.21–3.87 m) are all due to the OH stretching mode, (OH). The broad structure with different maxima of these modes are assigned to a combination of dimers and HCOOH organized in long chains (Cyriac & Pradeep, 2005). The (OH) bands overlap with the 2953 cm-1 CH stretch, (CH). In observations these bands overlap with and are dominated by the 3 m H2O band. The astrophysically important (C=O) band has its maximum around 1714 cm-1 and is broad and asymmetric. The C–O stretch, (C–O), is located at 1211 cm-1. Furthermore, bending modes are present of which (CH) and (OH) at 1073 cm-1 and 930 cm-1 (9.3 and 10.8 m), respectively, are out-of-plane.
The temperature evolution of the astrophysically relevant HCOOH features in the 1800–1100 cm-1 range is shown in Fig. 2a and the corresponding peak positions are given in Table 7 of the online material. Most features are broad and consist of multiple components at 15 K. At 135 K the (C=O), (C–O), and (OH/CH) modes at 1700, 1250, and 1390 cm-1 split into two components. The splitting of the (C=O) and (C–O) bands is assigned to the out-of-phase and in-phase motions of different HCOOH molecules within the same chain (Cyriac & Pradeep, 2005). The out-of-phase motions are located at higher wavenumbers than the in-phase motions. The (OH) and (CH) in-plane bending modes overlap at 15 K, but are clearly observed as two separate peaks at higher temperatures. Our results are consistent with those of Cyriac & Pradeep (2005), who assigned the splitting to a conversion of HCOOH dimers to HCOOH organized in chains, following and experimental study by Millikan & Pitzer (1958) and calculations by Yokoyama et al. (1991).
In one experiment HCOOH is deposited at 145 K (see Fig. 2b). After deposition the spectrum is similar to that of HCOOH deposited at 15 K and subsequently heated to 135 K. When the temperature is lowered to 15 K, the general features remain similar to the high temperature spectrum. Upon subsequent heating to 150 K an exact copy of the original (145 K) spectrum is obtained. Thus, the changes in ice matrix structure after heating are irreversible.
4.2 HCOOH:H2O ices
Experiments with mixtures that range from 50:50% to 9:91% HCOOH:H2O have been performed. In Figure 2c, the temperature evolution of the mixture with 20% of HCOOH is shown. Peak positions and FWHMs for the 1800–1100 cm-1 range are given in Table 8 of the online material. The dilution of HCOOH in H2O clearly affects the band profiles of HCOOH. The (C=O) band shifts 3 cm-1 to the red at 15 K and the (OH/CH) feature is narrower than in pure HCOOH. Between 105 and 120 K both the peak intensity and FWHM of the (OH/CH) band increase. At 150 K the H2O features change due to a phase transition from amorphous to crystalline H2O ice structure. At the same time the (C=O), (OH/CH), and (C–O) modes of HCOOH split into two components. Finally, at 165 K all H2O and most HCOOH have desorbed.

The spectra for different mixture concentrations with respect to H2O are shown in Fig. 3 for 15 K (left) and 150 K (right). The (C=O) band has an additional component at 15 K in HCOOH:H2O mixtures with high HCOOH concentrations that is located at lower wavenumbers and is due to the in-phase motion between HCOOH molecules in the same chain. This implies that there is a small fraction of HCOOH ice that is in a bulk HCOOH environment. The pure HCOOH component decreases with increasing H2O concentration. The (OH/CH) and (C–O) modes consist of one component and their FWHMs decrease for lower HCOOH concentrations.
At 150 K, the (C=O), (OH/CH), and (C–O) modes are split into two peaks for the three mixtures with the highest HCOOH concentrations. The (OH/CH) mode is broader compared to pure HCOOH. At the lowest HCOOH concentration, no splitting of the (C=O) spectral feature of HCOOH is observed, but only a broad band with a FWHM of 67 cm-1. Furthermore, the (C=O) band is shifted to 1718 cm-1 and the (OH/CH) feature is located at 1404 cm-1.
4.3 HCOOH:CO, HCOOH:CO2, and HCOOH:CH3OH ices
Figure 4 shows the effects different species have on the solid state HCOOH infrared spectrum. Tables 9 and 10 of the online material summarize the profile parameters. HCOOH mixed with H2O results in a relatively simple spectrum, but mixtures with other species, especially CO or CO2, show multiple components. In mixtures with CO or CO2 the (C=O) band is shifted to higher wavenumbers of which the two most prominent features are located at 1717 cm-1 and 1735 cm-1 in both mixtures. A feature is present at 1154 cm-1 for the (C–O) band which is assigned to monomeric HCOOH. This band is especially strong in the HCOOH:CO2 mixture. In CH3OH, the absorption bands more closely resemble the overall features of mixtures with H2O. However, the (C=O) and (C–O) modes are split into two components at 1721 cm-1 and 1691 cm-1. The (OH/CH) band cannot be compared to that in the other mixtures as it overlaps with and is dominated by the CH3 deformation and (OH) features of CH3OH at 1460 cm-1.
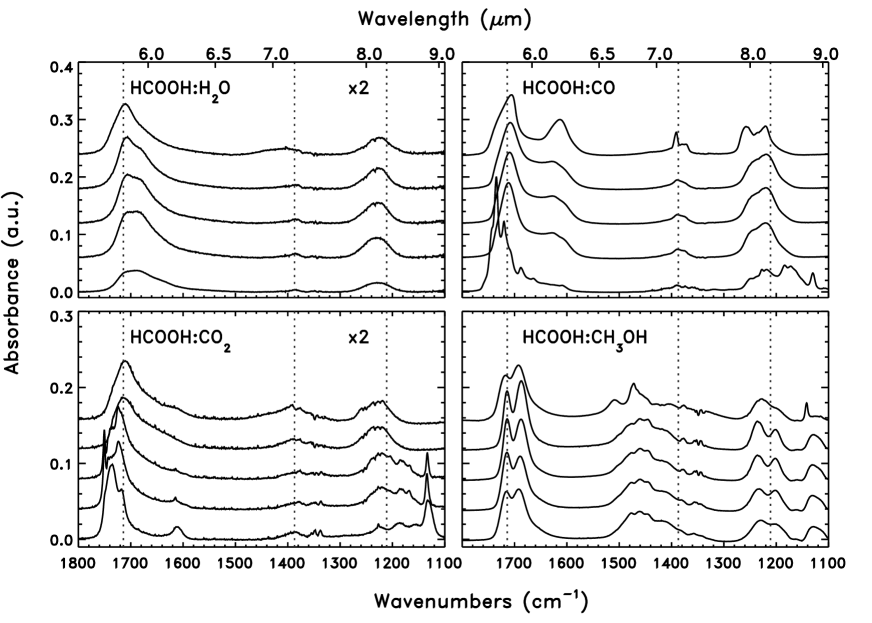
The temperature behavior of the spectral features of HCOOH ice depends strongly on the matrix species. In mixtures with H2O, the HCOOH bands are similar for all temperatures. This is not surprising as the H2O ice structure does not change until 135 K. HCOOH behaves differently in mixtures with CO and CO2 at high temperatures, however. When CO has desorbed at 45 K, the (C=O) and (C–O) features are similar to pure HCOOH. Furthermore, its integrated intensity does not decrease after CO desorption. In the mixture of HCOOH with CO2, the 1735 cm-1 and 1717 cm-1 bands of HCOOH only fully disappear between 75 K and 105 K at the same time that the features for pure HCOOH start to appear and after CO2 has desorbed. Thus even when HCOOH is present as a minor component in CO or CO2 it does not co-desorb at low temperatures. The HCOOH bands in CH3OH have a similar lack of temperature variation as for mixtures with H2O. Between 105 and 135 K CH3OH has a phase transition that is observed around 1500 cm-1 where both the CH3 deformation and (OH) modes of CH3OH are located. The HCOOH (C=O) and (C–O) bands do not resemble pure HCOOH features at 135 K, which indicates that both species are still mixed.
4.4 Tertiary mixtures
Spectra of tertiary mixtures 7:67:26% of HCOOH:H2O:CO, HCOOH:H2O:CO2 and HCOOH:H2O:CH3OH have been measured at 15 K. In Table 6 and Table 10 of the online material peak positions and FWHMs are given. The (C=O) and (C–O) features are similar to those in mixtures with H2O, but are shifted by a few wavenumbers. The (OH/CH) band is located at lower wavenumbers, especially for the HCOOH:H2O:CH3OH mixture and have FWHMs of 14–19 cm-1.
| Mixture | Peak position | FWHM | |
|---|---|---|---|
| (cm-1) | (cm-1) | ||
| HCOOH:H2O:CO | 1386 | 19 | 4.2 |
| HCOOH:H2O:CO2 | 1386 | 19 | 3.0 |
| HCOOH:H2O:CH3OH | 1382 | 13 | 8.3 |
4.5 Comparison to previous laboratory data
Prior to this study, only Schutte et al. (1999) and Hudson & Moore (1999) reported infrared spectra of HCOOH mixtures with H2O and CH3OH at 1 and 4 cm-1 resolution, respectively. Their experiments only focused on the (OH/CH) and (C–O) bands and consequently it is difficult to make a full comparison with our data which also includes other HCOOH bands. The peak positions of the (OH/CH) features in pure HCOOH ice and 10:100% HCOOH:H2O mixtures by Schutte et al. (1999) are shifted and the FWHMs are narrower compared to our data. However, the tertiary HCOOH:H2O:CH3OH 8:66:26% mixture results agree very well within the experimental uncertainties. These discrepancies are likely due to a different baseline subtraction. In pure HCOOH and mixtures with H2O the (OH/CH) mode has a wing on the blue side, which is not subtracted in the present work. The peak position and FWHM for the (C–O) feature for a 7:93% HCOOH:H2O mixture by Hudson & Moore (1999) are the same within the uncertainties.
5 Band strength changes in ice mixtures
As stated before in Sect. 3 absolute band strengths are difficult to measure in our experiment, whereas the relative band strengths can be accurately determined. The relative values discussed in this section can be used in combination with existing values in the literature given in Table 3 to derive absolute band strengths in different ice environments.
5.1 HCOOH

When HCOOH ice is mixed with H2O the band strengths of HCOOH are strongly affected. In Figure 5 the relative band strengths of the (C=O), (C–O) and (OH/CH) spectral features are shown with error-bars of 12% superimposed. Clearly the uncertainties are relatively large, but still it is possible to note a number of effects with concentration and temperature. As discussed in Sect. 3 the error-bars in the same experiment at different temperatures are only 2%, and observed temperature trends are thus much more accurate than concentration trends.
All mixtures with H2O show a similar temperature trend as pure HCOOH. Even though between 135 and 150 K the (C=O) band splits, its band strength is constant with temperature. In contrast, that of the (C–O) feature shows a pronounced dip around 135 K, which is partly recovered at 150 K. For the most diluted mixture where chain-formation does not occur, no such dip is present. The band strength of the (OH/CH) mode increases with temperature and peaks at 135 K. A striking difference between the three absorption bands is that the band strength increases by a factor 2 to 5 with decreasing HCOOH ice concentration for the (C=O) and (OH/CH) bands, but is the same within 30% for the (C–O) feature in all mixtures.

A similar comparison for the relative band strength with respect to temperature is made for mixtures with CO, CO2, and CH3OH (see Fig. 6). The band strengths in mixtures with CO are higher compared to those in pure HCOOH, even when all CO has evaporated. However, the band strengths in CO2 are close to or smaller than those for pure HCOOH. The (C=O) and (C–O) modes are largest around 75–90 K, decrease between 90–135 K and finally increase again up to 150 K. The (C=O) and (C–O) bands are relatively little affected in the mixtures with CH3OH.
The relative band strengths for the (OH/CH) mode in the tertiary mixtures are shown in Table 6 and those of the other bands in Table 10 of the online material. Clearly, the band strength in the tertiary mixtures with H2O and CO, CO2 or CH3OH are enhanced at 15 K.
In summary, the relative band strengths of the (C=O) and (C–O) bands can range from 0.8–3 (HCOOH) and of the (OH/CH) band from 1–12 (HCOOH) in different ice environments.
5.2 H2O

Water absorption bands are strongly affected by the presence of other ice components like CO2 (Öberg et al., 2007). In Figure 7 the relative band strengths compared to pure H2O of the (OH) and the (lib) modes in the mixtures with HCOOH are shown versus temperature. The (OH) band strength is significantly smaller in all mixtures compared to that of pure H2O, but does not depend on the mixing ratio. The (lib) mode behaves differently. It decreases as a function of HCOOH concentration, with the smallest band strength for the highest HCOOH concentrations. As the temperature increases the relative band strength of the (lib) band increases, until a temperature of 135 K is reached. The different behavior of (OH) and the (lib) mode are further illustrated in the right panel of Fig. 7. For pure H2O the absorbance ratio (the 3.0/13 m features) starts at 7.5 and increases with temperature to 9.5. The mixtures have a higher ratio at 15 K, but decrease with temperature. The ratio furthermore increases with HCOOH concentration at 15 K. In conclusion, the ratio of the relative band strengths of the 3.0/13 m features with a value larger than 10 implies that H2O is present in ice with HCOOH concentrations 20%, and a lower value implies that the HCOOH concentration is 20%.
6 Discussion
In this section, our results are discussed in the light of recent chemical physics experiments of HCOOH-containing ices. The behavior of HCOOH in different ices may lead to important clues regarding the behavior of the species under interstellar conditions. Of particular relevance for interstellar chemistry is the mobility in the ice and desorption behavior of the ice constituents with temperature.
The infrared spectrum of pure HCOOH distinguishes itself from HCOOH mixtures by the presence of dimers to a chain-like structure of HCOOH molecules at 120–135 K for HCOOH deposited on a KBr substrate at 15 K (see e.g., Cyriac & Pradeep, 2005). The chain-structure at higher temperatures results in a spectrum in which the (C=O) and (C–O) bands are split. The transition from dimers to HCOOH-chains is irreversible as evidenced by the splitting of the (C=O) mode at 15 K for HCOOH deposited at 145 K (see Fig. 2 and Sect. 4.1).
In binary mixtures with H2O, the HCOOH ice spectral features remain relatively similar throughout a large temperature regime. Only from 120 K onwards, changes are observed for our experiments (see Fig. 3). Initially, only the (OH/CH) mode increases in intensity and broadens, but between 135 K and 150 K the (C=O) band splits into the out-of-phase and in-phase modes for 10% HCOOH, similar to what is observed for pure HCOOH ice. This implies that the molecules first reorganize locally at 120 K and subsequently become mobile throughout the ice at higher temperatures. This is corroborated by studies of layered binary HCOOH-H2O ices (Cyriac & Pradeep, 2005; Borodin et al., 2005; Bahr et al., 2005; Souda, 2006). In addition to the infrared experiments by Cyriac & Pradeep (2005), Metastable Impact Electron Spectroscopy (MIES) and Temperature Programmed Desorption (TPD) have been used to probe the layered HCOOH/H2O ices. No mixing is observed in any of these experiments up to 120 K. Furthermore, the splitting of the (C=O) mode between 135 K and 150 K in our experiments implies that H2O and HCOOH segregate at high temperatures. This is consistent with TPD data from Bahr et al. (2005), where HCOOH desorbs after H2O, even in ices where H2O has been deposited on top of HCOOH.
The interactions between HCOOH and CO, CO2 and CH3OH are different compared to H2O. Very little has been published about either dimers or ice mixtures of these species. Park et al. (2002) performed experiments with HCOOH dissolved in liquid CO2 and C2H6. The dimer/monomer ratio for HCOOH was higher in C2H6 than CO2. This is due to the stronger electrostatic interactions of HCOOH with CO2 compared to C2H6. A similar effect may be responsible for the difference between CO and CO2 as the monomeric HCOOH feature at 1154 cm-1 is stronger in the mixture with CO2 compared to CO. When HCOOH is diluted in an ice dominated by other molecules with no or very small dipole-moments like CH4, N2 and O2, a similar HCOOH ice spectrum is likely obtained. The monomer/dimer ratio will depend on the HCOOH concentration as well as the strength of the electrostatic interaction between HCOOH and the other ice species. A similar behavior is observed for H2O ice diluted in CO2, CO, N2 and O2 (e.g., Öberg et al., 2007; Bouwman et al., in prep.; Awad et al., in prep.).
The CH3OH spectrum is very little affected by HCOOH. This is probably due to a comparable strength of hydrogen bonds between HCOOH and CH3OH. The infrared spectra of HCOOH:CH3OH 10:90% mixtures shown in Fig. 4 clearly illustrate that both species do not segregate at temperatures below 135 K, even when CH3OH has a phase transition. It is likely that HCOOH and CH3OH only become mobile between 135 K and 150 K, as is found for mixtures of HCOOH with H2O. Since CH3OH has a smaller dipole-moment and fewer possibilities for making hydrogen-bonds compared to H2O, it is also expected to segregate from, and desorb prior to, HCOOH. Other polar or hydrogen-bonding species such as NH3 and H2CO may interact with HCOOH and affect its infrared spectrum in the same way.
7 Astrophysical implications

7.1 HCOOH ice identification
Formic acid ice has been observed in many different astrophysical objects, such as high mass and low mass star-forming regions (e.g., Schutte et al., 1997, 1999; Boogert et al., in prep.). In this section we compare the laboratory spectra with the observed ISO spectrum toward the low mass YSO HH 46 and the high mass YSO W 33A (Boogert et al., 2004; Gibb et al., 2000). The 5.9 m ((C=O)) 7.2 m ((OH/CH)) and 8.1 m ((C–O)) bands are used to determine the the ice environment in which HCOOH is located. The 5.9 m HCOOH feature is blended with other interstellar bands and the 8.1 m band overlaps with the wing of a strong silicate feature. Nonetheless they can be used to exclude some astrophysical HCOOH ice environments. In Figure 8 the 5–9 m range is shown toward the low mass YSO HH 46 with the experimental spectra over-plotted. In Figure 8a the spectra for the 10:90% HCOOH:CO and HCOOH:CO2 mixtures are shown. These mixtures can clearly be ruled out for HH 46 because the (C=O) feature is shifted too far to the blue. Similarly, pure high temperature HCOOH (Fig. 8b) can be discarded as the out-of-phase (C–O) mode at 8.1 m band is not detected. Furthermore, for all pure ices and mixtures except the binary HCOOH:CH3OH ice, the (C–O) band causes a small wing on the silicate band at 8.1 m, which is not observed due to the much larger intensity of the silicate absorption.
The integrated absorbance and peak position is determined most accurately from the (OH/CH) band, because it is the least blended feature of HCOOH. In Figure 9 the spectrum observed with ISO toward W 33A is shown for the (OH/CH) feature. The ISO data are chosen for comparison because they have higher spectral resolution ( 800, or 2 cm-1 at 7.2 m) than the Spitzer data ( 100, or 14 cm-1 at 7.2 m). In Figure 9a the 15 K spectra of pure HCOOH and 20:80% HCOOH:H2O are shown. Clearly, the pure HCOOH ice spectrum is too broad to fit the astronomical feature. The (OH/CH) mode is also too far shifted to the blue for the HCOOH:H2O mixture. The tertiary mixtures depicted in Fig. 9b match the observations better. The HCOOH spectral features in the HCOOH:H2O:CO and HCOOH:H2O:CO2 mixtures are almost identical, but have a blue wing that is not observed for W 33A. However, the HCOOH:H2O:CH3OH 6:68:26% mixture reproduces the observed spectrum very well.
This sensitivity of peak position and FWHM of the (OH/CH) band at 7.2 m is further illustrated in Fig. 10, together with the observed values toward the high mass YSO W 33A. A Gaussian fit is made to the observations in the same way as to the experimental data. The black horizontal line corresponds to the fitted peak position in the observations and the black vertical line to the fitted FWHM. The dotted and dashed lines represent 2 cm-1 and 1 cm-1 error-bars for the FWHM and peak position, respectively. Clearly, the binary mixtures with H2O as well as pure HCOOH are too broad and shifted too far to the blue side compared to the observed feature in W 33A. The tertiary mixtures provide better fits. The 6:27:67% HCOOH:CO2:H2O and 8:62:30% HCOOH:H2O:CO mixtures have FWHMs that are too broad compared to the observations within their uncertainties. Furthermore, their peak positions are shifted to 1386 cm-1, a few wavenumbers too high. Potentially, CO2/CO:H2O ratios higher than 0.40-0.52:1 could shift the (OH/CH) feature to lower wavenumbers and match the observations toward W 33A better. This is not unlikely as Öberg et al. (2007) find that they can fit the observed Spitzer spectrum toward HH 46 well if also a 0.5:1 CO2:H2O mixture is included. The 7.2 m band for the HCOOH:CH3OH:H2O mixture fits the observed spectrum very well.


7.2 HCOOH ice formation
The presence of HCOOH in a complex mixture dominated by H2O but also including CO, CO2 or CH3OH or a combination of these three species is not unlikely when potential formation mechanism are evaluated. CO or CO2 are both potential precursors to HCOOH and CH3OH is known to form from CO through H-atom bombardment (Watanabe et al., 2004; Fuchs et al., in prep.). H-bombardment of CO or CO2 in mixtures with H2O (Fuchs et al., in prep.; Bisschop et al., in prep.) and UV-irradiation of CO:H2O and CO2:H2O mixtures (Watanabe et al., 2004; Watanabe & Kouchi, 2002; Gerakines et al., 2000) do not give HCOOH as one of the main products. Since the UV experiments were performed under HV conditions, they need to be repeated under ultra high vacuum conditions to fully exclude this route. In H2O:CO mixtures that are bombarded by 0.8 MeV protons, to simulate cosmic rays, HCOOH is formed (Hudson & Moore, 1999). Its formation is explained by:
H CO HCO
OH HCO HCOOH
where the H and OH result from H2O dissociation in the experiment. In space, H-atoms from the gas phase can react with the adsorbed O to form OH. HCO is formed by H addition to CO, which will further react to H2CO and finally to CH3OH, unless HCO encounters an OH radical first. Garrod & Herbst (2006) use this formation mechanism for HCOOH in the solid state. However, in their model HCOOH can only form at higher temperatures because the OH and HCO radicals are not mobile at low temperatures. This would be inconsistent with the detection of HCOOH ice in cold sources such as HH 46 and background stars unless OH is produced with excess energy. This is for example found in theoretical calculations by Andersson et al. (2006) for the photo-dissociation of H2O ice. The newly formed OH radicals are not very mobile in bulk ice, but can move more than 80 Å over the surface. Thus HCOOH formation through this reaction mechanism is expected to be strongly localized at the ice surface. Another potential formation mechanism is given by Keane (2001).
HCO O HCOO
HCOO H HCOOH
In this case successive H- and O-addition leads to HCOOH formation, and HCOOH may be produced at low ice temperatures at the same time as H2O and CH3OH are formed.
In summary, both reaction pathways make it likely that HCOOH is formed in an environment where H2O and CH3OH are located. Potentially CO, CO2, and H2CO are present in the ice as well, if conversion to CH3OH and HCOOH is incomplete. As discussed in Sect. 7.1 it is probable that H2CO will have a similar effect on the ice structure as CH3OH and H2O and thus also on the HCOOH infrared bands. In the future both reaction paths can be tested experimentally and thus resolve whether HCOOH is formed during ice formation, ice processing at low temperatures or potentially even both.
8 Summary and conclusions
The main conclusions derived from this work are:
-
•
The peak positions, FWHM and profiles of the (C=O), (OH/CH) and (C–O) bands are strongly affected by the ice matrix. At high temperatures and when HCOOH is deposited at high temperatures, the (C=O), (OH/CH) and (C–O) modes split into two bands. In binary mixtures with H2O, the HCOOH features have very simple profiles, whereas multiple bands are found in binary ice mixtures with CO, CO2 and CH3OH. The peak positions of the HCOOH (C=O), (OH/CH), and (C–O) bands are shifted up to 40 cm-1. The spectra for tertiary mixtures resemble the spectra of binary mixtures with H2O, but small shifts exist.
-
•
The band strengths of the (C=O), (OH/CH), and (C–O) features are strongly affected by the ice structure. They are enhanced in mixtures of HCOOH with H2O and CO by factors of 2–10, but are similar to those of pure HCOOH ice for binary mixtures with CO2 and CH3OH. Strong temperature effects are also observed.
-
•
Comparison of our data with the Spitzer spectrum of HH 46 and the ISO spectrum toward the high mass YSO W 33A excludes the presence of the high temperature HCOOH chain-structure, as well as binary mixtures of HCOOH with any of the other species H2O, CO, CO2 and CH3OH. The 7.2 m feature toward W 33A is very similar to that found in tertiary mixtures of 7:67:26% HCOOH:H2O:X, where X stands for CO, CO2 or CH3OH. Especially the HCOOH:H2O:CH3OH mixture reproduces the observed W 33A spectrum very well. Potentially, such tertiary or even more complex ices consisting of HCOOH, H2O, CH3OH, CO and CO2 may be responsible for the observed spectrum. The presence of HCOOH in such complex ice mixtures is consistent with its possible formation mechanisms.
Acknowledgements.
We thank the referee for useful comments on the paper. Funding was provided by NOVA, the Netherlands Research School for Astronomy, and by a Spinoza grant from the Netherlands Organization for Scientific Research, NWO.References
- Andersson et al. (2006) Andersson, S., Al-Halabi, A., Kroes, G.-J., & van Dishoeck, E. F. 2006, J. Chem. Phys., 124, 4715
- Bahr et al. (2005) Bahr, S., Borodin, A., Höfft, O., Kempter, V., & Allouche, A. 2005, J. Chem. Phys., 122, 234704
- Bisschop et al. (2007) Bisschop, S. E., Jørgensen, J. K., van Dishoeck, E. F., & de Wachter, E. B. M. 2007, A&A, 465, 913
- Boogert et al. (2004) Boogert, A. C. A., Pontoppidan, K. M., Lahuis, F., et al. 2004, ApJS, 154, 359
- Borodin et al. (2005) Borodin, A., Höfft, O., Bahr, S., Kempter, V., & Allouche, A. 2005, Nucl. Instrum. Meth. B, 232, 79
- Bottinelli et al. (2007) Bottinelli, S., Ceccarelli, C., Williams, J. P., & Lefloch, B. 2007, A&A, 463, 601
- Cyriac & Pradeep (2005) Cyriac, J. & Pradeep, T. 2005, Chem. Phys. Lett., 402, 116
- Dartois et al. (1999) Dartois, E., Schutte, W., Geballe, T. R., et al. 1999, A&A, 342, L32
- Ehrenfreund et al. (1998) Ehrenfreund, P., Dartois, E., Demyk, K., & D’Hendecourt, L. 1998, A&A, 339, L17
- Ehrenfreund et al. (1999) Ehrenfreund, P., Kerkhof, O., Schutte, W. A., et al. 1999, A&A, 350, 240
- Garrod & Herbst (2006) Garrod, R. T. & Herbst, E. 2006, A&A, 457, 927
- Gerakines et al. (2000) Gerakines, P. A., Moore, M. H., & Hudson, R. L. 2000, A&A, 357, 793
- Gerakines et al. (1995) Gerakines, P. A., Schutte, W. A., Greenberg, J. M., & van Dishoeck, E. F. 1995, A&A, 296, 810
- Gibb et al. (2004) Gibb, E. L., Whittet, D. C. B., Boogert, A. C. A., & Tielens, A. G. G. M. 2004, ApJS, 151, 35
- Gibb et al. (2000) Gibb, E. L., Whittet, D. C. B., Schutte, W. A., et al. 2000, ApJ, 536, 347
- Hollis et al. (2003) Hollis, J. M., Pedelty, J. A., Snyder, L. E., et al. 2003, ApJ, 588, 353
- Hudson & Moore (1999) Hudson, R. L. & Moore, M. H. 1999, Icarus, 140, 451
- Ikeda et al. (2001) Ikeda, M., Ohishi, M., Nummelin, A., et al. 2001, ApJ, 560, 792
- Keane (2001) Keane, J. V. 2001, PhD thesis, Rijks Universiteit Groningen
- Knez et al. (2005) Knez, C., Boogert, A. C. A., Pontoppidan, K. M., et al. 2005, ApJ, 635, L145
- Liu et al. (2002) Liu, S.-Y., Girart, J. M., Remijan, A., & Snyder, L. E. 2002, ApJ, 576, 255
- Marechal (1987) Marechal, Y. 1987, J. Chem. Phys., 87, 6344
- Millikan & Pitzer (1958) Millikan, R. C. & Pitzer, K. S. 1958, J. Am. Chem. Soc., 80, 3515
- Öberg et al. (2007) Öberg, K. I., Fraser, H. J., Boogert, A. C. A., et al. 2007, A&A, 462, 1187
- Park & Woon (2006) Park, J.-Y. & Woon, D. E. 2006, ApJ, 648, 1285
- Park et al. (2002) Park, Y., Gupta, R. B., Curtis, C. W., & Roberts, C. B. 2002, J. Phys. Chem., 106, 9696
- Pontoppidan et al. (2003) Pontoppidan, K. M., Fraser, H. J., Dartois, E., et al. 2003, A&A, 408, 981
- Remijan & Hollis (2006) Remijan, A. J. & Hollis, J. M. 2006, ApJ, 640, 842
- Requena-Torres et al. (2006) Requena-Torres, M. A., Martín-Pintado, J., Rodríguez-Franco, A., et al. 2006, A&A, 455, 971
- Schutte et al. (1999) Schutte, W. A., Boogert, A. C. A., Tielens, A. G. G. M., et al. 1999, A&A, 343, 966
- Schutte et al. (1997) Schutte, W. A., Greenberg, J. M., van Dishoeck, E. F., et al. 1997, Ap&SS, 255, 61
- Souda (2006) Souda, R. 2006, Surface Science, 600, 3135
- Tielens & Charnley (1997) Tielens, A. G. G. M. & Charnley, S. B. 1997, Origins Life Evol. B., 27, 23
- Tielens et al. (1991) Tielens, A. G. G. M., Tokunaga, A. T., Geballe, T. R., & Baas, F. 1991, ApJ, 381, 181
- van Dishoeck et al. (1995) van Dishoeck, E. F., Blake, G. A., Jansen, D. J., & Groesbeck, T. D. 1995, ApJ, 447, 760
- Watanabe & Kouchi (2002) Watanabe, N. & Kouchi, A. 2002, ApJ, 567, 651
- Watanabe et al. (2004) Watanabe, N., Nagaoka, A., Shiraki, T., & Kouchi, A. 2004, ApJ, 616, 638
- Yokoyama et al. (1991) Yokoyama, I., Miwa, Y., & Machida, K. 1991, J. Am. Chem. Soc., 113, 6458
Appendix A Line parameters of HCOOH in the 1800-1000 cm-1 range
| (C=O) | (OH/CH) | (C–O) | |||||||||
| out-of-phase | in-phase | ||||||||||
| FWHM | FWHM | FWHM | FWHM | ||||||||
| (K) | (cm-1(m)) | (cm-1) | (cm-1(m)) | (cm-1) | (cm-1(m)) | (cm-1) | (cm-1(m)) | (cm-1) | |||
| HCOOH deposited at 15 K | |||||||||||
| 15 | 1714(5.84) | 45 | 1650(6.06) | 69 | 1.0 | 1387(7.21) | 37 | 1.0 | 1211(8.26) | 64 | 1.0 |
| 30 | 1713(5.84) | 43 | 1651(6.06) | 71 | 1.0 | 1387(7.21) | 37 | 1.1 | 1213(8.24) | 61 | 1.0 |
| 60 | 1710(5.85) | 41 | 1644(6.08) | 65 | 1.1 | 1387(7.21) | 35 | 1.2 | 1219(8.20) | 53 | 1.0 |
| 75 | 1710(5.85) | 40 | 1641(6.09) | 65 | 1.1 | 1387(7.21) | 33 | 1.2 | 1221(8.19) | 51 | 1.0 |
| 90 | 1709(5.85) | 39 | 1637(6.11) | 64 | 1.1 | 1387(7.21) | 31 | 1.3 | 1223(8.18) | 50 | 1.0 |
| 105 | 1709(5.85) | 39 | 1634(6.12) | 63 | 1.1 | 1387(7.21) | 30 | 1.3 | 1224(8.17) | 50 | 1.0 |
| 120 | 1709(5.85) | 41 | 1625(6.15) | 56 | 1.1 | 1386(7.21) | 29 | 1.8 | 1228(8.15) | 51 | 1.0 |
| 135 | 1703(5.87) | 10 | 1615(6.19) | 43 | 1.1 | 1391(7.19) | 8 | 2.7 | 1255(7.97) | 22 | 0.9 |
| 1716(5.83) | 39 | 1375(7.27) | 14 | 1221(8.19) | 21 | ||||||
| 150 | 1703(5.87) | 11 | 1615(6.19) | 40 | 1.1 | 1391(7.19) | 7 | 2.5 | 1254(7.97) | 22 | 0.9 |
| 1719(5.82) | 34 | 1374(7.28) | 13 | 1221(8.19) | 17 | ||||||
| 165 | 1704(5.87) | 11 | 1617(6.18) | 36 | — | 1391(7.19) | 7 | — | 1253(7.98) | 20 | — |
| 1722(5.81) | 32 | 1373(7.28) | 12 | 1220(8.20) | 15 | ||||||
| HCOOH deposited at 145 K | |||||||||||
| 15 | 1699(5.89) | 10 | 1606(6.23) | 36 | 1.5 | 1390(7.19) | 6 | 3.7 | 1256(7.96) | 18 | 1.3 |
| 1712(5.84) | 32 | 1371(7.29) | 9 | 1222(8.18) | 15 | ||||||
| 30 | 1699(5.89) | 9 | 1606(6.23) | 36 | 1.5 | 1390(7.19) | 6 | 3.7 | 1256(7.96) | 18 | 1.3 |
| 1712(5.84) | 32 | 1371(7.29) | 9 | 1222(8.18) | 15 | ||||||
| 45 | 1699(5.89) | 9 | 1606(6.22) | 36 | 1.5 | 1390(7.19) | 6 | 3.7 | 1255(7.97) | 18 | 1.3 |
| 1713(5.84) | 32 | 1371(7.29) | 9 | 1222(8.18) | 15 | ||||||
| 60 | 1699(5.89) | 8 | 1607(6.22) | 36 | 1.5 | 1390(7.19) | 6 | 3.6 | 1255(7.97) | 18 | 1.3 |
| 1712(5.84) | 32 | 1371(7.29) | 9 | 1222(8.19) | 15 | ||||||
| 75 | 1699(5.88) | 8 | 1608(6.22) | 36 | 1.5 | 1390(7.19) | 6 | 3.6 | 1255(7.97) | 18 | 1.3 |
| 1713(5.84) | 32 | 1371(7.29) | 9 | 1222(8.19) | 15 | ||||||
| 90 | 1700(5.88) | 8 | 1608(6.22) | 37 | 1.5 | 1390(7.19) | 6 | 3.5 | 1254(7.97) | 18 | 1.3 |
| 1713(5.84) | 32 | 1371(7.29) | 10 | 1221(8.19) | 15 | ||||||
| 105 | 1700(5.88) | 9 | 1609(6.21) | 37 | 1.5 | 1390(7.19) | 6 | 3.5 | 1254(7.98) | 18 | 1.3 |
| 1713(5.84) | 32 | 1371(7.29) | 10 | 1221(8.19) | 15 | ||||||
| 120 | 1700(5.88) | 9 | 1610(6.21) | 38 | 1.4 | 1390(7.19) | 6 | 3.4 | 1253(7.98) | 18 | 1.3 |
| 1713(5.84) | 32 | 1371(7.29) | 10 | 1220(8.19) | 15 | ||||||
| 135 | 1700(5.88) | 9 | 1611(6.21) | 39 | 1.4 | 1390(7.20) | 6 | 3.3 | 1252(7.99) | 18 | 1.3 |
| 1714(5.84) | 32 | 1371(7.29) | 11 | 1220(8.10) | 15 | ||||||
| 150 | 1701(5.88) | 9 | 1612(6.20) | 39 | 1.4 | 1390(7.20) | 6 | 3.2 | 1252(7.99) | 19 | 1.3 |
| 1714(5.83) | 31 | 1371(7.29) | 11 | 1219(8.20) | 14 | ||||||
| 165 | 1701(5.88) | 9 | 1614(6.20) | 38 | 1.3 | 1390(7.20) | 6 | 2.8 | 1250(8.00) | 19 | 1.2 |
| 1715(5.83) | 31 | 1371(7.30) | 11 | 1219(8.20) | 14 | ||||||
a refers to the band strength in pure HCOOH at 15 K.
| (C=O) | (OH/CH) | (C–O) | |||||||||
| out-of-phase | in-phase | ||||||||||
| FWHM | FWHM | FWHM | FWHM | ||||||||
| (K) | (cm-1(m)) | (cm-1) | (cm-1(m)) | (cm-1) | (cm-1(m)) | (cm-1) | (cm-1(m)) | (cm-1) | |||
| 50:50% HCOOH:H2O | |||||||||||
| 15 | 1708(5.85) | 48 | 1658(6.03) | 103 | 1.4 | 1391(7.19) | 37 | 1.1 | 1215(8.23) | 50 | 1.3 |
| 30 | 1709(5.85) | 39 | 1675(5.97) | 75 | 1.5 | 1391(7.19) | 37 | 1.2 | 1220(8.20) | 58 | 1.3 |
| 45 | 1711(5.85) | 36 | 1665(6.01) | 78 | 1.5 | 1391(7.19) | 36 | 1.3 | 1223(8.18) | 55 | 1.3 |
| 60 | 1710(5.85) | 33 | 1672(5.98) | 83 | 1.5 | 1391(7.19) | 35 | 1.3 | 1223(8.17) | 54 | 1.3 |
| 75 | 1709(5.85) | 35 | 1668(6.00) | 77 | 1.5 | 1391(7.19) | 34 | 1.4 | 1224(8.17) | 52 | 1.3 |
| 90 | 1709(5.85) | 34 | 1670(6.00) | 78 | 1.5 | 1391(7.19) | 33 | 1.5 | 1225(8.17) | 51 | 1.2 |
| 105 | 1709(5.85) | 35 | 1669(5.99) | 75 | 1.5 | 1392(7.19) | 34 | 1.7 | 1225(8.16) | 51 | 1.2 |
| 120 | 1710(5.85) | 37 | 1671(5.98) | 75 | 1.5 | 1395(7.17) | 42 | 3.1 | 1224(8.17) | 50 | 1.2 |
| 135 | 1713(5.84) | 45 | 1670(5.99) | 69 | 1.5 | 1403(7.13) | 59 | 6.4 | 1223(8.17) | 51 | 0.95 |
| 150 | 1707(5.86) | 10 | 1616(6.19) | 40 | 1.5 | 1391(7.19) | 7 | 3.8 | 1255(7.97) | 19 | 1.2 |
| 1720(5.82) | 16 | 1372(7.29) | 13 | 1222(8.18) | 17 | ||||||
| 165 | 1706(5.86) | 12 | 1619(6.18) | 34 | — | 1391(7.19) | 6 | — | 1253(7.98) | 18 | — |
| 1723(5.80) | 32 | 1373(7.29) | 12 | 1222(8.19) | 14 | ||||||
| 34:66% HCOOH:H2O | |||||||||||
| 15 | 1707(5.86) | 44 | 1652(6.05) | 95 | 1.6 | 1391(7.19) | 35 | 1.5 | 1216(8.23) | 46 | 1.3 |
| 30 | 1706(5.86) | 38 | 1688(5.92) | 94 | 1.7 | 1391(7.19) | 35 | 1.6 | 1224(8.17) | 56 | 1.3 |
| 45 | 1707(5.86) | 36 | 1667(6.00) | 83 | 1.7 | 1391(7.19) | 33 | 1.7 | 1226(8.16) | 51 | 1.3 |
| 60 | 1706(5.86) | 37 | 1668(6.00) | 77 | 1.7 | 1391(7.19) | 32 | 1.8 | 1226(8.15) | 50 | 1.3 |
| 75 | 1706(5.86) | 36 | 1669(5.99) | 75 | 1.7 | 1391(7.19) | 32 | 1.9 | 1227(8.15) | 49 | 1.3 |
| 90 | 1706(5.86) | 36 | 1670(5.99) | 74 | 1.7 | 1391(7.19) | 32 | 2.1 | 1227(8.15) | 49 | 1.3 |
| 105 | 1706(5.86) | 36 | 1671(5.98) | 73 | 1.7 | 1393(7.18) | 34 | 2.5 | 1227(8.15) | 48 | 1.3 |
| 120 | 1708(5.85) | 39 | 1674(5.98) | 73 | 1.7 | 1399(7.15) | 46 | 4.3 | 1226(8.16) | 48 | 1.2 |
| 135 | 1714(5.84) | 47 | 1670(5.99) | 69 | 1.7 | 1406(7.11) | 62 | 7.5 | 1224(8.17) | 51 | 1.0 |
| 150 | 1711(5.84) | 4 | 1617(6.18) | 42 | 1.6 | 1391(7.19) | 7 | 4.7 | 1256(7.96) | 18 | 1.2 |
| 1719(5.82) | 34 | 1371(7.29) | 13 | 1223(8.17) | 16 | ||||||
| 165 | ——— | – | 1621(6.17) | 32 | — | 1391(7.19) | 5 | — | 1255(7.97) | 16 | — |
| 1726(5.79) | 28 | 1372(7.29) | 11 | 1224(8.17) | 13 | ||||||
| 20:80% HCOOH:H2O | |||||||||||
| 15 | 1707(5.86) | 40 | 1643(6.09) | 81 | 1.8 | 1391(7.19) | 35 | 2.1 | 1215(8.23) | 44 | 1.2 |
| 30 | 1704(5.87) | 43 | 1667(6.00) | 89 | 1.8 | 1390(7.19) | 33 | 2.2 | 1227(8.15) | 55 | 1.3 |
| 45 | 1703(5.87) | 44 | 1660(6.02) | 77 | 1.9 | 1390(7.19) | 31 | 2.3 | 1230(8.13) | 47 | 1.3 |
| 60 | 1703(5.87) | 40 | 1669(5.99) | 83 | 1.9 | 1390(7.19) | 31 | 2.5 | 1229(8.13) | 48 | 1.3 |
| 75 | 1703(5.87) | 42 | 1664(6.01) | 76 | 1.9 | 1391(7.19) | 31 | 2.7 | 1229(8.13) | 47 | 1.3 |
| 90 | 1703(5.87) | 39 | 1670(5.99) | 79 | 1.9 | 1391(7.19) | 32 | 2.9 | 1229(8.14) | 46 | 1.3 |
| 105 | 1705(5.87) | 40 | 1668(5.99) | 75 | 1.9 | 1393(7.18) | 35 | 3.5 | 1228(8.14) | 46 | 1.2 |
| 120 | 1709(5.85) | 39 | 1675(5.97) | 76 | 1.9 | 1403(7.13) | 51 | 5.6 | 1227(8.15) | 47 | 1.1 |
| 135 | 1714(5.83) | 45 | 1673(5.98) | 72 | 1.9 | 1413(7.08) | 61 | 8.2 | 1225(8.16) | 49 | 0.93 |
| 150 | ——— | – | 1619(6.17) | 51 | 1.7 | 1392(7.19) | 8 | 6.1 | 1256(7.96) | 19 | 1.0 |
| 1717(5.82) | 41 | 1372(7.29) | 17 | 1223(8.17) | 19 | ||||||
| 165 | ———- | – | -1622(6.16) | 31 | – | 1392(7.18) | 4 | — | 1255(7.97) | 15 | — |
| 1730(5.78) | 27 | 1375(7.27) | 11 | 1226(8.16) | 11 | ||||||
| 9.4:91% HCOOH:H2O | |||||||||||
| 15 | 1708(5.86) | 38 | 1636(6.11) | 70 | 2.5 | 1391(7.19) | 35 | 4.9 | 1214(8.24) | 42 | 1.4 |
| 30 | 1706(5.86) | 40 | 1680(5.95) | 128 | 2.5 | 1388(7.21) | 31 | 4.9 | 1233(8.11) | 59 | 1.4 |
| 45 | 1698(5.89) | 45 | 1662(6.02) | 94 | 2.6 | 1389(7.20) | 29 | 5.2 | 1231(8.12) | 42 | 1.4 |
| 60 | 1699(5.89) | 55 | 1649(6.06) | 90 | 2.6 | 1388(7.20) | 28 | 5.6 | 1231(8.12) | 46 | 1.4 |
| 75 | 1698(5.89) | 49 | 1655(6.04) | 100 | 2.6 | 1388(7.20) | 28 | 5.8 | 1231(8.12) | 45 | 1.4 |
| 90 | 1700(5.88) | 52 | 1641(6.10) | 88 | 2.6 | 1389(7.20) | 30 | 6.2 | 1230(8.13) | 44 | 1.4 |
| 105 | 1701(5.88) | 50 | 1645(6.08) | 89 | 2.6 | 1391(7.19) | 34 | 7.2 | 1230(8.13) | 44 | 1.4 |
| 120 | 1706(5.86) | 47 | 1664(6.01) | 94 | 2.6 | 1402(7.13) | 52 | 9.5 | 1228(8.14) | 45 | 1.3 |
| 135 | 1713(5.84) | 46 | 1658(6.03) | 76 | 2.5 | 1415(7.06) | 59 | 11.3 | 1226(8.15) | 47 | 1.1 |
| 150 | 1718(5.82) | 43 | 1674(5.97) | 93 | 2.3 | 1404(7.12) | 67 | 10.5 | 1223(8.18) | 51 | 1.1 |
a refers to the band strength in pure HCOOH at 15 K.
| (C=O) | (C–O) | |||||||||
| out-of-phase | in-phase | out-of-phase | in-phase | |||||||
| FWHM | FWHM | FWHM | FWHM | |||||||
| (K) | (cm-1(m)) | (cm-1) | (cm-1(m)) | (cm-1) | (cm-1(m)) | (cm-1) | (cm-1(m)) | (cm-1) | ||
| 15 | 1721(5.81) | 15 | 1691(5.91) | 31 | 1.2 | 1231(8.12) | 29 | 1198(8.35) | 26 | 0.86 |
| 45 | 1717(5.82) | 18 | 1690(5.92) | 34 | 1.2 | 1235(8.10) | 24 | 1203(8.31) | 21 | 0.85 |
| 75 | 1716(5.83) | 11 | 1689(5.92) | 33 | 1.2 | 1234(8.10) | 24 | 1201(8.33) | 18 | 0.85 |
| 105 | 1716(5.83) | 13 | 1686(5.93) | 28 | 1.2 | 1234(8.10) | 21 | 1202(8.32) | 18 | 0.86 |
| 135 | 1725(5.80) | 13 | 1696(5.90) | 44 | 1.2 | 1230(8.13) | 27 | 1201(8.33) | 22 | 0.63 |
a refers to the band strength in pure HCOOH at 15 K.
| Mode | ||
|---|---|---|
| (cm-1) | ||
| 11:89% HCOOH:CO | ||
| (C=O) | 1743,1735, 1721, 1702 | 1.9 |
| (OH/CH) | 1390 | 3.0 |
| (C–O) | 1250, 1235, 1227, 1218, 1185, 1172, 1130 | 2.1 |
| 9:91% HCOOH:C18O2 | ||
| (C=O) | 1744, 1734, 1717, 1612 | 0.72 |
| (OH/CH) | 1387 | 1.4 |
| (C–O) | 1227, 1187, 1157, 1132 | 0.63 |
| 8:62:30% HCOOH:H2O:CO | ||
| (C=O) | 1705, 1685 | 4.7 |
| (C–O) | 1227 | 2.4 |
| 6:67:27% HCOOH:H2O:C18O2 | ||
| (C=O) | 1695 | 4.2 |
| (C–O) | 1229 | 1.5 |
| 6:68:26% HCOOH:H2O:CH3OH | ||
| (C=O) | 1703 | 3.7 |
| (C–O) | 1223 | 1.5 |
a refers to the band strength in pure HCOOH at 15 K.