The Role of Reconstructed Surfaces in the Intrinsic Dissipative Dynamics of Silicon Nanoresonators
Abstract
Dissipation in the flexural dynamics of doubly clamped nanomechanical bar resonators is investigated using molecular dynamics simulation. The dependence of the quality factor () on temperature and the size of the resonator is calculated from direct simulation of the oscillation of a series of Si 001 bars with bare dimerized surfaces. The bar widths range from 3.3 to 8.7 nm, all with a fixed length of 22 nm. The fundamental mode frequencies range from 40 to 90 GHz and from near 1000 K to near 50 K. The quality factor is shown to be limited by defects in the reconstructed surface.
pacs:
85.85.+j, 03.65.YzThere is currently much interest in ultrahigh frequency nanoscale mechanical resonators for both fundamental science and engineering applications. From a fundamental perspective, nanoelectromechanical systems (NEMS) are leading candidates for observing macroscopic quantum behavior schwab05 ; blencowe04 , while applications include force sensing and frequency generation ekinci05 ; cleland02 . Achieving the quantum limit requires resonators with fundamental mode frequencies in the radio-to-microwave frequency range that are also well separated from other low-lying modes on the scale of the resonance frequency width. The frequency width is determined by the mechanical energy damping rate and hence large quality factors are required. Force sensing and frequency generation applications also require large quality factors. For example, the relative uncertainty in a generated frequency is clark05 . It has also recently been demonstrated that nanoresonators can be used as mass detectors with sensitivities approaching the single Dalton (i.e., carbon atom mass) level yang06 ; ono03 ; ilic ; ekinci ; when a mass attaches to the resonator, the fundamental resonance frequency shifts and the ability to resolve this shift depends on the quality factor.
The energy dissipation of nanomechanical resonators is described in general by three mechanisms roukes ; foulgoc : (1) energy losses to the extrinsic environment through the attachment cross section of a resonator to its support substrate (‘clamping loss’), or through air friction; (2) intrinsic losses arising from anharmonicity (or phonon scattering), thermoelastic damping, electron-phonon coupling and the strain-driven motion of defects in the interior (bulk) of a resonator; and (3) intrinsic losses arising from analogous processes within the surface layers. For example, lattice defects can move in response to an applied strain and then relax via elastic radiation. The energy dissipated depends on both the microscopic structure of the defect dynamics and on the long-wavelength acoustic properties of the mechanical device and its surroundings. The quality factors of the fundamental flexural and other low-lying vibrational modes have been observed to decrease approximately linearly with decreasing resonator size ekinci05 . This size dependence is usually interpreted to be a signature of surface-related dissipation mechanisms being dominant in (sub-)micron scale resonators.
In this letter, we investigate the fundamental, intrinsic energy dissipation for doubly clamped silicon bar nanoresonators arising from the anharmonic interatomic potential and surface reconstruction; the resonators are in vacuum and support atoms kept fixed so that extrinsic loss mechanisms are suppressed. Direct numerical simulations of the dynamics of individual atoms are employed to examine how energy is transferred from the fundamental mode of interest to the other modes. We have extensively adapted the scalable, parallel molecular dynamics (MD) code MDCASK MDCASK to simulate and analyze the nanoresonator oscillation, making use of the Stillinger-Weber (SW) potential sw and the Tersoff potential ts to describe the interatomic interaction. These potentials involve nearest-neighbor two-body and three-body interactions parameterized empirically based on bulk elastic and thermodynamic properties of the Si diamond-cubic crystal and, for SW, its melt point. Both potentials are widely used and validated, achieving a reasonable description of many properties including surface structures and energies balamane . The use of both potentials in our simulations enables their systematic comparison in the modeling of mechanical dissipation in Si nanoresonators, for which their relative merits are not known a priori. Several authors jiang04 ; tangney ; zhao have used MD simulations to study energy dissipation in carbon nanotube oscillators. Our MD study of Si resonators is conducted in a manner similar to that used previously for the oscillations of quartz resonators BMVK ; RB .
The simulations focus on single-crystal diamond-cubic Si 001 bars with 100 faces. To accommodate the symmetric dimer surface reconstruction, square cross sections of unit cells are selected with even : , corresponding to widths of 3.26, 4.34, 5.43, 6.52, 7.6 and 8.69 nm. The bar length is fixed to be 40 unit cells ( nm). Including the dimer atoms on the surface, the number of atoms in these bars ranges from 12,360 to 84,360 atoms. The bars are initially thermalized and mechanically equilibrated at 50 K, 100 K, 200 K, 300 K and 1000 K. The thermostat is then turned off for the duration of the simulation: 3,000 ps (3 million time steps). In order to clamp both ends of the bars, the positions of the atoms initially within one unit cell at both ends of the bar are kept fixed. The lowest flexural mode is excited by adding an initial transverse velocity in the -direction to each atom on the resonator, varying with according to the normal mode derived from linear continuum elasticity ll . The initial amplitude is chosen to be of the bar width.
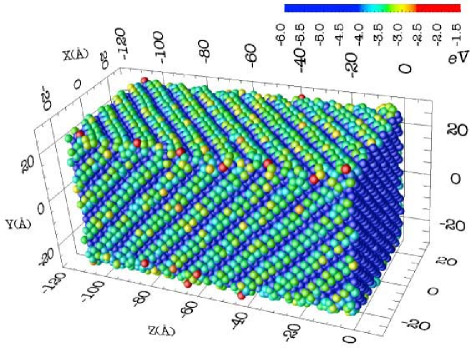
When the bars are “plucked” in the direction, the -mode energy is transferred partially over time into the -direction mode, as evidenced by the center of mass trajectory shown in Fig. 1. The energy transfer between the two transverse modes is attributed to the fact that the silicon dimer atoms on the bar surface align themselves in the diagonal direction as shown in Fig. 2. The dimerized surface of the bar breaks the cubic symmetry of the bulk and, we infer, induces the mixing of the two transverse modes. A tiny amount of the transverse mode energy is also transfered into the longitudinal mode in the direction, but the transfer is very limited due to the clamping at both ends.
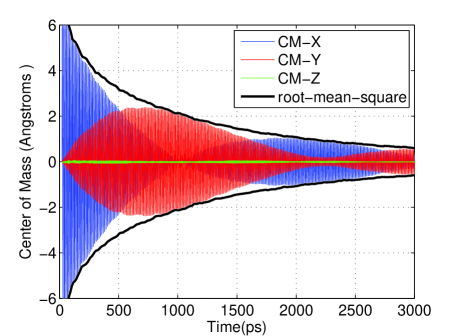
The quality factor is calculated as the ratio of the mode frequency to the energy damping rate, , where the frequencies of the dominant amplitude modes are identified from the peaks of the Fourier transform of the center of mass position. The frequencies for the two dominant transverse modes are very close to each other, giving rise to the beat pattern observed in Fig. 1. The damping rate is extracted as twice the slope in the time trajectory of the log of the envelope of the amplitude which is found to decay exponentially at a constant rate to a good approximation, as shown in Fig. 3. Due to the mode mixing, the amplitude is taken to be the root-mean-square of the sum of the mean-adjusted center-of-mass amplitudes in all three directions.
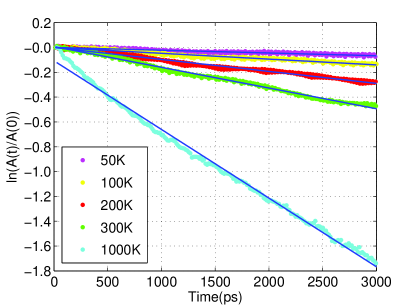
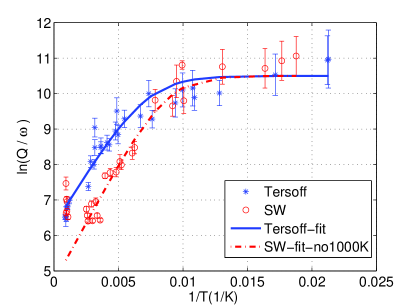
The temperature dependence of the damping rates for the various bars is plotted in Fig. 4. The fundamental mode frequencies range from 40 to 90 GHz, increasing with bar thickness and decreasing slightly with temperature. As the temperature increases, the quality factor decreases from near 50 K down to near 1000 K. The room temperature values are of the order of, but somewhat larger than, the highest quality experimental microresonators scaled to the simulated sizes ekinci05 . Quantitatively, the damping can be attributed to an athermal process which dominates at low temperatures and a thermal relaxation process which is manifested at room temperatures. Denote the corresponding damping rates for the two processes to be and respectively:
| (1) |
where is the mode frequency of the resonator and the athermal process is assumed to have the constant damping rate for both Tersoff and Stillinger-Weber bars. describes the thermal relaxation process in a standard linear solid and behaves according to Arrhenius’ law defectq ,
| (2) |
where is the activation energy and is the constant damping rate in the high temperature limit.
The curves in Fig. 4 give the best fits of this functional form to the two data sets. The fitted athermal damping rate is ps-1 for both interatomic potentials. The thermal damping rate is estimated to have ps-1 and meV for the Tersoff case while ps-1 and meV for the Stillinger-Weber case. When extracting these fitting parameters we have excluded the Stillinger-Weber bars near 1000K where an additional relaxation process appears to take place. We will discuss the high temperature regime in more detail below.
Over the course of the simulation various degrees of surface roughening are observed as shown in Fig. 2. In most bars the roughening on the surfaces and the edges is more pronounced at higher temperatures and there is less roughening in the Tersoff bars, which correspondingly have less damping and higher ’s than the Stillinger-Weber bars. At higher temperatures, a greater portion of the edge region was roughened as compared with the interior surface and bulk regions. This observation is consistent with theoretical and experimental studies on edge roughening of equilibrium crystal shapes, which can be explained by the thermal relaxation of the steps on the surface jeong ; marchenko ; shenoy . The activation energies extrapolated from Fig. 4 are smaller than the activation energies for various diffusion processes of Si dimers on the surface, ranging between 0.7 eV to 1.36 eV borovsky . In fact they are comparable to step creation energies; e.g., 10 meV/ for the single-layer step, denoted as , or 50 meV/ for the double-layer step, denoted as , where type refers to the steps with dimer rows on the upper terrace oriented parallel (perpendicular) to the step edge chadi and Å is the surface lattice constant. Hence the dissipation is very likely dominated by the thermal relaxation of the step edges and not by the diffusion of dimers.
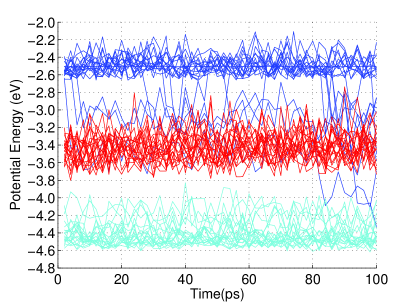
The coloring of the atoms according to their potential energies in Fig. 2 suggests that the atoms cluster into three energy “bands”, denoted here as the edge atoms whose energy are greater than -3 eV, the bulk atoms with energy less than -4 eV and the surface dimer atoms with energy between -3 eV and -4 eV. Figure 5 is a sample plot of randomly selected atoms in each band. Most atoms remain within the same energy band throughout the simulation. As temperature rises, more atoms hop between bands. All the atoms that undergo the largest energy hopping are located within one unit cell or so from the geometric edges. The work done by the fundamental mode on the atoms during these hops is released irreversibly and leads to dissipation. We find that the activation energies associated with the hopping rates are of the same order of magnitude as those extracted from Fig. 4.
Another observation is that the fitted damping rates in Fig. 4 do not seem to depend on the bar size. This invariance is another indication of the quality factor being limited by defects near the geometric edge regions. When the edge defects dominate the dissipation, different cross section but equal length bars are expected to have similar damping rates at a given temperature. Current experiments ekinci05 ; carr ; yasumura ; liu ; yang , on the other hand, involve larger silicon resonators than those in our simulations. These resonators, usually made from a top-down approach, are expected to have vicinal surfaces with step edges in addition to the geometrical edges. The typical width between regularly spaced step arrays ranges between 2-10 nm crook ; itoh . When the resonator dimensions are large as compared with the step spacings, the damping rate is expected to depend on the surface area.
At room temperature the vicinal silicon surface shows a double-step reconstruction above a critical miscut angle of while at smaller miscut angles the single-layer steps dominate the surface alerhand ; wierenga . For surface with a large miscut angle, a phase transition from to steps has been observed near 800 K barbier . Hence the smaller formation energy of steps may be related to the smaller slope in Fig. 4 for the Stillinger-Weber bars near 1000K.
In conclusion, we have conducted the first systematic study of dissipation and the resulting quality factors of nanoscale bar resonators using molecular dynamics simulations, finding that the quality factors of the Si nanoresonators are dominated by thermal relaxation of the step edges. Furthermore, transfer of energy between modes with polarization transverse to the surfaces is observed, due to symmetry breaking of the bulk by the dimer surface reconstruction. The present results further reinforce the relevance of the surface for the mechanical properties of nanoscale resonators.
We thank Mike Geller and Makoto Itoh for useful discussions and the Research Computing Department at Dartmouth College for their technical support. This work was supported in part the National Science Foundation under NIRT grant no. CMS-0404031 and by the National Center for Supercomputing Applications (NCSA), utilizing Xeon Linux Cluster under Grant no. DMR050043N and the TERAGRID MRAC Grant no. DMR060023N. R.E.R.’s work was performed under the auspices of the U.S. Dept. of Energy by the Univ. of California, Lawrence Livermore National Laboratory, under Contract W-7405-Eng-48.
References
- (1) K. C. Schwab and M. L. Roukes, Physics Today 58 (7), 36 (2005).
- (2) M. P. Blencowe, Phys. Rep. 395, 159 (2004).
- (3) K. L. Ekinci and M. L. Roukes, Rev. Sci. Inst. 76, 061101 (2005).
- (4) A. Cleland, Foundations of Nanomechanics (Springer, Heidelberg, 2002).
- (5) J. R. Clark, W.-T. Hsu, M. A. Abdelmoneum, and C. T.-C. Nguyen, J. Microelectromech. Syst. 14, 1298 (2005).
- (6) Y. T. Yang, C. Callegari, X. L. Feng, K. L. Ekinci, and M. L. Roukes, Nano. Lett. 6, 583 (2006).
- (7) T. Ono, X. Li, H. Miyashita, and M. Esashi, Rev. Sci. Inst. 74, 1240 (2003).
- (8) B. Ilic et al., J. Appl. Phys. 95, 3694 (2004).
- (9) K. L. Ekinci, X. M. H. Huang, and M. L. Roukes, Appl. Phys. Lett. 84, 4469 (2004).
- (10) M. L. Roukes, Technical Digest of the 2000 Solid-State Sensor and Actuator Workshop. Hilton Head Isl. NC. (2000); also available at http://arxiv.org/ftp/cond-mat/papers/0008/0008187.pdf.
- (11) B. Le Foulgoc et al., J. Micromech. Microeng. 16, S45-S53 (2006).
- (12) M. J. Caturla et al., J. Nucl. Mater. 296, 90 (2001); The code is available at www.llnl.gov/asci/platforms/purple/rfp/benchmarks/limited/mdcask/ (last updated March 2002).
- (13) F. H. Stillinger and T. A. Weber, Phys. Rev. B 31, 5262 (1985).
- (14) J. Tersoff, Phys. Rev. B 39, 5566 (1989).
- (15) H. Balamane, T. Halicioglu, and W. A. Tiller, Phys. Rev. B 46, 2250 (1992).
- (16) H. Jiang et al., Phys. Rev. B 93, 185501 (2004).
- (17) P. Tangney, S. G. Louie, and M. L. Cohen, Phys. Rev. Lett. 93, 065503 (2004).
- (18) Y. Zhao et al., Phys. Rev. Lett. 91, 175504 (2003).
- (19) J. Q. Broughton, C. A. Meli, P. Vashishta, and R. K. Kalia, Phys. Rev. B 56, 611 (1997).
- (20) R. E. Rudd and J. Q. Broughton, J. Mod. Sim. Microsys. 1, 29 (1999).
- (21) L. D. Landau and E. M. Lifshitz, Theory of Elasticity (Addison-Wesley, Massachusetts USA, 1959).
- (22) A. S. Nowick and B. S. Berry, Anelastic Relaxation in Crystalline Solids (Academic, New York, 1972).
- (23) H. C. Jeong and E. Williams, Surf. Sci. Rep. 34, 171 (1999).
- (24) V. I. Marchenko, Sov. Phys. J. Exp. Theor. Phys. Lett. 33, 397 (1981).
- (25) V. B. Shenoy and W. Saam, Surf. Sci. 467, 58, (2000).
- (26) B. Borovsky, M. Krueger, and E. Ganz, Phys. Rev. Lett. 78, 4229 (1997).
- (27) D. J. Chadi, Phys. Rev. Lett. 59, 1691, (1987).
- (28) D. W. Carr et al., Appl. Phys. Lett. 75, 920 (1999).
- (29) K. Yasumura et al., J. Microelectromech. Syst. 9, 117 (2000).
- (30) X. Liu et al., J. Appl. Phys. 97, 023524 (2005).
- (31) J. Yang, T. Ono, and M. Esashi, J. Vac. Sci. Technol. B 19(2), 551 (2001).
- (32) G. E. Crook, L. Däweritz, and L. Ploog, Phys. Rev. B. 42, 5126 (1990).
- (33) H. Itoh et al., Surf. Sci. Lett. 277, L70 (1992).
- (34) O. L. Alerhand et al., Phys. Rev. Lett. 64, 2406 (1990).
- (35) P. E. Wierenga et al., Phys. Rev. Lett. 59, 2169 (1987).
- (36) L. Barbier and J. Lapujoulade, Surf. Sci. 253, 303 (1991).