Low energy cut-offs and hard X-ray spectra in high- radio-loud quasars: the Suzaku view of RBS 315
Abstract
We present the results from the Suzaku observation of the powerful radio-loud quasar RBS 315 (), for which a previous XMM-Newton observation showed an extremely flat X-ray continuum up to 10 keV (photon index ) and indications of strong intrinsic absorption ( cm-2 assuming neutral gas). The instrument for hard X-rays HXD/PIN allows us a detection of the source up to 50 keV. The broad-band continuum (0.5-50 keV) can be well modeled with a power-law with slope (definitively softer than the continuum measured by XMM-Newton) above 1 keV with strong deficit of soft photons. The low-energy cut-off can be well fitted either with intrinsic absorption (with column density cm-2 in the quasar rest frame) or with a break in the continuum, with an extremely hard () power-law below 1 keV. We construct the Spectral Energy Distribution of the source, using also optical-UV measurements obtained through a quasi-simultaneous UVOT/SWIFT observation. The shape of the SED is similar to that of other Flat Spectrum Radio Quasars (FSRQs) with similar power, making this source an excellent candidate for the detection in -rays by GLAST. We model the SED with the synchrotron-Inverse Compton model usually applied to FSRQs, showing that the deficit of soft photons can be naturally interpreted as due to an intrinsic curvature of the spectrum near the low energy end of the IC component rather than to intrinsic absorption, although the latter possibility cannot be ruled out. We propose that in at least a fraction of the radio-loud QSOs at high redshift the cut-off in the soft X-ray band can be explained in a similar way. Further studies are required to distinguish between the two alternatives.
1 Introduction
Blazars represent the most active side of Active Galactic Nuclei due to a priviledged aspect angle enhancing the emission from the jet with respect to that from the accretion disk. The strongly variable non-thermal continuum, extending from the radio to the high-energy –rays, produced within the jet (with bulk Lorentz factors ) is strongly amplified in the forward direction by relativistic beaming. The short variability timescale (down to hours) indicates that the emission region must be located quite close to the central engine, at distances of the order of 0.01–0.1 pc. Therefore, studying emission from blazars we can probe the physical state of the jet close to its base, allowing important insights on the physical mechanism able to produce such extreme structures. The double-humped Spectral Energy Distribution displayed by blazars (Sambruna et al. 1996, Fossati et al. 1998) is generally described in terms of synchrotron (contributing from the radio to the UV-X-ray range) and Inverse Compton (extending from X-rays to -rays) emission from a single population of relativistic electrons (e.g., Ghisellini et al. 1998). The peaks of the two components show a clear trend with the total emitted power (Fossati et al. 1998). For low power sources ( bolometric luminosity erg/s) the synchrotron peak falls in the UV - X-rays and the IC peak in the multi GeV-TeV range. In high power sources (bolometric luminosity erg/s), the synchrotron peak is located in the submm-FIR band, while the IC component, usually dominating the total radiative output, peaks in the MeV-GeV region. Thus in low-luminosity blazars (mostly BL Lac objects) X-rays probe the high energy end of the synchrotron component allowing the investigation of the dynamics of high-energy electrons, while for powerful blazars (belonging to the FSRQ class) the X-ray emission is produced via the IC process by relatively low energy electrons.
The study of the X-ray portion of the SEDs of FSRQ is crucial for different reasons. First of all, the hard X-ray spectrum of FSRQ is generally attributed to the IC radiation produced by low-energy electrons scattering ambient photons (External Compton emission). Its investigation offers the only possibility to probe directly the low energy portion of the electron distribution which is essential for estimating the total power of the jet (e.g., Maraschi & Tavecchio 2003) and is unaccessible at radio frequencies because of self-absorption. Moreover, the slope of the X-ray continuum, directly connected to the slope of the underlying population of low-energy electrons, can provide important constraints on the acceleration mechanisms acting on the relativistic electrons. A good description of the continuum requires broad band observations (0.1-100 keV). Unfortunately, few FSRQs have high statistics above 10 keV, most of them obtained in the past decade with the PDS instruments onboard SAX (e.g., Tavecchio et al. 2000, 2002). The joint fit of the medium (2-10 keV) and the hard (above 10 keV) X-ray data revealed in same cases the presence of very hard spectra, with slopes above 2–3 keV (here and in the following is defined as ). These results have been recently extended using observations with SWIFT (Sambruna et al. 2006a, 2007), although in these cases the data in the hard X-rays represent averages over months. The presence of such hard spectra is difficult to reconcile with the standard picture considering the formation of power law distributions through shock acceleration or cooling of high energy electrons (e.g., Sikora et al. 2002).
The medium-soft X-ray spectrum may reveal the very low end of the EC component and therefore of the relativistic electron spectrum. Around these energies a “break” is expected in the EC emission which is the “footprint” of the thermal photon population. While above the break the slope of the spectrum is connected to the slope of the electron distribution, below the break the slope of the spectrum should instead reveal the spectral distribution of the ambient photons. Similar “convex” spectra have in fact been observed in some intermediate redshift FSRQs (e.g., Tavecchio et al. 2000, 2002). An important consequence of the detection of such a break is the determination of the mimimum Lorentz factor of the emitting electrons, a key parameter for the determination of the kinetic power carried by the jet (e.g., Celotti & Fabian 1993). However, the situation can be more complex, with the simultaneous presence in this band of different components, such as the Synchrotron Self-Compton emission and, as recently pointed out by Celotti, Ghisellini & Fabian (2007), the spectral components originating from the “bulk Comptonization” of ambient photons by cold electrons in the jet.
The interpretation of the shape of the soft X-ray continuum is not unique. In fact, in several high-redshift blazars (; e.g., Yuan et al. 2006 and references therein) the steepening of the soft X-ray spectrum is interpreted in terms of absorption by a dense region of (warm) plasma ( cm-2) present in the region surrounding the QSO (expected to be in the form of a wind/outflow, e.g., Fabian 1999). If confirmed, the presence of this large amount of absorbing gas in the vicinity of the jet, would have strong consequences for the structure of the jet and its interaction with the ISM.
An excellent laboratory to address most of the issues discussed above is the FSRQs RBS 315 (from the Rosat Bright Survey, Schwope et al. 2000; also known as GB6 J0225+1846, ), for which a previous XMM-Newton observation revealed the presence of an extremely hard X-ray continuum (photon index , Page et al. 2005, Piconcelli & Guainazzi 2005) and a strong deficit of soft photons. With the aim of obtaining a better description of the broad band X-ray continuum we asked for a Suzaku observation. In the same days of the Suzaku observation we obtained a Target of Opportunity short pointing ( s) with SWIFT. In the following we report the data analysis (Sec.2), the results (Sec.3) and the modelling of the derived SEDs (Sec.4). The discussion is given in Sec.5, where we explore in particular the possibility that the convex spectrum reflects the intrinsic curvature of the IC component. Conclusions are reported in Sec.6. Throughout this work we use the following cosmological parameters: , , .
2 Observations and data reduction
2.1 Suzaku
The Suzaku payload (Mitsuda et al. 2007) carries four X-ray telescopes sensitive in the 0.3-12 keV band (XIS, Koyama et al. 2007), with CCD cameras in the focal plane, together with a non-imaging instrument (HXD, Takahashi et al. 2007), sensitive in the 10-600 keV band, composed by a Si-PIN photo-diodes detector (probing the 10-60 keV band) and a GSO scintillator detector (sensitive above 30 keV). Three XIS units (XIS0, 2 and 3) have front-illuminated CCDs, while XIS1 uses a back-illuminated CCD, more sensitive at low energies.
RBS 315 was observed with Suzaku from 2006 July 25 19:36:03 UT to 2006 July 27 00:58:19 UT (sequence number 701077010). The total on-source time was 49.3 ksec. To increase the sensitivity of the HXD the observation was performed at the HXD aim-point. HXD/GSO data are not used in the following analysis, since the performances and the background of the GSO at the flux level expected for RBS 315 are still under study. The analysis have been performed with the data obtained through the last version of the processing (v1.2) and the last release of the HEASoft sofware (v6.1.2) and calibrations. A more extended discussion of the procedure used can be found in Kataoka et al. (2007). No significant variability is detected within the observations (see Fig.1), therefore spectra were extracted over the whole exposure.
2.1.1 XIS data reduction and analysis
The reduction followed the prescriptions suggested in “The Suzaku
Data Reduction Guide”111http://suzaku.gsfc.nasa.gov/docs/suzaku/analysis/abc/;
see
also http://www.astro.isas.ac.jp/suzaku/analysis/. Using the
HEASoft tool xselect we select good time intervals, excluding
epochs of high background (when the satellite crosses the South
Atlantic Anomaly or the object is too close to the rim of the
Earth). After screening the net exposure time is 35.4 ksec. Events are
then extracted in a circle centered on the source with a radius of
4.6’. Background events are extracted in a similar circle centered in
a region devoid of sources. We checked that the use of
different source and background regions do not significantly affect
the resulting spectra. Response (RMF) and auxiliary (ARF) files are
produced using the tools developed by the Suzaku team (xisrmfgen and xissimarfgen) distributed with the last version
of HEASoft. ARFs are already corrected for the degradation of the XIS
response using the tool xiscontamicalc.
2.1.2 HXD/PIN data reduction and analysis
HXD/PIN data are reduced following the procedure suggested by the Suzaku team. The HXD/PIN spectrum is extracted after the selection of good time intervals (analogously to the XIS procedure). To the extracted spectrum (obtained through xselect) we applied the suggested Dead time correction (of the order of 5%). The net exposure time after screening is 40.2 ksec.
Response and non X-ray background (NXB) files are directly provided by the Suzaku team. For technical reasons, after 2006 May 24 the response of the PIN has changed, therefore we used response and background files calculated for this epoch. Note also that, since the background level of HXD/PIN is extremely low, the background event files are generated with a ten times scaled level than the actual background to avoid introducing a large statistical error. The EXPOSURE keyword in the background file has to be changed before the analysis. An important issue in the analysis of the HXD/PIN data concerns the estimate of the Cosmic X-ray Background, whose spectrum peaks just in this band. We followed the procedure suggested by the Suzaku team (see also Kataoka et al. 2007), simulating the expected contribution of the CXB from the entire PIN Field of View (), assuming the HEAO-1 spectrum between 3 and 60 keV (Boldt 1987, Gruber et al. 1999):
| (1) |
It is worth noting that the normalization of the CXB is still under debate, since the level measured by HEAO-1 in the 2-10 keV band appears to be below (with a difference of about 20%) that measured by more recent missions. However, a recent analysis of the data of the PDS instrument (in the band 15-50 keV) onboard BeppoSAX seems to confirm the HEAO-1 spectrum, but with a slightly larger normalization (Frontera et al. 2007). For comparison in Fig.(2) we report the total PIN spectrum (open circles), the total background (CXB+NXB, filled circles), the NXB (asterisks) and the net PIN spectrum resulting from the background subtraction (open squares). The net counts represent about 10% of the total counts. Roughly, the CXB flux account for 5% for the HXD/PIN background. We have binned the HXD/PIN spectra so that each bin contains almost same number of signal photons222We rebinned the data with the grppha tool using group 0 31 2 32 63 4 64 95 8 96 127 32 128 255 64. With this choice each bin has a S/N ratio of about 4.
2.2 SWIFT
SWIFT (Gehrels et al. 2004) observed RBS 315 two times: on 28/7/2006 from 18:42:40 UT to 20:45:10 UT (for a net exposure of 4152 s) and 31/7/2006 from 15:48:12 UT to 16:21:23 UT (for a net exposure of 1983). XRT and UVOT data have been analized as detailed in Foschini et al. (2007), using the same version of the software and calibration. For XRT we use the data in photon counting mode, selecting events with grades 0-12.
2.3 XMM-Newton
We reanalized the XMM-Newton data of the observation of RBS 315 performed on 2003 July 25, previously reported by Page et al. (2005) and Piconcelli & Guainazzi (2005). For processing, screening and analysis of the data we used the same procedure described in Foschini et al. (2006a), with the latest version (v.7.0.0) of XMM SAS and updated calibration files (20/7/2006). PN, MOS1 and MOS2 instruments were operated in the full-frame mode. No soft-protons flares occurred during the exposure: the total exposure time was about 20 ksec on each detector (18 for PN and 22 for MOS).
3 Results
We fit the data with the XSPEC package (v.11.3.2). XIS spectra were rebinned with a minimum of 50 counts per bin. We checked that all the XIS units provide consistent results (differences in the cross-normalizations are of the order of 5%): therefore we decided to perform joint fits of all the XIS0,1,2 and 3 spectra. To avoid problems with the calibration at low energy, we limit the fit to the range 0.7-10 keV for XIS0,2,3 and to 0.5-10 keV for the XIS1. We also limit the analysis of the PIN spectrum to the range 12-60 keV (see Kataoka et al. 2007). All the errors in the parameters are intended at the 90% for one parameter of interest ().
3.1 XIS spectra
A power law model with absorption fixed to the Galactic value ( cm-2, Dickey & Lockman 1990) clearly does not provide an adequate fit to the XIS data (Tab.1, the data/model ratio is reported in Fig.3). If we allow the absorption to vary we obtain a great improvement of the fit (), but the value of is clearly in excess to the Galactic one ( cm-2). Then we try to fit the spectrum assuming Galactic absorption and a broken power law model. The fit is good () and it requires a rather hard spectrum below 1 keV (). An alternative possibility is to assume that the intrinsic spectrum is well reproduced by a power-law with the required extra-absorption provided by (neutral) absorbing material in the quasar environment. Therefore we model the data assuming the zwabs model in XSPEC (plus the Galactic absorption). Again, the best fit is good, with the value of the () almost coincident with that obtained with the broken power-law model. The value of the required intrinsic absorption is rather large, cm-2 (assuming solar abundance), close to the value found by XMM-Newton (Page et al. 2005, Piconcelli & Guainazzi 2005).
3.2 Combined XIS-PIN spectra
We perform joint XIS and PIN fits (results in Tab.2), allowing a free normalization factor between the XISs and the PIN to take into account the uncertainty in the XIS/PIN cross-normalization (of the order of 15% at the HXD nominal position333see http://suzaku.gsfc.nasa.gov/docs/suzaku/processing/v1223.html). All the best fit parameters are consistent with those obtained from the fit of the XIS alone. The required cross normalization factor is around 20%, compatible with the instrumental uncertainty. In Fig.(4) we show the spectrum and the data/model ratio for the fit with the broken power-law and Galactic absorption.
3.3 SWIFT/XRT
Due to the short exposure, the XRT data do not provide strong constraints on the spectral parameters. Fitting the data obtained summing the two observations with a power-law absorbed in the quasar rest frame we derive values consistent with those of Suzaku : , cm-2, erg cm-2 s-1 with .
3.4 Comparison with the XMM-Newton observation
We fitted the data in the 0.2-10 keV range, after rebinning so that each energy bin contained a minimum of 50 counts. Results are presented in Tab.3.
As already noted by Page et al. (2005) and Piconcelli & Guainazzi (2005), a single power-law and Galactic absorption does not provide an adequate fit to the XMM-Newton data. The fit is satisfactory if we allow intrinsic absorption or a broken-power law shape for the continuum (Tab.3). Consistently with the analysis of Page et al. (2005) and Piconcelli & Guainazzi (2005) the broken power law model provides a worst fit than the absorbed power-law model. In our case, however, the broken power-law model is still accettable, while Piconcelli & Guainazzi (2005) concluded that the broken power law model yelds an unaccettable fit (with ). The difference with our analysis is probably due to the refined calibrations used in the more recent version of the software. Note, moreover, that Piconcelli & Guainazzi (2005) used the MOS data in the restricted range 0.8-10 keV, while the improved calibration allows us to use of the whole range 0.2-10 keV.
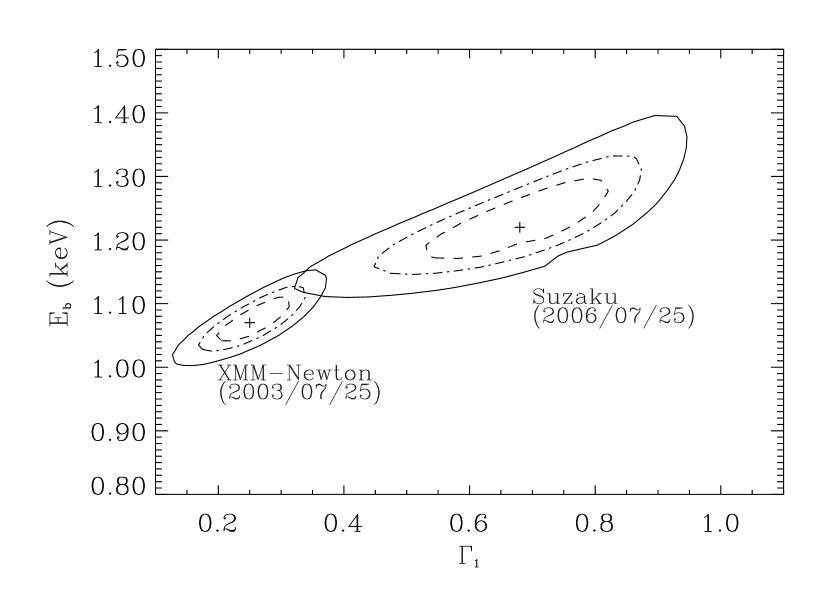
In Fig.(5) we report the confidence levels (at 68%, 90% and 99%) for the fit with the power-law absorbed by gas in the quasar rest frame and for the broken power-law model, calculated for our Suzaku observation and for the XMM-Newton data. Although the required amount of absorbing gas is almost consistent between the two observations, the slope of the power-law is clearly different in the two cases. During the Suzaku observation the power law is clearly softer () than the previous XMM-Newton observation (). On the other hand, the low energy slope and the break energy of the broken power law are marginally consistent.
4 Spectral Energy Distribution and modeling
In Fig.(6) (upper panel) we report the SED of RBS 315 constructed using archival radio data from NED, the optical-UV fluxes obtained with UVOT and Suzaku data deconvolved for the case of an intrinsically curved X-ray spectrum. Optical data have been corrected for Galactic absorption using the maps of Schlegel et al. 1998 reporting mag. If absorption is important in the quasar rest frame, the points should be considered as lower limits to the real flux.
For comparison, in the lower panel we report the SED of 0836+710 (from Tavecchio et al. 2000), a well known -ray loud blazar (also characterized by an extremely flat X-ray continuum and showing indications of absorption/hardening at low energy), located at comparable distance (). The similarity between the two SEDs is remarkable, strongly supporting the classification of RBS 315 as a blazar. Both sources lies at the top of the so-called blazar sequence (Fossati et al. 1998) with apparent luminosities in excess of erg/s. The comparison also suggests that RBS 315 should be quite bright in the -ray band, although it was not not detected by EGRET/CGRO. We expect that GLAST, with its wide field of view, allowing the complete monitoring of the sky in few hours and higher sensitivity, should easily detect RBS 315.
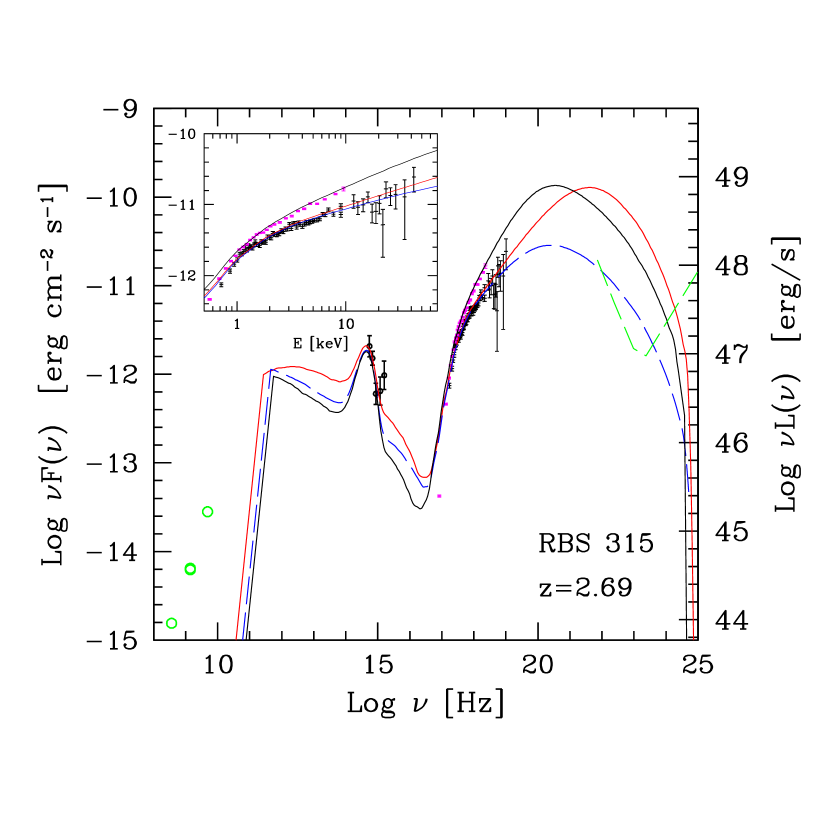
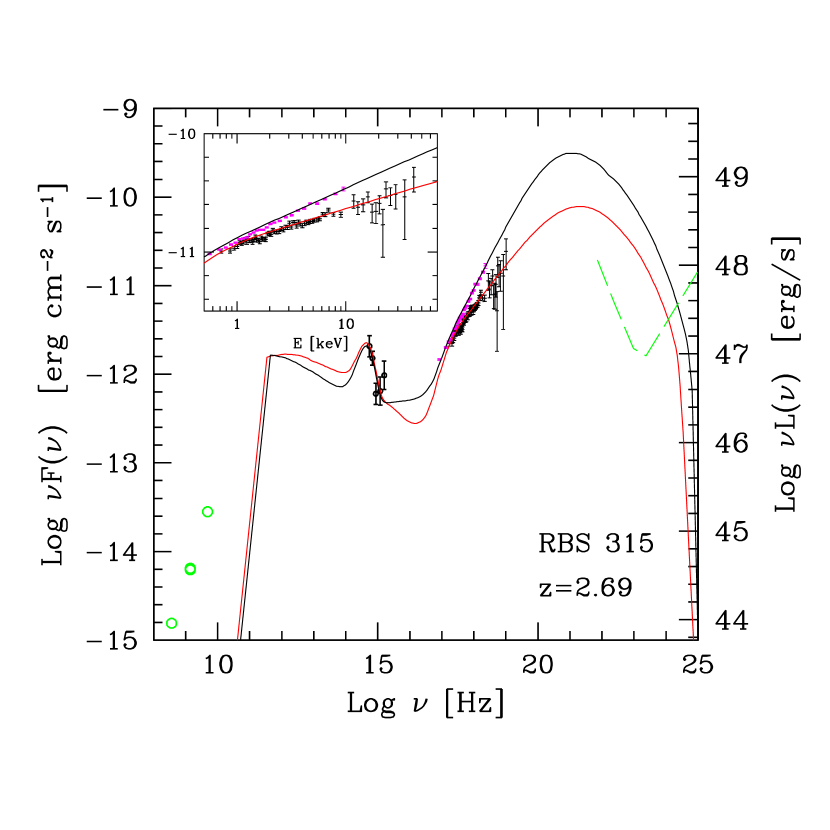
Given the ambiguity on the shape of the intrinsic X-ray continuum, in the following we will discuss the SEDs for RBS 315 separately for the case of intrinsic curvature (Curved, C), and for the absorbed power law (Absorbed, A). The X-ray data, unfolded with the two models, are shown in Figs.(7)-(8). In the second case the intrinsic X-ray spectrum emitted by the jet is a straight power-law We consider both the X-ray state corresponding to the XMM-Newton observation in 2003 and that observed by Suzaku in 2006.
The optical-UV points probably trace the so-called “blue bump”, i.e. the direct emission from the accretion disk, whose luminosity is then rather large, erg/s.
We reproduced the SED with the standard model for blazars, assuming synchrotron and IC (both SSC and EC) emission from relativistic electrons in the jet. Specifically (see Maraschi & Tavecchio 2003 for a full description) we assume a spherical region with radius , moving with bulk Lorentz factor at an angle of view with respect to the line of sight (under these conditions the relativistic Doppler factor is ). The region is filled by a tangled magnetic field and by relativistic electrons, assumed to follow a smoothed broken power-law energy distribution between the Lorentz factors and , with slopes and before and after the break at . This purely phenomenological form has been assumed to reproduce the observed shape of the blazar SEDs, without any specific assumption on the acceleration/cooling mechanism acting on the particles. With this choice we are allowed to assume extreme low-energy slopes () such as those required for RBS 315 in 2003, which cannot be obtained under standard conditions. If the radiative cooling timescale is shorter than the light crossing time of the source we expect . We remind that the model cannot reproduce the emission in the radio band since the source is opaque in this band due to synchrotron self-absorption. The radio emission is generally assumed to originate from larger regions of the jet, downstream to the blazar region.
The IC process involves both the synchrotron photons (Synchrotron self-Compton, Maraschi et al. 1992) and ambient photons (from the disk [Dermer & Schlickeiser 1993] and/or reprocessed by the Broad Line Region [Sikora et al. 1994]) entering the jet (External Compton). In sources like RBS 315 the EC emission dominate the high-energy component, while the SSC component could contribute in the soft X-ray band.
In the case in which the ambient photons are dominated by the emission from the BLR clouds it is customary to model the external photon spectrum with a black body shape peaking around Hz (e.g., Ghisellini et al. 1998). Although rather crude, the IC spectra derived from this approximation reproduces quite well more refined spectra calculated taking into account the exact shape of the BLR spectrum (Tavecchio et al., in prep.). To calculate the EC spectra we have also to assume the energy density of the BLR radiation, , given by: . Unfortunately we could not found useful information on , the luminosity of the emission lines of this source. Therefore we indirectly fix assuming that optical-UV emission directly measure the disk luminosity, , and that a fraction of the disk emission is reprocessed by the BLR (this is consistent with the results obtained for the few sources in which a measure of the disk and line luminosity is simultaneously available, e.g., Sambruna et al. 2006b). The luminosity-radius relations for the BLR (Kaspi et al. 2005, Bentz et al. 2006) extrapolated at these large luminosities would imply quite large BLRs, with radii cm. These large radii would imply small . However, the validity of these relations in these extreme regimes is not tested. Moreover, besides the BLR radiation, we may have the radiation coming directly from the accretion disk and/or isotropized by intercloud scattering material. Therefore we assume cm, which implies a relatively large radiation energy density.
The models are reported in Figs.(7)-(8) and the model parameters are reported in Tab.(4), together with the derived jet radiative luminosity and jet power (see the Discussion). We report the models calculated both in the case of the X-ray spectrum measured by XMM-Newton in 2003 and that derived by Suzaku in 2006.
In Fig. (7) we report the models for the C case (the insert shows a zoom on the X-ray band). The high-energy emission, from X-rays to -rays, is dominated by the EC component. This can be approximately described by three power laws: 1) an extremely hard power law below a “break frequency” Hz (where Hz, , , values typically derived in these sources, e.g., Tavecchio et al. 2000); 2) a power law with spectral index between and (marking the position of the EC peak); 3) a steeper power law with slope up to the frequency . We remark that the steepening of the spectrum below is required by the standard emission models for this kind of sources, although the precise shape and position of the break depends on the jet parameters and on the assumed underlying ambient photon population (Tavecchio et al., in prep). In particular, the slope below reflects the shape of the underlying soft photons. Using the black-body approximation the resulting spectrum is . The slope of the power law above , , is fixed by the measured slope of the power-law derived from the fitting of the X-ray data. Note that the presence of a strong depression between the UV-optical and the soft-X-ray band requires a minor contribution from the SSC component, which peaks just in this region.
Without any information on the -ray emission, the values of and are basically unconstrained. For illustration, we report two realizations of the model reproducing the Suzaku X-ray spectrum with two different values of , the Lorentz factor of the electrons emitting at the peak (, solid, and , long dashed). Clearly, the two cases mainly differ for the expected power output in the -ray band, the first being above and the second below the EGRET limit of sensitivity (around erg cm-2 s-1, e.g., Thompson et al. 1993). Only simultaneous -ray observations, providing a constraints on the position of the EC peak, can allow us to fix the value of . For comparison we report the predicted GLAST 5 sensitivity (long-dashed curve444http://www-glast.slac.stanford.edu/software/IS/glast_lat_performance.htm) calculated for 1 year all-sky survey.
The models for the case of intrinsic absorption are reported in Fig.(8). In this case the X-ray spectrum of the source is a power-law extending down to lower energy. To correctly reproduce this spectrum we decrease the bulk Lorentz factor with respect to the previous case (to ), so that the hard tail falls outside the region probed by the data. We compensated the lower degree of beaming with a larger electron density, with the effect to increase the relative importance of the SSC emission, which fills the region between the optical-UV and the soft X-ray band.
In both cases the Suzaku X-ray spectrum can be well fitted by assuming a standard slope for the low energy branch of the electron energy distribution. On the other hand, the extremely hard X-ray continuum measured by XMM-Newton requires a rather flat distribution (). Apart for the change of , the transition between the state of 2003 to that of 2006 can be reproduced with small changes in the other parameters, in particular a slightly larger value of the magnetic field.
5 Discussion
5.1 Absorption or intrinsic curvature?
Both the XMM-Newton and the Suzaku data of RBS 315 show a clear hardening of the X-ray spectrum below 1 keV, equally well fitted by a power-law model with absorption in excess to the Galactic value or by a broken-power law continuum with Galactic absorption. This feature, observed in several high- quasars, is commonly ascribed to the presence of absorbing material in the quasar environment (e.g., Elvis et al. 1994, Cappi et al. 1997, Reeves et al. 1997, Fiore et al. 1998, Fabian et al. 2001a,b, Bassett et al. 2004, Sambruna et al. 2007). A debated issue is the possible existence of a trend for the absorption to increase with redshift (Elvis et al. 1994, Cappi et al. 1997, Fiore et al. 1998, Page et al. 2005, Yuan et al. 2006). This would support scenarios (e.g. Silk & Rees 1998, Fabian et al. 1999) proposing that in the earliest phases of their evolution QSOs are substantially obscured by gas, subsequently expelled from the host galaxy by powerful winds.
The observational evidence, however, is still far from being completely clear. For instance, it seems that absorption is rather more common in radio-loud than in radio-quiet quasars (e.g. Page et al. 2005, Grupe et al. 2006), suggesting that absorption is linked to the presence of a relativistic jet. However, as pointed out by Page et al. (2005), if the correlation is real, the fact that radio-loud sources appear to be more absorbed could simply be due to a selection effect, since radio-loud quasars are brighter in X-rays and can be observed at larger distances. We note that a substantial number of the high radio loud quasars are in fact blazars, i.e. observed at small angle to the jet axis as is the case for RBS 315 and the very hard X-ray spectra indicate that their emission is dominated by the jet.
A potentially severe problem of the absorption interpretation is the apparent absence of strong extinction in the optical-UV band. Indeed, with the column densities inferred from the X-ray spectral fits, in some cases reaching values of cm-2 (Fabian et al. 2001a), the corresponding obscuration would be huge (), in contrast with the optical observations requiring rather small reddening. A solution to this discrepancy is to invoke an extreme gas to dust ratio in these sources, possibly due to the high-ionization state of the gas (as the warm absorber found in Seyfert galaxies). However, the evidence of the high-ionization state from the fits of the X-ray spectra is not conclusive, even with good quality data (e.g. Worsley et al. 2004a,b). In fact, due to the redshift, the most important features that can be used for the diagnostics move below 0.1 keV and cannot be observed.
The discussion above is based on the assumption that the hardening at low energies is due to (intrinsic) absorption in both radio-quiet and radio-loud sources. However in radio-loud sources, and in particular in blazars, the observed spectral shape could be naturally accounted for by the intrinsic curvature of the IC emission from the jet, as shown here for the case of RBS 315 (see also Fabian et al. 2001a; Sambruna et al. 2006a, 2007). Indeed, for parameters typically derived in reproducing the SED of powerful blazars, the model predicts a smooth hardening of the spectrum below a few keV (in the rest frame). To better illustrate this point, we show in Fig.(9) the comparison between the EC spectrum (solid line) and an absorbed power law spectrum (dashed) for an intrinsic column density cm-2 (calculated using the zwabs model of XSPEC), for a source located at (energies are in the observer frame). As already discussed, the EC spectrum present a break at a frequency approximately given by , where is the peak frequency of the external radiation field. To mimic an effective column density one has therefore to adjust the parameters to obtain the right value for the break frequency. For instance, the curve reported in Fig.(9) have been calculated assuming Hz and fixing the low-energy end of the electron distribution to . Therefore, is fixed only by the value of the bulk Lorentz factor. As can be seen, the shapes of the two kinds of spectra are substantially similar down to energies of 0.3-0.4 keV (but this energy is lower for sources at higher ). Below that energy, the EC curve stays systematically above the absorbed power-law, since it asymptotically reaches a spectrum (reproducing the slope of the underlying population of soft photons, assumed to follow a black-body shape), while the absorption imprints an exponential cut-off. However, with data covering a limited energy range the two models can give equally acceptable fits.
The hardening of the EC spectrum at low energies could be masked by the possible presence of the softer SSC component, which typically peaks between the UV and the soft X-ray band. However, from the observational point of view (e.g. Fossati et al. 1998) the relative importance of the SSC component seems to decrease with the power of the source (maybe due to an increasing importance of the accretion disk and then of the external radiation field: e.g., Celotti et al. 2007), leaving an almost “naked” EC component in the most powerful sources. In this case, the apparent effect of the absorption should be more important for the most powerful sources, accounting for the apparent trend of the with (since for high redshift we select the most powerful sources).
In conclusion, in radio-loud, blazar-like, quasars, the intrinsic curvature of the EC component is a viable alternative to explain the cut-off in the soft X-ray band. Clearly, more observational effort should be devoted to study this effect. The most direct observation able to discriminate between the two possible explanations would be the direct detection of features (i.e. absorption edges) directly imprinted on the X-ray continuum by the absorbing material. Spectra with sufficient signal can possibly be obtained with long exposures with the present instrumentation. In any case, this can be one of the goals of the next generation of X-ray instruments. Moreover, it is mandatory to investigate the detailed shape of soft the X-ray continuum expected by considering realistic spectra for the soft ambient photons scattered in the EC component (Tavecchio et al., in prep).
5.2 Flat X-ray continuum and variability
Besides the problems related to the cut-off at low energies, the quite hard X-ray spectrum of RBS 315 above 1 keV (similar to that of other powerful blazars) poses a great challenge to the scenarios currently accepted for particle acceleration (Ghisellini 1996, Sikora et al. 2002). Indeed, to correctly reproduce the X-ray continuum we have to assume (especially for the XMM-Newton observations). However, a slope for the electron energy distribution (implying a spectral index ) is predicted in scenarios considering either shock accelerated electrons or a population of cooled electrons. Particularly difficult to be reconciled with the standard models is the exceptionally hard slope measured by XMM-Newton in 2003. Note, moreover, that such hard spectra are not uncommon. For instance, in the sample of 16 radio-loud quasars at considered by Page et al. (2005), 4 have hard spectra with .
This evidence could suggest either that shocks can produce relativistic electrons with a distribution much harder than or that another mechanism energizes the electrons, at least those with Lorentz factors below (which typically emits through EC at energies below 100 keV). This possibility has been discussed by Sikora et al. (2002) which proposed a two-step acceleration process. In this scenario, electrons are initially accelerated from thermal energies to relativistic ones by a stochastic process (involving, for instance plasma instabilities/turbulence or following magnetic reconnection events), thought to provide electron distributions harder than . Only those particles with energies above a threshold can effectively be accelerated by the Fermi process at the shock front at energies at which they can emit -rays. However these speculations need to be assessed by improved theoretical analysis and calculations.
Another interesting point concerns the variability. Although extremely variable in the -rays, FSRQ show little variability in the X-ray band on small timescales (days). On longer timescales (months) variability is observed, but the variations are usually small, both in flux and slope (see, for instance, the comparison reported in Sambruna et al. 2007). Only in few cases extreme variability has been observed both on long (e.g., Pian et al. 2006) and short (e.g., Foschini et al. 2006b) timescales. RBS 315 changes the slope of the X-ray spectrum from to 1.5 between the two observations, separated by 3 years. An interesting point to note is that the spectrum seems to change “pivoting” around 1 keV (see Fig.7,8). Sources displaying a behaviour similar to RBS 315 are RX J1028.6-0844 (), for which two XMM-Newton observations separated by one year show a change of the photon index from to 1.5 (Yuan et al. 2005), and 0836+710, for which the hard X-ray spectrum (20-200 keV) softens from (as measured by BeppoSAX) to (BAT/SWIFT) (Sambruna et al. 2007).
5.3 Jet power and jet/disk connection
In Tab.4 we also report the radiative luminosity, , and the power carried by the jet, , calculated assuming the presence of 1 proton for each relativistic electron. This choice is dictated by the condition that the jet carries enough power to support the large radiative output of these sources (e.g. Maraschi & Tavecchio 2003). The derived values are around erg/s, quite large, but consistent with the values inferred for sources of similar radiative luminosity (e.g. Tavecchio et al. 2000). The ratio , indicating the radiative efficiency of the jet, spans the range 10-50, again, typical for this kind of sources (e.g. Sambruna et al. 2006b).
In the hypothesis that the disk substantially contributes to the optical-UV luminosity, one can derive the disk luminosity, erg/s. As already discussed for other powerful blazars, in the case of the standard value of for the accretion efficiency, this would imply that the jet carries away a power comparable to that carried inward by the accretion flow (Rawlings & Saunders 1991, Celotti et al. 1997, Maraschi & Tavecchio 2003). Finally we note that even if the black hole is accreting at the Eddington limit, the large luminosity requires an extreme value for its mass, .
6 Conclusions
The analysis of the Suzaku spectrum of RBS 315 confirms the finding of Page et al. (2005) and Piconcelli & Guainazzi (2005) made using XMM-Newton data on the presence of a cut-off in the soft-X-ray spectrum. This can be fitted equally well either using a power-law with absorption in excess of the Galactic value or a broken power-law with Galactic absorption.
The very hard spectrum measured by XMM-Newton (photon index ) poses a difficult challenge to the models usually considered for the acceleration of relativistic electrons. During the Suzaku observation, however, the slope was steeper, , closer to more “standard” values.
The SED, constructed with historical radio data, optical-UV data obtained with UVOT and the X-ray data, is consistent with those usually derived for other intermediate/high- powerful blazars, usually shining in the -ray band. It is thus likely that RBS 315 will be detected by the upcoming GLAST satellite.
Through the modeling of the SED with the standard synchrotron+IC emission model for blazars we derive parameters typical for powerful blazars. However, the lack of the -ray detection prevent a firm constraint of all the parameters.
We showed that the cut-off in the soft X-ray band, commonly ascribed to absorption by material in the quasar environment, can be also naturally reproduced by the hard tail of the IC component. Further studies are required to distinguish between the two alternatives.
References
- Bassett et al. (2004) Bassett, L. C., Brandt, W. N., Schneider, D. P., Vignali, C., Chartas, G., & Garmire, G. P. 2004, AJ, 128, 523
- Bentz et al. (2006) Bentz, M. C., Peterson, B. M., Pogge, R. W., Vestergaard, M., & Onken, C. A. 2006, ApJ, 644, 133
- Boldt (1987) Boldt, E. 1987, IAU Symp. 124: Observational Cosmology, 124, 611
- Cappi et al. (1997) Cappi, M., Matsuoka, M., Comastri, A., Brinkmann, W., Elvis, M., Palumbo, G. G. C., & Vignali, C. 1997, ApJ, 478, 492
- Celotti & Fabian (1993) Celotti, A., & Fabian, A. C. 1993, MNRAS, 264, 228
- Celotti et al. (2007) Celotti, A., Ghisellini, G., & Fabian, A. C. 2007, MNRAS, in press (astro-ph/0611439)
- Dermer & Schlickeiser (1993) Dermer, C. D., & Schlickeiser, R. 1993, ApJ, 416, 458
- Dickey & Lockman (1990) Dickey, J. M., & Lockman, F. J. 1990, ARA&A, 28, 215
- Elvis et al. (1994) Elvis, M., Fiore, F., Wilkes, B., McDowell, J., & Bechtold, J. 1994, ApJ, 422, 60
- Fabian et al. (2001) Fabian, A. C., Celotti, A., Iwasawa, K., McMahon, R. G., Carilli, C. L., Brandt, W. N., Ghisellini, G., & Hook, I. M. 2001a, MNRAS, 323, 373
- Fabian et al. (2001) Fabian, A. C., Celotti, A., Iwasawa, K., & Ghisellini, G. 2001b, MNRAS, 324, 628
- Fabian (1999) Fabian, A. C. 1999, MNRAS, 308, L39
- Fiore et al. (1998) Fiore, F., Elvis, M., Giommi, P., & Padovani, P. 1998, ApJ, 492, 79
- Foschini et al. (2007) Foschini, L., et al. 2007, ApJ, 657, L81
- Foschini et al. (2006) Foschini, L., et al. 2006a, A&A, 453, 829
- Foschini et al. (2006) Foschini, L., et al. 2006b, A&A, 450, 77
- Fossati et al. (1998) Fossati, G., Maraschi, L., Celotti, A., Comastri, A., & Ghisellini, G. 1998, MNRAS, 299, 433
- (18) Frontera, F. et al., 2007, Nature, submitted (astro-ph/0611228)
- Gehrels et al. (2004) Gehrels, N., et al. 2004, ApJ, 611, 1005
- Ghisellini et al. (1998) Ghisellini, G., Celotti, A., Fossati, G., Maraschi, L., & Comastri, A. 1998, MNRAS, 301, 451
- Ghisellini (1996) Ghisellini, G. 1996, IAU Symp. 175: Extragalactic Radio Sources, 175, 413
- Grupe et al. (2006) Grupe, D., Mathur, S., Wilkes, B., & Osmer, P. 2006, AJ, 131, 55
- Gruber et al. (1999) Gruber, D. E., Matteson, J. L., Peterson, L. E., & Jung, G. V. 1999, ApJ, 520, 124
- Kaspi et al. (2005) Kaspi, S., Maoz, D., Netzer, H., Peterson, B. M., Vestergaard, M., & Jannuzi, B. T. 2005, ApJ, 629, 61
- Kataoka et al. (2006) Kataoka, J., et al. 2007, PASJ, in press (astro-ph/0612754)
- (26) Koyama, K. et al. 2007, PASJ, 59, S23
- Maraschi & Tavecchio (2003) Maraschi, L., & Tavecchio, F. 2003, ApJ, 593, 667
- Maraschi et al. (1992) Maraschi, L., Ghisellini, G., & Celotti, A. 1992, ApJ, 397, L5
- (29) Mitsuda, K. et al. 2007, PASJ, 59, S1
- Page et al. (2005) Page, K. L., Reeves, J. N., O’Brien, P. T., & Turner, M. J. L. 2005, MNRAS, 364, 195
- Pian et al. (2006) Pian, E., et al. 2006, A&A, 449, L21
- Piconcelli & Guainazzi (2005) Piconcelli, E., & Guainazzi, M. 2005, A&A, 442, L53
- Rawlings & Saunders (1991) Rawlings, S., & Saunders, R. 1991, Nature, 349, 138
- Reeves et al. (1997) Reeves, J. N., Turner, M. J. L., Ohashi, T., & Kii, T. 1997, MNRAS, 292, 468
- Sambruna et al. (2006) Sambruna, R. M., et al. 2007, ApJ, in press
- Sambruna et al. (2006) Sambruna, R. M., et al. 2006a, ApJ, 646, 23
- Sambruna et al. (2006) Sambruna, R. M., Gliozzi, M., Tavecchio, F., Maraschi, L., & Foschini, L. 2006b, ApJ, 652, 146
- Sambruna et al. (1996) Sambruna, R. M., Maraschi, L., & Urry, C. M. 1996, ApJ, 463, 444
- Schlegel et al. (1998) Schlegel, D. J., Finkbeiner, D. P., & Davis, M. 1998, ApJ, 500, 525
- Schwope et al. (2000) Schwope, A., et al. 2000, Astronomische Nachrichten, 321, 1
- Sikora et al. (2002) Sikora, M., Błażejowski, M., Moderski, R., & Madejski, G. M. 2002, ApJ, 577, 78
- Sikora et al. (1994) Sikora, M., Begelman, M. C., & Rees, M. J. 1994, ApJ, 421, 153
- Silk & Rees (1998) Silk, J., & Rees, M. J. 1998, A&A, 331, L1
- (44) Takahashi, T. et al. 2007, PASJ, 59, S35
- Tavecchio et al. (2002) Tavecchio, F., et al. 2002, ApJ, 575, 137
- Tavecchio et al. (2000) Tavecchio, F., et al. 2000, ApJ, 543, 535
- Thompson et al. (1993) Thompson, D. J., et al. 1993, ApJS, 86, 629
- Worsley et al. (2004) Worsley, M. A., Fabian, A. C., Celotti, A., & Iwasawa, K. 2004a, MNRAS, 350, L67
- Worsley et al. (2004) Worsley, M. A., Fabian, A. C., Turner, A. K., Celotti, A., & Iwasawa, K. 2004b, MNRAS, 350, 207
- Yuan et al. (2006) Yuan, W., Fabian, A. C., Worsley, M. A., & McMahon, R. G. 2006, MNRAS, 368, 985
- Yuan et al. (2005) Yuan, W., Fabian, A. C., Celotti, A., McMahon, R. G., & Matsuoka, M. 2005, MNRAS, 358, 432
| XIS | |||||
|---|---|---|---|---|---|
| Model | |||||
| (1) | (2) | (3) | (4) | (5) | (6) |
| pl+GA | – | – | 1252.9/1061 | 8.5 | |
| pl+GA+zA | 2.65 | – | 1110.4/1060 | 8.4 | |
| bpl+GA | 0.68 | 1.42 | 1.23 | 1105.2/1059 | 8.4 |
| XIS+HXD/PIN | |||||||
|---|---|---|---|---|---|---|---|
| Model | |||||||
| (1) | (2) | (3) | (4) | (5) | (6) | (7) | (8) |
| pl+GA+zA | 2.7 | – | 1123.0/1073 | 8.3 | 25 | ||
| bpl+GA | 0.68 | 1.42 | 1.22 | 1118.1/1072 | 8.4 | 25 | |
| XMM-Newton | |||||
|---|---|---|---|---|---|
| Model | |||||
| (1) | (2) | (3) | (4) | (5) | (6) |
| pl+GA+zA | 1.65 | – | 1033.3/1068 | 15.7 | |
| bpl+GA | 0.26 | 1.21 | 1.07 | 1066.3/1067 | 15.7 |
| Model | |||||||||
|---|---|---|---|---|---|---|---|---|---|
| (G) | (cm-3) | ( erg/s) | ( erg/s) | ||||||
| 2003-C | 1 | 20 | 1.5 | 3.5 | 40 | 1.9 | 1.2 | ||
| 2006-C, high | 2.5 | 20 | 2 | 3.5 | 100 | 1.4 | 1.2 | ||
| 2006-C, low | 5.5 | 20 | 2 | 3.5 | 20 | 1.4 | 0.3 | ||
| 2003-A | 1.55 | 13 | 1.5 | 3.5 | 60 | 3.1 | 0.6 | ||
| 2006-A | 2.5 | 13 | 2 | 3.5 | 100 | 4.4 | 1.9 |