HD 98800: A 10-Myr-Old Transition Disk
Abstract
We present the mid-infrared spectrum, obtained with the Spitzer Infrared Spectrograph (IRS), of HD 98800, a quadruple star system located in the 10-Myr-old TW Hydrae association. It has a known mid-infrared excess that arises from a circumbinary disk around the B components of the system. The IRS spectrum confirms that the disk around HD 98800 B displays no excess emission below about 5.5 m, implying an optically thick disk wall at 5.9 AU and an inner, cleared-out region; however, some optically thin dust, consisting mainly of 3-m-sized silicate dust grains, orbits the binary in a ring between 1.5 and 2 AU. The peculiar structure and apparent lack of gas in the HD 98800 B disk suggests that this system is likely already at the debris disks stage, with a tidally truncated circumbinary disk of larger dust particles and an inner, second-generation dust ring, possibly held up by the resonances of a planet. The unusually large infrared excess can be explained by gravitational perturbations of the Aa+Ab pair puffing up the outer dust ring and causing frequent collisions among the larger particles.
Subject headings:
circumstellar matter — binaries: close — stars: individual (HD 98800) — planetary systems: formation — infrared: stars1. Introduction
During the last few years, particular interest has arisen for a certain stage in the evolution of circumstellar disks surrounding T Tauri stars: so-called transition disks, which are characterized by cleared-out or optically thin inner disk regions and a truncated optically thick outer disk. They are thought to be in a phase when the disk dissipates rapidly from inside out (e.g., Strom et al., 1989; Skrutskie et al., 1990), on a timescale of 105 years. A few disks in transition have been identified in the 1–2 Myr old Taurus star-forming region (Forrest et al., 2004; D’Alessio et al., 2005; Calvet et al., 2005); the different amount of material left over in the inner and outer disks of these transition objects implies different formation mechanisms or stages in disk evolution (Calvet et al., 2005). Planet formation, which is thought to occur in circumstellar disks around T Tauri stars, might play a role in the clearing of inner disks (Marsh & Mahoney, 1992; Calvet et al., 2002; Quillen et al., 2004; D’Alessio et al., 2005), but it is not well-known whether other mechanisms, such as photoevaporation, can produce these transition disks (e.g., Alexander, Clarke, & Pringle, 2006).
On the other hand, disks with inner gaps can also be found in stable, long-lived configurations: a binary star system surrounded by a circumbinary disk might create an inner gap due to resonant and tidal interactions (Artymowicz & Lubow, 1994), thus generating a spectral energy distribution (SED) typical of transition disks. For example, the T Tauri star St 34, which is a spectroscopic binary, has an inner disk depleted in dust, likely an effect of the gravitational perturbations of the binary on the inner disk regions (Hartmann et al., 2005). Since this system is likely older than 10 Myr, its disk configuration cannot be attributed to a short-lived transitional stage.
In the 25-member TW Hya association, which is 5–15 Myr old (Stauffer, Hartmann, & Barrado y Navascues, 1995; Webb et al., 1999; Weintraub, Kastner, & Bary, 2000), four objects are characterized by significant infrared excesses: TW Hya, Hen 3-600, HD 98800, and HR 4796A (e.g., Low et al., 2005). Except for HR 4796A, whose weaker IR excess clearly places it into the debris disk category, these stars are surrounded by substantial, probably protoplanetary, disks. Both TW Hya and Hen 3-600 display close to no disk emission below 7 m, an indication of truncated inner disks (Uchida et al., 2004). In particular, TW Hya has been suggested as the formation site of a protoplanet based on its inner disk gap (Calvet et al., 2002). Hen 3-600 consists of a spectroscopic binary (the A component) and a companion separated by 14 (e.g., Webb et al., 1999); the disk surrounds only Hen 3-600 A (Jayawardhana et al., 1999a), implying that the inner disk gap might be a result of gravitational perturbations as in the case of St 34.
In this paper we introduce the mid-infrared spectrum from 5 to 36 m of HD 98800 (TV Crt) obtained with the Infrared Spectrograph111The IRS was a collaborative venture between Cornell University and Ball Aerospace Corporation funded by NASA through the Jet Propulsion Laboratory and the Ames Research Center. (IRS; Houck et al., 2004) on board the Spitzer Space Telescope (Werner et al., 2004). HD 98800 is a quadruple system consisting of a visual binary with a projected separation of 08 (which corresponds to 38 AU at the distance of 47 pc determined by Hipparcos) whose components are spectroscopic binaries with separations of about 1 AU (Boden et al., 2005). Mid-infrared imaging revealed that the strong infrared excess of the system arises from component B only; in addition, it sets in at about 7 m, implying cleared-out inner disk regions (Gehrz et al., 1999; Koerner et al., 2000; Prato et al., 2001). Our mid-infrared spectrum confirms that the disk around HD 98800 is a transition disk and allows us to determine the location of the circumstellar dust, as well as to derive its mineralogical composition. This paper is structured as follows: in § 2 we present our observations and data reduction; in § 3 we construct the SED of HD 98800 B, and fit dust and disk models to it; and in § 4 we present a discussion of this transition disk and our conclusions.
2. Observations and Data Reduction
HD 98800 was observed during IRS campaigns 9 and 17 on 2004 June 25 and on 2005 January 03, respectively. The observations of campaign 17 repeated those of campaign 9, since the observations of the earlier campaign were somewhat compromised by a bright saturation event. However, the observations of campaign 17 were slightly mispointed; since we were able to mitigate the effects of the saturation on the array (apparent mostly in the form of additional rogue pixels), we used the IRS spectrum of campaign 9 for our analysis.
To obtain the full mid-IR spectrum, we used the Short-Low (SL; 5.2–14 m; /=60–120), Short-High (SH; 9.9–19.6 m; /=600), and Long-High (LH; 18.7–37.2 m; /=600) modules. For a clearer presentation of the IRS spectrum, we rebinned the SH and LH spectra to a resolution of 300, and we truncated the SH spectrum below 14 m. The observations were carried out in mapping mode, where we mapped the target in 3 steps separated by three-quarters (for SL) or half (for SH and LH) of the slit width in the dispersion direction and 2 steps separated by a third of a slit length in the spatial direction.
We extracted and calibrated our data with the SMART software tool (Higdon et al., 2004) after fixing bad pixels in the arrays using a simple interpolation over good, neighboring pixels in the spectral direction. In SH and LH, we also fixed all so-called “rogue” pixels identified in darks from campaigns 1 to 18 (for LH) or 1 to 28 (for SH). We subtracted the background of our SL spectrum by using the observation taken in the other nod position in the same order, then extracted the spectrum using a variable-width column extraction that scales with the width of the point-spread function. We were not able to subtract any background in our SH and LH spectra, which we extracted with a full-slit extraction. The SL spectrum was calibrated with Lac (A1 V), the SH and LH spectra with Dra (K2 III), using template spectra from Cohen et al. (2003). The final spectrum was obtained by averaging the spectra of the two central map positions. Given that the SL, SH, and LH spectra stitched together without applying any scale factors, the background contributions in SH and LH are likely negligible.
By comparing the 10 and 24 m emission derived from our IRS spectrum of HD 98800 with ground- and space-based measurements (Jayawardhana et al., 1999b; Low et al., 2005), we infer an absolute spectrophotometric accuracy of 5%. Our relative accuracy, determined by the scattering of neighboring flux values, is higher in SL than SH and LH: features above the noise level are very likely real in SL, while LH is still dominated by calibration artifacts.
3. Analysis
3.1. Spectral Energy Distribution
Previous observations of HD 98800 indicated that the infrared excess originates from a circumbinary disk around the component B spectroscopic binary. The SED is consistent with it being a transition disk, extending between a few and 10–20 AU (Koerner et al., 2000; Prato et al., 2001). Observations of the H line, which did not distinguish the emission from the four components, revealed a total H equivalent width of 0.9 Å and a width comparable to that of Pleiades K dwarfs, suggesting an origin in chromospheric activity and not in an accretion flow (Soderblom et al., 1996). An upper limit to the mass accretion rate has not been determined, but it is likely well below 10-11 yr-1 (Muzerolle et al., 2000); thus, accretion onto HD 98800 B has virtually come to a halt. The absence of accretion signatures (Soderblom et al., 1996; Webb et al., 1999) is in accordance with the lack of dust emission from the inner disk, i.e., the outer disk is prevented from accreting toward the star.

Our Spitzer IRS observations included emission of all four components of the system, since the narrowest IRS slit is 36 wide. Therefore, in the SED shown in Figure 1, we used unresolved optical to far-IR photometry of HD 98800 (see figure caption for details) and the IRS spectrum, all corrected for reddening using =0.44 (e.g., Soderblom et al., 1998) and Mathis’s reddening law (Mathis, 1990). Also shown is the photospheric emission of a K5 star (Soderblom et al., 1998; Prato et al., 2001), based on the photospheric colors of a star with this spectral type (Kenyon & Hartmann, 1995) and normalized at the unresolved 2MASS -band flux. Despite the fact that our IRS observation does not distinguish the emission from A and B, the SED suggests that none of the four components generates excess emission above the level expected from a stellar photosphere out to about 6 m. This supports the idea that the inner disk of HD 98800 has been cleared out.
In order to retrieve the true IRS spectrum of the B component, we estimated the contribution of the A component and subtracted it from the spectrum. Component A does not display an infrared excess and has an extinction (Koerner et al., 2000; Prato et al., 2001; Boden et al., 2005), while Ba+Bb seem to lie behind =0.44 (e.g., Soderblom et al., 1998). This difference in extinction likely indicates that we are observing HD 98800 B through some circumbinary dust, as first noted by Tokovinin (1999); this could also explain the slight photometric variability observed by Soderblom et al. (1998).

We estimated the mid-IR emission of HD 98800 A by using the photospheric colors of a K5 star (Kenyon & Hartmann, 1995) normalized at the -band flux of the A component given in Prato et al. (2001). This estimate is consistent with the measurements by Prato et al. (2001), who determined that the contribution of A to the system flux decreases with wavelength (50%, 44%, 30%, and 20% at 2.2, 4.8, 7.9 m, and 8.8 m, respectively, and less than 10% at longer wavelengths). The subtraction of the estimated emission of the A component from the IRS spectrum will affect both the flux level and shape of the spectrum particularly in the 5–8 m wavelength range; given that we do not account for atmospheric features, the resulting spectrum carries a higher uncertainty in this wavelength region.
The SED of HD 98800 B is shown in Figure 2; it was constructed with photometry of the B component compiled by Prato et al. (2001), MIPS fluxes from Low et al. (2005), IRAS fluxes, the IRS spectrum corrected for the contribution of A, and the photosphere of B (approximated using the colors of a K5 star normalized at the -band flux of B). The emission of B is photospheric out to about 5.5 m; beyond that, the infrared excess sets in rather sharply. The steep rise of the SED at 8 m is reminiscent of that observed in CoKu Tau/4, a transition disk in the Taurus star-forming region with an inner disk hole of 10 AU (Forrest et al., 2004; D’Alessio et al., 2005). The SED peaks at 20 m, then decreases as a single-temperature blackbody. The outer disk is likely truncated by component A, whose distance from B is almost 50 AU at closest approach (Torres et al. 1995; note that the orbit of B around A is very eccentric and seen almost edge-on). Thus, the disk around the spectroscopic binary HD 98800 B seems to be truncated both at the inner and at the outer disk edge.
3.2. Dust Composition
Koerner et al. (2000) inferred from narrow-band photometry in the 10-m region that the silicate emission feature of HD 98800 B is broader and more structured than expected from amorphous silicates, indicating the presence of crystalline silicates. The IRS spectrum allows us to analyze the 10-m silicate feature in greater detail and to derive the dust species that generate the infrared excess emission.
First, we subtracted the photospheric emission, constructed from the colors of a K5 star normalized at the -band flux, from the dereddened IRS spectrum of HD 98800 B. Next, given the large infrared excess and the presence of 10 and 18 m silicate emission features, we fit the residuals with two components, an optically thick region modeled as a blackbody, and a warmer, optically thin region of constant source function (also modeled as a blackbody):
| (1) |
where is the blackbody temperature of the optically thick region, is that of the optically thin region, is the wavelength-dependent optical depth of the optically thin cloud, and and are the solid angles of the emitting regions for the optically thick and thin components, respectively.
The optically thick component can be thought of as consisting of large (mm-sized) dust grains, which do not generate spectral features and whose opacities are independent of wavelength, thus creating a continuum component with a blackbody-type emission. Alternatively, a very large mass of small grains will generate blackbody-shaped, optically thick emission. Thus, the detailed composition of the dust only enters in the optically thin component.
| Model | Dust Species | ||||
|---|---|---|---|---|---|
| [K] | [K] | [10-13 sr] | |||
| a | 5 m amorphous pyroxene | 155 | 373 | 1.39 | 18.6 |
| b | small amorphous carbon | ||||
| + 5 m amorphous pyroxene | 151 | 291 | 1.47 | 12.1 | |
| c | small amorphous carbon | ||||
| + 3 m amorphous pyroxene | 153 | 298 | 1.43 | 11.4 | |
| d | small amorphous carbon | ||||
| + 3 m amorphous pyroxene | |||||
| + 3 m amorphous olivine | 152 | 310 | 1.45 | 8.0 |
For optically thin emission, the flux becomes linearly dependent on the optical depth, which can be expressed as the sum of the optical depth of each dust component , where and are the mass absorption coefficient and column density for each dust species, respectively. Since the mass of each dust species is derived via , where is the solid angle subtended by the dust and is the distance to the system (assumed to be 47 pc), the total optical depth of the optically thin component can be expressed as
| (2) |
where the sum is carried out over the number of dust components. Thus, the dust emission is calculated as
| (3) |
We solved the linear model for the best-fitting set of temperatures and , solid angle , and dust masses , starting with just one dust component and adding components as necessary to improve the fit.
For the optically thin dust species, we adopted amorphous carbon and silicates, which are typical for the interstellar medium. We used optical constants from Draine & Lee (1984) for 7.5 m and from Dorschner et al. (1995) for 7.5 m (using power laws to extrapolate values from 200 m to 2 mm) for amorphous silicates of olivine (MgFeSiO4) and pyroxene (Mg0.8Fe0.2SiO3) composition, and optical constants from Zubko et al. (1996) for amorphous carbon. For sub-micron grains, we used a CDE2 shape distribution (Fabian et al., 2001) to compute opacities, while larger grains ( 1 m) were adopted to be porous spheres with a 50% volume fraction of vacuum.
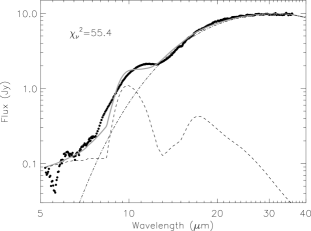
The first model attempts, using only sub-micron (i.e., ISM-like) olivine or pyroxene grains as the optically thin component, yielded poor fits (for an example, see Figure 3); the emission at the long-wavelength side of both the 10 and 18 m silicate feature is underestimated, suggesting the presence of larger grains. Amorphous pyroxene represents a better fit to the observed peak positions of the 10 and 18 m features than amorphous olivine, so it was assumed as the dominant large grain species.
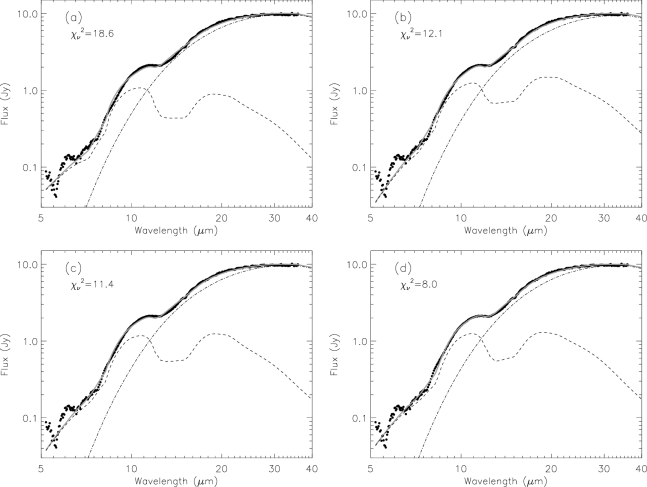
The best-fitting models, ordered by decreasing reduced values (), which were calculated from 6.5 m to 1.3 mm, are shown in Figure 4 with the residuals of HD 98800 B. The adopted model components and their parameters are displayed in Table 1. We note that most of the structure seen in the 5-6.5 m region of the residuals is likely due to photospheric features from the four stellar components of the system, which we did not account for in our photosphere subtraction process. Thus, we expect a mismatch between models and residuals in this part of the spectrum, and we did not include these data points in the computation of our values.
We first tried a model with an optically thick component at 155 K and a single optically thin component consisting of 5 m amorphous pyroxene (Fig. 4 a). This fit improved by adding sub-micron amorphous carbon to the dust mixture (Fig. 4 b); in particular, the short-wavelength excess starting at about 6.5 m is fit better. A slightly better fit of the silicate feature was achieved by using 3 m amorphous pyroxene and small amorphous carbon as the optically thin component (Fig. 4 c). Finally, the best fit was obtained by adding 3 m amorphous olivine to the previous mixture and adopting an optically thick component at 152 K (Fig. 4 d). For all of the models shown in Figure 4, the adopted solid angle lies in the (1.4-1.5) 10-13 sr range, and the temperature of the optically thin grains is higher than that of the optically thick component by about a factor of two (see Table 1). Even though the differences between these four models are small (especially if judged by eye), the best fit determined here for the optically thin disk region around HD 98800 B will be confirmed by our disk model in § 3.3.
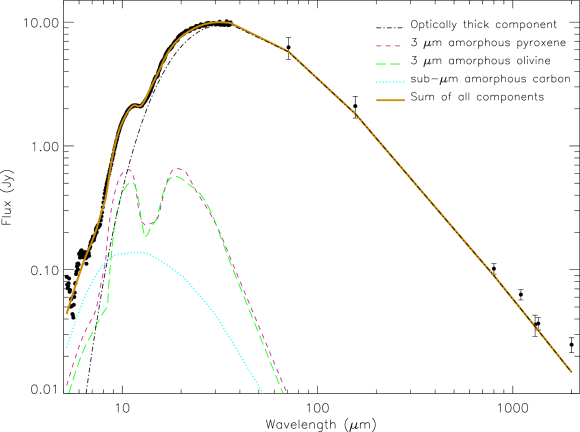
The best model fit and its components are shown in Figure 5 with the residuals of HD 98800 B over the mid-infrared to mm wavelength range. The model fits the entire excess emission from 6.5 m to 1.3 mm remarkably well. Table 2 lists the parameter values of this model together with their 1- uncertainties, which were estimated from models lying within of the best-fitting model. Since the optically thick component is more dominant and tightly constrained by all the measurements beyond about 14 m, the relative uncertainties for both and are smaller than for the parameters describing the optically thin component. We derive a combined mass for the optically thin dust grains of 4.7 10-4 lunar masses. The mass of the optically thick component cannot be constrained, but it is likely several orders of magnitude larger than the mass of the smaller grains.
| Parameter | Value |
|---|---|
| sr | |
| K | |
| K | |
| lunar masses | |
| lunar masses | |
| lunar masses |
Note. — The mass of the moon is equal to g.
The fact that dust grains larger than ISM-type amorphous grains (whose sizes are 1 m) constitute the bulk of the optically thin component indicates that dust growth must have occurred in the disk of HD 98800 B. The other two objects with substantial disks in the TW Hydrae association, TW Hya (K7 spectral type) and Hen 3-600 A (M3 spectral type), are dominated by smaller grains and are characterized, in particular in the case of Hen 3-600 A, by a notable fraction of crystalline grains (Sargent et al., 2006). Our dust model fit to HD 98800 B excludes any sizable amount of small crystalline silicates, suggesting that the larger width of the 10 m silicate feature already noted by Koerner et al. (2000) should likely be attributed to grain growth alone.
3.3. Disk Model
In order to derive the structure of the circumstellar material of HD 98800 B, in addition to its composition, we computed a model following the methods of D’Alessio et al. (2005) and Calvet et al. (2005). The stellar luminosity of the Ba+Bb pair was adopted to be 0.7 , a value obtained by integrating the photospheric fluxes of the unresolved B component, and the effective temperature was assumed to be 4350 K, typical for a K5 star (Kenyon & Hartmann, 1995). The model has two components: an optically thick wall and an optically thin region, corresponding to the blackbody component and the optically thin dust grains, respectively, from the dust component fit of § 3.2. Even though the model implicitly assumes the presence of gas in addition to the dust, no assumptions regarding the gas were made, since it does not enter any of the calculations.
The wall emission was calculated assuming amorphous carbon and silicate grains with sizes between 1 and 3 mm. Since the grains are so large, their opacities are gray (i.e., independent of wavelength), and thus their composition does not affect the fit; their emission corresponds to that of a scaled blackbody. Therefore, this wall matches the optically thick component of § 3.2. The composition of the optically thin component was adopted from § 3.2, namely sub-micron amorphous carbon, 3 m-sized amorphous olivine and 3 m-sized amorphous pyroxene grains. The small amorphous carbon grains, which absorb stellar radiation more efficiently than the larger grains, are necessary to heat the dust and yield enough emission in the 6-8 m range; the 3 m-sized grains generate emission that provides a good fit to the silicate features at 10 and 20 m.
| Model | Optically thin component | Optically thick component | |||||
|---|---|---|---|---|---|---|---|
| [AU] | [AU] | [K] | [K] | [AU] | [AU] | ||
| a | 2 | 5 | 0.04 | 266 | 175 | 5.9 | 0.56 |
| b | 2 | 4 | 0.04 | 266 | 193 | 5.9 | 0.68 |
| c | 2 | 2.2 | 0.22 | 267 | 255 | 5.9 | 0.75 |
| d | 1.5 | 2 | 0.06 | 307 | 266 | 5.9 | 0.75 |
Note. — is used a scaling factor for the emission of the optically thin component:
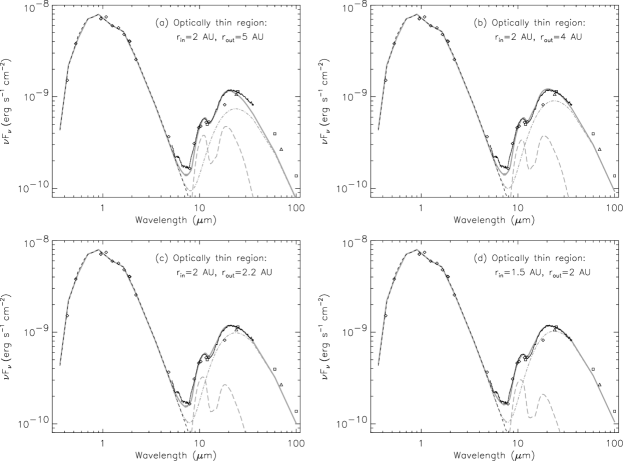
The results of the model calculations are shown in Figure 6 and in Table 3. We show different model fits which result from varying the contribution of the optically thin and thick components. As in the previous section, the properties of the inner disk wall are well-constrained by the flux measurements beyond about 14 m; in order to obtain the correct blackbody shape, it has to be placed at a distance of 5.9 AU from the B pair, where the temperature in its upper layers (closest to the star) amounts to 140 K. Not surprisingly, this temperature is very similar to the one derived in § 3.2 for the optically thick component. The height of the wall above the midplane is treated as a scale factor for the wall emission; it is adjusted such that the emission from the optically thick and thin components yields the best possible fit. For the best-fit model (Figure 6 d), this height is 0.75 AU. The solid angle subtended by the wall amounts to 1.57 10-13 sr (assuming a distance of 47 pc and an inclination angle of 67°, as determined by Boden et al. 2005), which is just somewhat larger than the value of 1.46 10-13 sr derived from the best-fitting dust model in § 3.2.
The optically thin component has to lie inside the region delimited by the optically thick wall in order to provide enough emission at wavelengths between 5 and 20 m; in addition, its innermost location and radial extent are fairly well constrained by the observed 10-20 m flux ratio. As can be seen in Figure 6 a, an optically thin region extending from 2 to 5 AU will underestimate both the short- and long-wavelength excess emission; decreasing the outer radius results in a better match of the flux beyond 20 m (Fig. 6 b). Concentrating the optically thin region close to 2 AU yields a very good fit (Fig. 6 c), while the best fit to the observations is obtained by an optically thin ring located between 1.5 and 2 AU (Fig. 6 d). The dust grains in this ring are at a temperature between 307 and 266 K, similar to the value found for the best-fitting dust model of § 3.2.
The wall radius of 5.9 AU we derive is comparable to the inner radius range of 5.0 2.5 AU determined by Koerner et al. (2000) from simple SED models; both values are larger than the estimate of 2 AU derived by Prato et al. (2001) from fits to their unresolved mid-infrared images. However, our result is consistent with the fact that Prato et al. (2001) did not resolve the disk: the optically thin region is very compact and close to the binary, and even though at 12 m the brightness of this region and that of the wall are comparable, the large inclination of the wall might have prevented its direct detection.

The optical depth of the optically thin component is displayed in Figure 7; it was computed using the best-fitting dust component model from § 3.2 and adopting a ring between 1.5 and 2 AU to determine , which amounts to 5.85 sr. Shown in the figure are the vertical optical depth (solid line) and the optical depth along the line of sight (dashed line), assuming an inclination angle of 67°. The latter quantity is actually an upper limit to the optical depth along our line of sight, since the thickness of the optically thin region is not known. Thus, since lies between 0.02 and at most 0.13 over the mid-infrared range and decreases steadily towards longer wavelengths, the inner disk region will appear as optically thin from infrared to millimeter wavelengths.
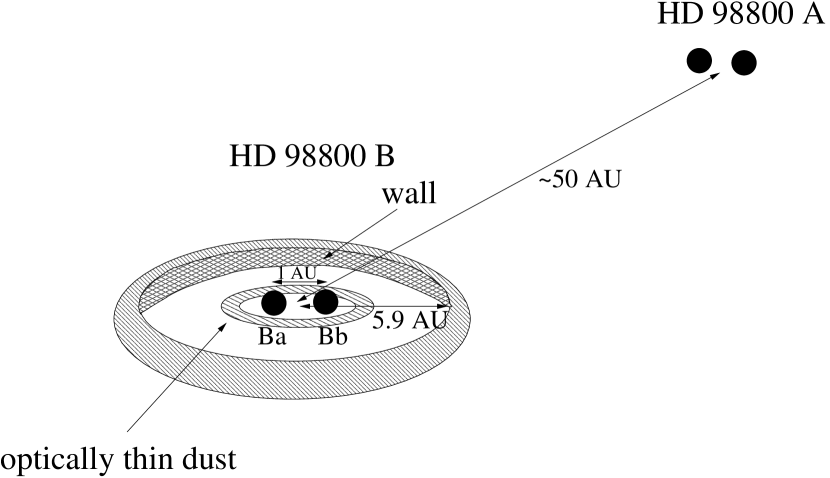
A sketch of the HD 98800 system is shown in Figure 8. There are two rings of material around the B component: an optically thick wall at 5.9 AU with a small radial extent, and an optically thin inner region between 1.5 and 2 AU, just outside the binary orbit. We will discuss the implications of this peculiar structure in the next section.
4. Discussion and Conclusions
The mid-infrared spectrum of HD 98800 B reveals that it is surrounded by a transition disk whose infrared excess emission starts at about 5.5 m and decreases beyond 20 m. Its structure is somewhat reminiscent of that of the transition disks TW Hya (Calvet et al., 2002) and GM Aur (Calvet et al., 2005), which also harbor optically thin regions inside an outer, optically thick disk. However, as opposed to the these two objects, HD 98800 is a multiple system: the Ba and Bb stars form a close ( 1 AU) eccentric (; Boden et al. 2005) binary system, and in addition the A pair comes as close as 50 AU to the B pair, with the orbital planes of the two binaries inclined by about 30° with respect to each other (Torres et al., 1995; Boden et al., 2005). Thus, gravitational perturbations likely play a role in the confinement and distribution of the dust around HD 98800 B.
A circumbinary disk around an eccentric binary is expected to be tidally truncated at the inner disk edge (Artymowicz & Lubow, 1994). If the eccentricity is large, several higher-order resonances play a role in truncating the circumbinary disk by exerting tidal torques further out in the disk; thus, gap sizes of 3.5 (where is the semimajor axis of the binary) can be explained (Artymowicz & Lubow, 1994). However, these gravitational interactions apply to a gaseous disk, and the amount of gas in HD 98800 appears to be very small: the 1- upper limit placed by Dent, Greaves, & Coulson (2005) on the sub-mm 12CO J=3-2 line indicates an upper limit of 4 10-4 Jupiter masses (which is less than 1/24 of the gas mass of TW Hya), assuming optically thin 12CO emission. Some warm gas could still be present in the inner disk regions, since the sub-mm 12CO line traces cold molecular gas in outer disk regions (where temperatures are below 100 K), but given the lack of accretion signatures (Soderblom et al., 1996; Webb et al., 1999), the amount of gas in the inner disk should be small.
In the absence of gas, the truncation of the outer disk at 5.9 AU could still be explained by the effect of resonances. Using the empirical formula determined by Holman & Wiegert (1999), who studied stable particle orbits around an eccentric binary, the smallest, stable orbit around HD 98800 B (which has a semimajor axis AU, eccentricity , and mass ratio 0.45; Boden et al. 2005) is at 4.06 AU, somewhat smaller than the result we obtained by fitting a disk model to the SED. However, Holman & Wiegert (1999) note that the transition between stable and unstable orbits is likely not sharp due to the effects of overlapping mean motion resonances. They also found indications that, over time, the stable region moves further out for high binary eccentricities.
While a tidally truncated disk at 4 AU could explain the location of the disk wall, it would not be able to account for the presence of optically thin dust grains at 1.5-2 AU. The most likely interpretation for the unusual structure of the circumstellar material of HD 98800 B, also considering the probable scarcity of gas, is that the disk is already at the debris disks stage, when dust is its main constituent and is generated by collisions of larger bodies. The dust would be second-generation dust and not primordial material that survived for 10 Myr. The sub-micron carbon and 3-m-sized silicate grains in the disk would be replenished in planetesimal collisions, which might occur in the optically thick ring at 6 AU. Due to Poynting-Robertson (PR) drag, the larger dust grains would spiral in from 6 AU towards the binary on a timescale of a few 105 years; since (Burns et al., 1979), where is the grain size, AU and , smaller grains would migrate even faster. Since HD 98800 is about 10 Myr old, the optically thin, inner ring must be continuously replenished, assuming it is a long-lived structure.
If the inner dust ring is explained by PR drag, then the absence of grains from 2 to 5.9 AU is puzzling; drag forces acting on dust grains should distribute the dust uniformly inside the radius at which the dust grains are created. A possible explanation for the observed gap could be a planet that formed just outside the unstable region, i.e., close to the inner disk wall, and that is temporarily holding up dust grains (that were able to drift inward) at one of its inner mean motion resonances (Liou & Zook, 1997; Moro-Martín, Wolf, & Malhorta, 2005). In the case of TW Hya, a planet was thought to be responsible for clearing out the inner disk (Calvet et al., 2002), so it is conceivable that a planet also formed in the roughly coeval HD 98800 system. On the other hand, this system is probably governed by complex dynamics due to the presence of four stellar components, implying overlapping resonances and variable gravitational perturbations.
Given that the evidence supports that the disk around HD 98800 B is rather a debris than a protoplanetary disk, the presence of an optically thick dust component and the large infrared excess (LIR/L17%) of HD 98800 B seem unusual, but they might be explained by the gravitational perturbations of the Aa+Ab pair. This type of perturbation can pump up eccentricities and inclinations of particles, and cause particles to be trapped in mean motion resonances, as was likely the case for Kuiper Belt objects under the influence of the giant planets and possibly a close encounter by a passing, nearby star (e.g., Duncan, Levison, & Budd, 1995; Ida, Larwood, & Burkert, 2000; Gladman, 2005). Periodic stirring of planetesimals in the outer disk around HD 98800 B by the A pair could be responsible for generating copious amounts of dust (see Kenyon & Bromley, 2002). HD 98800 B is thus a unique type of debris disk, whose infrared excess is elevated to levels comparable to that of protoplanetary disks due to the particular configuration of the four components in this system, resulting in gravitational perturbations that prevent the dust from settling into a flat disk.
Even though HD 98800 appears to be a very dynamical system, it is unlikely to be in a short-lived transitional stage with ongoing clearing processes, in which the outer disk is being progressively eroded. HD 98800 B belongs to a similar class of transition disks as St 34 and Hen 3-600 A: a tight binary is responsible for tidal and resonant interactions with the disk, thus creating a stable, tidally truncated circumbinary disk. In addition, collisions between planetesimals in the outer disk of HD 98800 B cause a collisional cascade of smaller grains, which then migrate towards the central binary. This outer disk is likely truncated due to the presence of the other component, as is the case with Hen 3-600 A (Jayawardhana et al., 1999a). However, St 34 and Hen 3-600 A are still accreting material, albeit at low levels (2.5 10-10 yr-1 for St 34, 5 10-11 yr-1 for Hen 3-600 A; White & Hillenbrand 2005; Muzerolle et al. 2000), while HD 98800 B is probably not accreting any more. Thus, St 34 and Hen 3-600 A are likely surrounded by evolved protoplanetary disks, while the disk around HD 98800 seems to have evolved even further. The similarities and differences between the HD 98800 and Hen 3-600 systems could increase our understanding of disk evolution; the larger separation between Hen 3-600 Aa+Ab and B and the fact that all three stars are of later spectral type might play a role in the longer survival of primordial disk material around this system.
The analysis presented in this paper suggests that transition disks comprise a
varied group of objects, where different processes are responsible for
creating a “transition disk” appearance, and where the timescales involved
can vary substantially. Increasing the sample of transition disks from various
star-forming environments and at different ages will shed light on the processes
sculpting the disks.
References
- Alexander, Clarke, & Pringle (2006) Alexander, R. D., Clarke, C. J., & Pringle, J. E. 2006, MNRAS, 369, 229
- Artymowicz & Lubow (1994) Artymowicz, P., & Lubow, S. H. 1994, ApJ, 421, 651
- Boden et al. (2005) Boden, A. F., Sargent, A. I., Akeson, R. L., Carpenter, J. M., Torres, G., Latham, D. W., Soderblom, D. R., Nelan, E. 2005, ApJ, 635, 442
- Burns et al. (1979) Burns, J. A., Lamy, P. L., & Soter, S. 1979, Icarus, 40, 1
- Calvet et al. (2002) Calvet, N., D’Alessio, P., Hartmann, L., Wilner, D., Walsh, A. ,& Sitko, M. 2002, ApJ, 568, 1008
- Calvet et al. (2005) Calvet, N., et al. 2005, ApJ, 630, L185
- Cohen et al. (2003) Cohen, M., Megeath, S. T., Hammersley, P. L., Martín-Luis, F., & Stauffer, J. 2003, AJ, 125, 2645
- D’Alessio et al. (2005) D’Alessio, P., et al. 2005, ApJ, 621, 461
- Dent, Greaves, & Coulson (2005) Dent, W. R. F., Greaves, J. S., & Coulson, I. M. 2005, MNRAS, 359, 663
- Dorschner et al. (1995) Dorschner, J., Begemann, B., Henning, Th., Jäger, C., & Mutschke, H. 1995, A&A, 300, 503
- Draine & Lee (1984) Draine, B. T., & Lee, H. M. 1984, ApJ, 285, 89
- Dullemond & Dominik (2005) Dullemond, C. P., & Dominik, C. 2005, A&A, 434, 971
- Duncan, Levison, & Budd (1995) Duncan, M. J., Levison, H. F., & Budd, S. M. 1995, AJ, 110, 3073
- Fabian et al. (2001) Fabian, D., Henning, Th., Jäger, C., Mutschke, H., Dorschner, J., & Wehrhan, O. 2001, A&A, 378, 228
- Forrest et al. (2004) Forrest, W. J., et al. 2004, ApJS, 154, 443
- Gehrz et al. (1999) Gehrz, R. D., Smith, N., Low, F. J., Krautter, J., Nollenberg, J. G., & Jones, T. J. 1999, ApJ, 512, L55
- Gladman (2005) Gladman, B. 2005, Science, 307, 71
- Hartmann et al. (2005) Hartmann, L., et al. 2005, ApJ, 628, L147
- Higdon et al. (2004) Higdon, S. J. U., et al. 2004, PASP, 116, 975
- Holman & Wiegert (1999) Holman, M. J., & Wiegert, P. A. 1999, AJ, 117, 621
- Houck et al. (2004) Houck, J. R., et al. 2004, ApJS, 154, 18
- Ida, Larwood, & Burkert (2000) Ida, S., Larwood, J., & Burkert, A. 2000, ApJ, 528, 351
- Jayawardhana et al. (1999a) Jayawardhana, R., Hartmann, L., Fazio, G., Fisher, R. S., Telesco, Ch. M., & Piña, R. K. 1999, ApJ, 520, L41
- Jayawardhana et al. (1999b) Jayawardhana, R., Hartmann, L., Fazio, G., Fisher, R. S., Telesco, Ch. M., & Piña, R. K. 1999, ApJ, 521, L129
- Kenyon & Bromley (2002) Kenyon, S. J., & Bromley, B. C. 2002, AJ, 123, 1757
- Kenyon & Hartmann (1995) Kenyon, S. J., & Hartmann, L. 1995, ApJS, 101, 117
- Koerner et al. (2000) Koerner, D. W., Jensen, E. L. N., Cruz, K. L., Guild, T. B., & Gultekin, K. 2000, ApJ, 533, L37
- Liou & Zook (1997) Liou, J.-C., & Zook, H. A. 1997, Icarus, 128, 354
- Low et al. (2005) Low, F. J., Smith, P. S., Werner, M., Chen, Ch., Krause, V., Jura, M., & Hines, D. C. 2005, ApJ, 631, 1170
- Marsh & Mahoney (1992) Marsh, K. A., & Mahoney, M. J. 1992, ApJ, 395, L115
- Mathis (1990) Mathis, J. S. 1990, ARA&A, 28, 37
- Moro-Martín, Wolf, & Malhorta (2005) Moro-Martín, A., Wolf, S., & Malhorta, R. 2005, ApJ, 621, 1079
- Muzerolle et al. (2000) Muzerolle, J., Calvet, N., Briceño, C., Hartmann, L., & Hillenbrand, L. 2000, ApJ, 535, L47
- Prato et al. (2001) Prato, L., Ghez, A., Piña, R. K., Telesco, C. M., Fisher, R. S., Wizinowich, P., Lai, O., Acton, D. S., & Stomski, P. 2001, ApJ, 549, 590
- Quillen et al. (2004) Quillen, A. C., Blackman, E. G., Frank, A., Varnière, P. 2004, ApJ, 612, L137
- Sargent et al. (2006) Sargent, B., et al. 2006, ApJ, 645, 395
- Skrutskie et al. (1990) Skrutskie, M. F., Dutkevitch, D., Strom, S. E., Edwards, S., & Strom, K. M. 1990, AJ, 99, 1187
- Soderblom et al. (1996) Soderblom, D. R., Henry, T. J., Shetrone, M. D., Jones, B. F., & Saar, S. H. 1996, ApJ, 460, 984
- Soderblom et al. (1998) Soderblom, D. R., et al. 1998, ApJ, 498, 385
- Stauffer, Hartmann, & Barrado y Navascues (1995) Stauffer, J. R., Hartmann, L. W., & Barrado y Navascues, D. 1995, ApJ, 454, 910
- Strom et al. (1989) Strom, K. M., Strom, S. E., Edwards, S., Cabrit, S., & Skrutskie, M. F. 1989, AJ, 97, 1451
- Sylvester, Dunkin, & Barlow (2001) Sylvester, R. J., Dunkin, S. K., & Barlow, M. J. 2001, MNRAS, 327, 133
- Tokovinin (1999) Tokovinin, A. A. 1999, Astron. Lett., 25, 669
- Torres et al. (1995) Torres, G., Stefanik, R. P., Latham, D. W., & Mazeh, T. 1995, ApJ, 452, 870
- Uchida et al. (2004) Uchida, et al. 2004, ApJS, 154, 439
- Webb et al. (1999) Webb, R. A., Zuckerman, B., Platais, I., Patience, J., White, R. J., Schwartz, M. J., & McCarthy, C. 1999, ApJ, 512, L63
- Weinberger et al. (2004) Weinberger, A. J., Becklin, E. E., Zuckerman, B., & Song, I. 2004, AJ,127, 2246
- Weintraub, Kastner, & Bary (2000) Weintraub, D. A., Kastner, J. H., & Bary, J. S. 2000, ApJ, 541, 767
- Wenrich & Christensen (1996) Wenrich, M. L., & Christensen, P. R. 1996, J. Geophys. Res., 101, 15921
- Werner et al. (2004) Werner, M. W. et al. 2004, ApJS, 154, 1
- White & Hillenbrand (2005) White, R. J., & Hillenbrand, L. A. 2005, ApJ, 621, L65
- Zubko et al. (1996) Zubko, V. G., Mennella, V., Colangeli, L., & Bussoletti, E. 1996, MNRAS, 282, 1321