Increase of the mean inner Coulomb potential in Au clusters induced by surface tension and its implication for electron scattering
Abstract
Electron holography in a transmission electron microscope was applied to measure the phase shift induced by Au clusters as a function of the cluster size. Large observed for small Au clusters cannot be described by the well-known equation (: interaction constant, : mean inner Coulomb potential (MIP) of bulk gold, : cluster thickness). The rapid increase of the Au MIP with decreasing cluster size derived from , can be explained by the compressive strain of surface atoms in the cluster.
pacs:
61.14.Nm, 81.07.Bc, 68.37.LpAu clusters are considered as prototype material for nano-scaled electronic devices and biosensors Andres et al. (1996). Moreover, Au clusters exhibit an exceptional catalytic activity Haruta (1997). All these potential applications have motivated numerous studies regarding the properties of Au nano-clusters. One fundamental material property is the mean inner Coulomb potential (MIP), which plays an important role for the quantitative evaluation of experimental data obtained from electron scattering techniques, e.g. transmission electron microscopy (TEM) and electron holography (EH). The MIP is the volume-averaged electrostatic part of the crystal potential, which can be expressed Bethe (1928); O Keeffe and Spence (1994) by
| (1) |
with Planck’s constant , the electron mass and charge and , the unit cell volume and the occupation number for the atomic species within the unit cell. The important property in Eq.(1) is the atomic scattering factor Doyle and Turner (1968) which correlates the MIP with the amplitude of the electron wave scattered in forward direction. The MIP can be determined by off-axis EH under kinematical diffraction conditions according to the relation (: interaction constant) by measuring the phase shift between the electron wave passing through the sample with a known thickness and a vacuum reference wave Reimer (1984). On the other hand, local TEM sample thicknesses can be determined by EH, if precise values of the MIP are known, but thus far only MIP values for few materials with limited accuracy are available Goswami and Lisgarten (1982); Spence (1993); Kruse et al. (2003); Gajdardziska-Josifovska and McCartney (1994); M. Schowalter et al. (2006). For instance, experimental values for the MIP of Au between 16.8 and 30.2 V were reported Goswami and Lisgarten (1982), whereas calculations yield values of 25.0 to 35.9 V Goswami and Lisgarten (1982); Gajdardziska-Josifovska and McCartney (1994); M. Schowalter et al. (2006). Moreover, a strong increase of the Au MIP up to 45 V was reported for Au clusters deposited on powder with decreasing cluster size Ichikawa et al. (2003). Recently, effective carbon MIP values up to 65 V were reported for ultra-thin amorphous carbon (a-C) films compared to a bulk value of 9 V M. Wanner et al. (2006). This indicates that the MIP increase for nano-scaled objects could be a general phenomenon. In this study, we applied EH to determine 1) the MIP of bulk Au, which corresponds to the MIP of Au atoms in the cluster core and 2) the contribution of surface atoms to the overall MIP of Au clusters to elucidate the physical origin of its increase.
Samples were prepared by low-energy-beam cluster deposition of clusters with 1020 atoms on commercial a-C substrates, 10 nm thick. Due to the storage of the sample, a coarsening of the particle sizes occurs, which leads to Au clusters with diameters D between 0.88.0 nm. Off-axis transmission EH was carried out in a 200 keV Philips CM200 FEG/ST electron microscope equipped with a Möllenstedt-Düker biprism in the selected-area aperture holder. Holograms with an interference fringe distance of (0.160.05) nm and a corresponding resolution =(0.320.10) nm were recorded using a 20482048 pixel CCD camera. The was reconstructed from the hologram sideband Lehmann and Lichte (2002) by using the DALI program package extended for hologram reconstruction Rosenauer et al. (1996). For our microscope a constant =7.2910 rad(Vm)-1 was determined according to Ref. Kruse et al. (2003).
Fig. 1a) shows the reconstructed phase shift for an Au cluster with D=6.9 nm. The total phase shift of the electron wave in the bright region of Fig. 1a) is given by the phase shift induced by the cluster and the supporting a-C film, whereas the gray background represents the phase shift due to the a-C film only. We use the following procedure to extract the integrated phase shift induced by the Au cluster : first, the integration of the phase shift along the y-direction of the integration domain (black frame in Fig. 1a)) was performed according to: (see Fig. 1b)). To eliminate the substrate contribution , the background is linearly interpolated (straight line in Fig. 1b)) on both sides of the cluster. Finally, is obtained by integration along the x-direction: . In Fig. 1c) of 123 Au clusters is plotted versus the radius of cluster projection .
To analyze the experimental we propose a new expression for the MIP of Au clusters which distinguishes between surface and core atoms. Generally, the atoms in a cluster are compressed due to surface tension. Previously observed compressive strain in metallic clusters (Au, Cu, Ni, Pt) was attributed to the sole contraction of the atoms at the cluster surface C.L. Cleveland et al. (1997); G. Apai et al. (1979); Moraveck et al. (1979); Kluth et al. (2004), which is essential for the explanation of the lattice vibrations in small particles Tamura et al. (1982). Considering that the strain is confined entirely to the cluster surface, surface atoms are under uniform compressive strain, whereas core atoms are unstrained. The strain leads to a decrease of the atomic volume for surface atoms to , where is the volume of unstrained core atoms, which is identical to the volume of bulk atoms. The inverse dependence of the MIP on the volume (, see Eq.(1)) requires accordingly the distinction between the surface and core atoms with different atomic volumes. The MIP of Au in Au clusters can then be expressed by
| (2) |
with the number of surface atoms and the total number of atoms within the cluster . is the MIP value of core atoms, which is equal to the MIP of the bulk material. As expected, approaches for bulk material, if and . However, large differences can be anticipated for nano-scaled objects, which are characterised by increased ratios and significant strain . A theoretical can then be calculated on the basis of Eq.(2) as
| (3) |
where is the cluster thickness at a given position within the area of the cluster projection on the (x,y) hologram (image) plane and denotes the geometrical cluster volume.
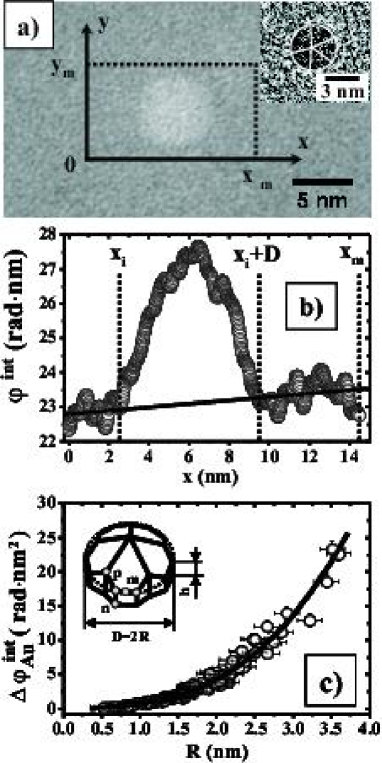
To interpret the measured using Eq.(3), the cluster shape and structure needs to be known. According to Fig. 1a) the area of the Au-cluster projection corresponds in a good approximation to disks with radii suggesting that the clusters could be spheres. To verify this assumption, high-resolution TEM (HRTEM) images of Au clusters with nm were recorded at normal illumination () and after tilting the samples by . The projected cluster area increases by about 5% in the tilted position, which excludes spherical clusters. Vertical facets are required with a ratio of the vertical facet height () with respect to the apparent radius of the cluster projection.
Calculations indicate that clusters with a pentagonal decahedral (Dh) structure variant called Marks-Dh (M-Dh) Marks (1984) and the face-centered-cubic (fcc) truncated octahedral (TO) clusters are energetically the most stable structures for clusters ( atoms) C.L. Cleveland et al. (1997); Wetten (1996); Cleveland (1997). A growth study of small Au particles (size 4-25 nm) produced by gas evaporation in flowing Ar has shown that, after condensation of the clusters on a substrate, the growth of Au particles with icosahedral (Ih) or Dh structures is favored with respect to fcc ones Renou and Gillet (1981). Accordingly, the Au clusters may have Ih or M-Dh structures. But except for the smallest Au clusters, it was shown that the Ih structures are energetically noncompetitive as compared with the M-Dh ones C.L. Cleveland et al. (1997); Cleveland and Landman (1991). We therefore assume the M-Dh morphology for Au clusters in our experimental size range. This assumption is confirmed by HRTEM images showing the typical fivefold symmetry (insert in Fig. 1a)). The M-Dh Au clusters are characterized by =0.4, derived from the tilt experiments, and an apparent diameter of =2 (see the insert in Fig. 1c)). The latter relation is assumed to be valid because the cluster projections are almost circular.
To evaluate Eqns.(2) and (3), and for Au clusters with our shape are required. For the theoretical estimation of these properties we distinguish between: a) ideal M-Dh Au clusters with closed-shell structures com and corresponding ideal radii and b) M-Dh Au clusters without closed-shell structures and intermediate radii . We calculate first and for the ideal clusters. The total number of Au atoms in ideal M-Dh clusters, i.e. the ”magic numbers”, can be described by the number of atoms , and C.L. Cleveland et al. (1997); Urban (1998) as shown in the insert in Fig. 1c). We use only =2 to approximate the observed circular cluster cross section. For a given , is calculated on the basis of the experimental ratio . Then, the difference of in clusters with (i+1) and (i) closed shells, , corresponds to the number of surface atoms of an ideal cluster with (i+1) shells.
The following considerations yield estimates for the strain and cluster radii which depend themselves on . Implying that is confined completely to the cluster surface, an ideal M-Dh Au cluster with (i+1) closed shells and radius is formed by a) an unstrained M-Dh cluster core with (i)-closed shells and radius consisting of core atoms and b) the (i+1)-closed shell, formed by surface atoms with radii . We assume that the unstrained M-Dh cluster core consists of unstrained core Au atoms with a diameter == nm, which is given by the minimum bond length between Au atoms in bulk gold. The strain is proportional to the reduction of the minimum bond lengths between surface and core atoms as compared to : . However, a more useful expression for is given by: . can be estimated by constructing unstrained M-Dh clusters with closed-shell structure using only geometrical considerations and Au atoms with . To estimate , we define the atom density of clusters as =/. For M-Dh Au clusters with our experimental shape, an analytical expression of can be derived. The lower boundary for (and the upper boundary for ) is calculated considering that cannot be larger than the atom density of bulk Au =58.9 atoms/nm3 by solving =. The upper boundary for (and the lower boundary for ) is given by =48.0 atoms/nm3 obtained for a cluster with two closed shells from ab initio density functional theory calculations, which yields . The atom density of large Au clusters with atoms is and the strain in these clusters converges towards the strain of surface atoms in bulk Au between -1 and -2% for low-index metal surfaces Jona and Marcus (1988). The strain () in ideal M-Dh Au clusters approximated by the average values on the basis of and is plotted in Fig. 2. The error bars represent strain values deduced from and . We note that differences associated with maximum and minimum strain are smaller than the spatial resolution in our experiment.
Values for and for M-Dh Au clusters without closed shell of surface atoms are obtained by interpolation between the properties of the ideal ones. The MIP value of core Au atoms, identical to the MIP of bulk Au, is then calculated by a least-square fit of the experimental and calculated phase shift on the basis of Eq.(3) with as the only free parameter (solid line in Fig. 1c)). We obtain = V, which agrees well with calculated MIP values of bulk Au Goswami and Lisgarten (1982); M. Schowalter et al. (2006) and reach, within the error bar, the upper limit of the previous experimental MIP data Goswami and Lisgarten (1982).
The experimental MIP values of Au in Au clusters are estimated from the measured by using (see Fig. 3). The solid line in Fig. 3 is calculated using Eq.(2) with = V, which is the fitted MIP of core Au atoms. Despite the scattering of for 1.5R2.2 nm, Eq.(2) describes adequately the behavior of the MIP. The description is particularly reasonable for small clusters with nm where =85 V is obtained. Data points exceeding the error limits indicated in Fig. 3 can be attributed to Au clusters with different ratios, the estimation of the background phase shift or a tilted position of the cluster on the a-C substrate. The errors associated with different possible cluster structures (M-Dh or Ih) on the resulting MIP are smaller than the error limits.

To explain the MIP increase in Au clusters and thin a-C films, only effects of changes of the electronic structure, permanent electrical charging or adsorbate molecules with a large electrical dipole have been considered up to now O Keeffe and Spence (1994); Ichikawa et al. (2003); M. Wanner et al. (2006). Ichikawa et al. Ichikawa et al. (2003) attributed the increase of the Au MIP to charge transfer from the Au clusters to the substrate. However, we exclude persistent charging of the clusters in our study, because the Au clusters are deposited on a-C substrate in electrical contact with the metallic sample holder. The presence of charged and neutral impurities has to be considered. The effect of neutral impurities is expected to be negligible due to the small amount of additional charge density. Charged impurities generate an electrostatic potential, which contributes to the measured phase shift. However, the consisting of our data set indicates that this is not a serious problem. We also add that deformations of atoms on twin planes in M-Dh clusters cannot be distinguished from compressed surface atoms, but this effect is estimated to be small compared to surface tension. Finally, effects of phonons and surface plasmons in clusters on the measured phase shift can be excluded due to the inelastic nature of the scattering process. In our case, the strong increase of the Au MIP in Au clusters can be well explained by the compressive strain of surface atoms. This effect is present but can not be measured in bulk samples, where / is negligible and is small. In contrast, surface contributions dominate and relaxations are important in small clusters.
In summary, we used EH to reconstruct the phase shift induced by small Au clusters. is determined by the MIP, which can be modeled by distinguishing between surface and core atoms with different atomic volumes. MIP values of 85 V are measured for Au clusters with nm, in contrast to the derived MIP value of Au core atoms of = V in good agreement with previous calculations for bulk Au. Significant compression of surface atoms (reduction of bond length) yields a high surface potential contribution to the MIP of clusters. An essential additional ingredient of the model, which is generally applicable, is the increasing ratio / in nano-scaled objects. The effect of the MIP increase in Au clusters and in many nano-scaled objects has important consequences for the quantification of electron scattering data in general because the amplitude of the electron wave scattered in forward direction can be much higher than expected from atomic scattering factors given e.g. in Doyle and Turner (1968). Modified scattering factors should be considered for the evaluation of images and diffraction patterns of nano-scaled objects from techniques based on electron scattering.
Acknowledgements.
We thank M.M. Kappes (Institut für Physikalische Chemie, Universität Karlsruhe) and H.L. Meyerheim (Max-Planck Institut für Mikrostrukturphysik, Halle) for fruitful discussions. This work has been performed within the project C4 of the DFG Research Center for Functional Nanostructures (CFN). It has been further supported by a grant from the Ministry of Science, Research and the Arts of Baden-Württemberg (Az: 7713.14-300).References
- Andres et al. (1996) R. Andres, T. Bein, and M. Dorogi, Science 272, 1323 (1996).
- Haruta (1997) M. Haruta, Catal. Today 36, 153 (1997).
- Bethe (1928) H. Bethe, Ann. Phys. (Leipzip) 87, 55 (1928).
- O Keeffe and Spence (1994) M. O Keeffe and J. Spence, Acta Cryst. A 50, 33 (1994).
- Doyle and Turner (1968) P. Doyle and P. Turner, Acta Cryst. A 24, 390 (1968).
- Reimer (1984) L. Reimer, Transmission Electron Microscopy (Springer Verlag, Berlin, 1984).
- M. Schowalter et al. (2006) M. Schowalter et al., Appl. Phys. Lett. 88, 232108 (2006).
- Goswami and Lisgarten (1982) A. Goswami and N. Lisgarten, J. Phys. C 15, 4217 (1982).
- Spence (1993) J. Spence, Acta Cryst. A 49, 231 (1993).
- Kruse et al. (2003) P. Kruse, A. Rosenauer, and D. Gerthsen, Ultramicroscopy 96, 11 (2003).
- Gajdardziska-Josifovska and McCartney (1994) M. Gajdardziska-Josifovska and M. R. McCartney, Ultramicroscopy 53, 291 (1994).
- Ichikawa et al. (2003) S. Ichikawa, T. Akita, and M. Okumura, JEOL News 38, 6 (2003).
- M. Wanner et al. (2006) M. Wanner et al., Ultramicroscopy 106, 341 (2006).
- Lehmann and Lichte (2002) M. Lehmann and H. Lichte, Microsc. and Microanal. 8, 447 (2002).
- Rosenauer et al. (1996) A. Rosenauer, S.Kaiser, and T. Reisinger, Optik 102, 63 (1996).
- C.L. Cleveland et al. (1997) C.L. Cleveland et al., Phys. Rev. Lett 79, 1873 (1997).
- G. Apai et al. (1979) G. Apai et al., Phys. Rev. Lett. 43, 165 (1979).
- Moraveck et al. (1979) B. Moraveck, G. Clugnet, and J. Renoupez, Surf. Sci. 81, L631 (1979).
- Kluth et al. (2004) P. Kluth, B. Johannessen, and V. Giraud, Appl. Phys. Lett. 85, 3561 (2004).
- Tamura et al. (1982) A. Tamura, K. Higet, and T. Ichinokawa, J. Phys. C 15, 4975 (1982).
- Marks (1984) L. Marks, Philos. Mag. 49, 81 (1984).
- Wetten (1996) R. Wetten, Adv. Matter. 5, 428 (1996).
- Cleveland (1997) C. Cleveland, Z. Phys. D 40, 503 (1997).
- Renou and Gillet (1981) A. Renou and M. Gillet, Surf. Sci. 106, 27 (1981).
- Cleveland and Landman (1991) C. Cleveland and U. Landman, J. Chem. Phys. 94, 7376 (1991).
- (26) Closed-shell cluster structures denote clusters with closed atomic shells which consist of a defined numbers of atoms - magic numbers - determined only by the geometric arrangement. Every additional closed shell represents a new layer of atoms which covers the whole cluster surface.
- Urban (1998) J. Urban, Cryst. Res. Technol. 33, 1009 (1998).
- Jona and Marcus (1988) F. Jona and P. Marcus, Surface Structures from LEED in: The Structure of Surfaces II (Springer Series in Surf. Sci., Vol. 11, Springer, Berlin, 1988).