Discrepancies in Determinations of the Ginzburg-Landau Parameter
Abstract
Long-standing discrepancies within determinations of the Ginzburg-Landau parameter from supercritical field measurements on superconducting microspheres are reexamined. The discrepancy in tin is shown to result from differing methods of analyses, whereas the discrepancy in indium is a consequence of significantly differing experimental results. The reanalyses however confirms the lower determinations to within experimental uncertainties.
pacs:
I I. INTRODUCTION
The Ginzburg-Landau parameter of a superconductor, , is generally defined as the ratio of its magnetic penetration depth () to its coherence length () at the thermodynamical critical temperature (). The parameter relates the two fundamental length scales of the material’s superconducting phase, distinguishes whether the phase transition is first- or second-order, and characterizes the material’s response to applied magnetic fields in the superconducting state. Theoretically, for clean materials, it is given by the BCS = 0.96 (0)/ where (0) is the London penetration depth at zero temperature and is the Pippard coherence length Tinkham (1975); P.G. de Gennes (1966).
The parameter, although often referred to, is infrequently measured and little tabulated owing to its dependence on sample purity and structure. Where measured, has been determined P.G. de Gennes (1966) from independent measurements of and the thermodynamic critical field , as well as from magnetization measurements on thin films and foils of various materials Chang and Serin (1966); Miller and Cody (1968). For type-I materials ( 1/), another technique has been from measurements of the supercritical fields of microspheres. This technique has been used in determining the of aluminum Smith et al. (1970); de la Cruz et al. (1969), cadmium de la Cruz et al. (1971), gallium Feder et al. (1966), mercury Smith et al. (1970); Smith et al (1968); Burger et al. (1994), indium Smith et al. (1970); Feder and McLachlan (1968); Feder et al. (1994); Smith et al (1968), lead Smith et al. (1970); Smith et al (1968), tin Smith et al. (1970); Feder and McLachlan (1968); Larrea et al (1968); Smith et al (1967, 1967), thallium Smith et al. (1970) and zinc de la Cruz et al. (1969), as well as a series of alloys Smith et al. (1970). Inexplicably, the results are generally factor 2 smaller than the thin film/foil determinations as well as the BCS-defined , as shown in Table I. More recent measurements, using a fast pulse induction technique with thin foils, provide results in better agreement with those from the microspheres Valko et al. (1994).
| lead | thallium | tin | indium | cadmium | aluminum | |
| 0.25 | 0.076 | 0.086 | 0.066 | 0.012 | 0.013 | |
| 0.34 | - | 0.15 | 0.13 | - | - | |
| 0.43 | 0.12 | 0.16 | 0.12 | 0.003 | 0.014 |
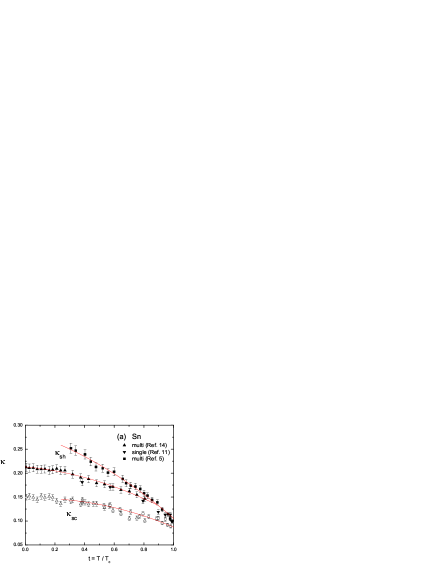
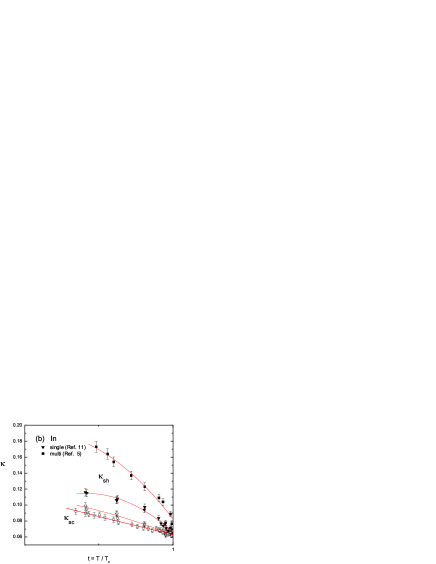
The discrepancy is further complicated by severe disagreements between the microsphere reports themselves. This is shown in Fig. 1 for tin and indium ( 0.1), two of the materials most studied with this technique, where the closed (open) symbols of each figure refer to the effective () from the Refs. indicated, defined by
| (1) |
where = / is the reduced superheating field, = is the reduced supercooling field, = 1.695, and = / is the reduced temperature. Although there is no complete theoretical description of the temperature behavior of the supercritical fields which spans the entire phase space, the parameters in principle converge to provided the microspheres are sufficiently large to prevent size effects which arise when becomes comparable to the dimensions of the sample.
Whereas the respective are seen in generally good agreement, the differ significantly, amounting to as much as 30 G in either material. The manifests the parabolic behavior of h; the near-linear behavior of the , at least above t 0.4, is consistent with magnetization measurements Chang and Serin (1966); Auer and Ullmaier (1973), with the different curvatures reflecting the difference in dynamics between the flux penetration and expulsion processes.
Eq. (1) implies the possibility that the higher of Ref. Smith et al. (1970) were obtained with microspheres which failed to achieve a full metastability, ie. which manifested lower superheating fields. This could result from the presence of material defects which effectively lower the transition field. The apparent convergence of the different , and the , , at = 1 despite significant differences at 1, might then be the result of the temperature dependences of both and , which diverge as 1. The higher of Ref. Smith et al. (1970) might also arise from diamagnetic interactions between the microspheres employed in the suspensions, absent in the single sphere measurements of Ref. Feder and McLachlan (1968), which would raise the local fields so that the transitions appear at the lower (applied) fields. Curiously however, the more recent suspension results Larrea et al (1968) are in agreement with those of the single sphere.
Nevertheless, it would appear that the discrepancy has been attributed to such extrinsic effects, and thusly disregarded: the determinations of have customarily proceeded by ignoring the to extract from the as 1 on the basis of Eq. (1) alone, even though defects and diamagnetic interactions would also have impact on the measurements.
Although in evidence some thirty years ago, these discrepancies have never been addressed in the literature insofar as we are aware. They cast doubt on the determinations of in Ref. Smith et al. (1970), hence also on the results of Refs. de la Cruz et al. (1969, 1971); Smith et al (1968, 1968, 1967, 1967) many of which are the only measurements existing for the given material. They furthermore prevent the straightforward use of such measurements in elaborating the behavior of for 1, the precise temperature-dependence of which remains a question of some theoretical interest Landau and Ott (2003).
We here reexamine the analyses of the data, and clarify at least a part of the problem. The data base and its reanalyses are described in Sec. 2, with the results presented in Sec. 3. These are discussed in Sec. 4, and conclusions presented in Sec. 5. Generally, we find the discrepancy in tin to result from differing methods of analyses, whereas the discrepancy in indium is a consequence of significantly differing experimental results. Combination with the results from in each case yields results for differing only slightly from their previously-reported values, but with somewhat larger uncertainties. Although we find no simple explanation for the almost factor two difference between determinations of this technique and those of the thin films/foils, we observe that the latter are also obtained from = and that the difference with the microsphere results is nearer a factor 1.7, suggesting a possible mis-identification of as in the previous analyses.
II II. DATA BASE
The results by Feder and McLachlan (FM) for tin are obtained from supercritical field measurements on single spheres of diameters 8, 21 and 48 m, over the temperature range 0.4 1 Feder and McLachlan (1968). Both the 8 and 48 m spheres exhibit strong size and defect effects, and were not considered. The FM report on indium is from measurements on single spheres of 8, 16 and 35 m diameters, and a powder of 10-50 m spheres in volume concentration of 17%; we omit all but the 35 m measurements as a result of observed size and defect effects. The more recent tin results of Larrea et. al. Larrea et al (1968), from suspensions of microspheres of diameter 33-40 m at a volume filling factor of 25%, are in general agreement with those of FM over 0.005 0.81. The errors in Fig. 1 represent 4% uncertainties, and are for reader convenience only: Larrea et. al. report errors of roughly this level, and the reports of SBC and FM are assumed comparable since no estimate is provided. There is also a report by Feder, Kiser and Rothwarf Feder et al. (1994) with suspensions of 1-5 m tin spheres, which we however neglect since the estimated diameter above which size effects are unimportant is 7.5 (T), or 5 m at 0.95 Feder and McLachlan (1968).
Smith, Baratoff and Cardona (SBC) reported results for tin from measurements on suspensions of 5-15 m diameter spheres suspended to a volume filling factor of 5% over 0.3 1, and for indium from measurements on 1-10 m microspheres with a filling factor of 5% over the same temperature range Smith et al. (1970).
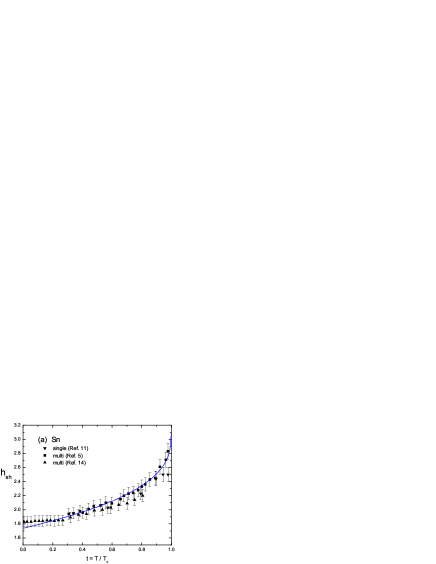
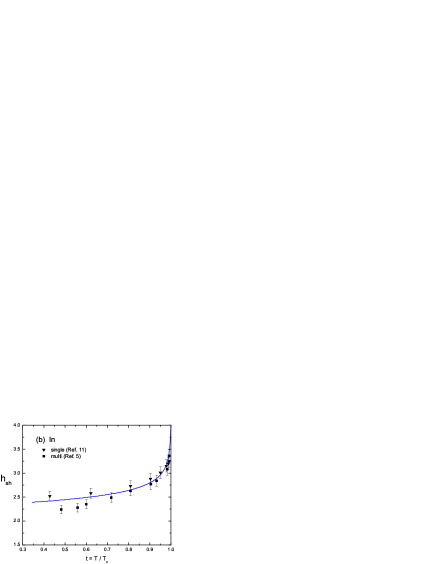
None of the previous reportings provide the actual supercritical field measurements. For spheres, the of Eq. (1) measured is actually , the critical field for surface nucleation of the superconductive state, which is favored over the bulk nucleation field Tinkham (1975); P.G. de Gennes (1966). Moreover, the local superheating field at the sphere equator is a demagnetization-enhanced 3/2 larger than the laboratory field Tinkham (1975); P.G. de Gennes (1966). For FM, Larrea et. al., and of SBC, the supercritical fields were regenerated from the reported , using:
| (2) |
where the prefactor in includes the sphere demagnetization. The factor (=1) = 1.695 is valid only for 1, and in principle increases with decreasing temperature. A variational lower bound (=0) = 1.925, has been obtained from a microscopic analyses of a pure superconductor assuming specular surface reflection Ebneth and Tewordt (1965), but has not been used in the analyses since Refs. Smith et al. (1970); Feder and McLachlan (1968); Larrea et al (1968) used only (1).
While the were obtained from Eq. (2), the SBC were obtained from a numerical integration of the Ginzburg-Landau equations following Ginzburg Ginzburg (1958) with correction for the demagnetization of the sphere. To retrieve the of SBC, we best fit the upper curve of SBC Fig. 1 over the interest range with a 7th order polynomial, and applied the inverse transformation to the full of SBC Fig. 8. This reproduces the results of SBC Fig. 8 to within 3% over the 0.8 1 as indicated in Fig. 2.
III III. RESULTS
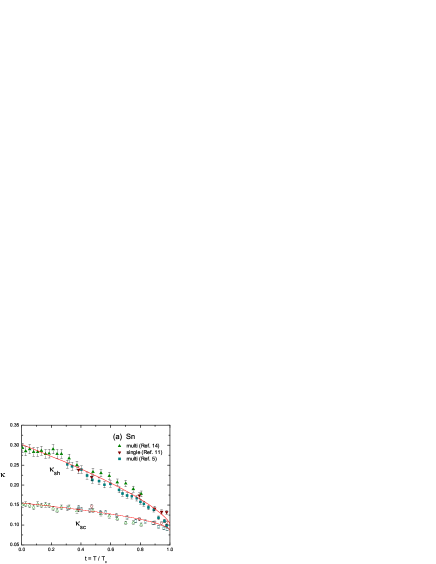
For tin, the of all groups, shown in Fig. 2(a), are in reasonable agreement, although the Larrea et. al. results appear flat below = 0.2 and there is a general tendency for the SBC results to be higher in the midrange temperatures. The rapid drop in below = 1 is consistent with nonlocal electrodynamics, the line indicating the predicted behavior in the extreme nonlocal limit Thompson and Baratoff (1968); Smith et al. (1970),
| (3) |
where = 1.35 (1.42) for diffusive (specular reflective) phonon surface scattering, and 1. Eq. (3) is in principle valid for 1 1- , or about 20% of the available temperature range.
The discrepancy between the SBC and FM/Larrea et. al. results for tin appears to arise solely from the different analyses techniques. This seems not the case for indium, as seen in Fig. 2(b). In this case, the SBC fields do not appear to agree with those of FM, and are generally lower by 2 . The disagreement increases with decreasing temperature: for 0.5, it amounts to 55 G. For the same , the two analyses lead to a difference in of order 20% for = 2.0 as shown in Fig. 3, in agreement with the 16% stated in Refs. 5 and 11; the difference increases with decreasing , i.e. as 1.
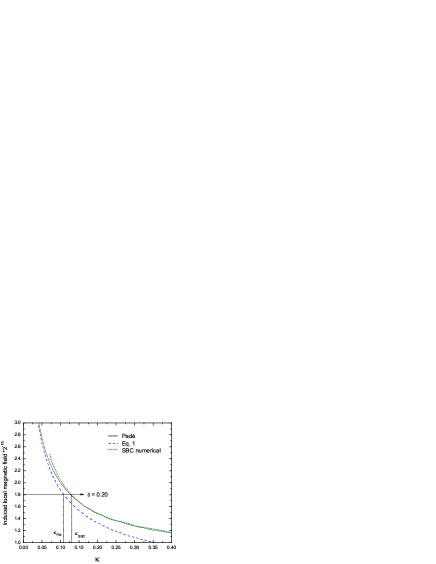
The FM/Larrea et. al. analyses is the more customary, but that of SBC would appear to be the more correct. FM have however argued Feder and McLachlan (1968) that the numerical method employed by SBC, which allows for only one-dimensional fluctuations of the order parameter, is too large for 0.1; the SBC results therefore represent only an upper limit. Permitting more than one degree of freedom in the perturbation generally results in lower instability fields. On the other hand, Eq. (1) represents only the first term in a general expansion of . Dolgert et. al. Dolgert, Bartolo and Dorsey (1996) have reexamined the relation using the method of matched asymptotic expansion, generating an expression for through 5th order. The stability of the results was analyzed with respect to both one- and two-dimensional perturbations, and the latter shown not to lead to any additional destabilizing effects in the low- limit. For present purposes, it is sufficient to reanalyze the various with the Padé [2,2] approximant Dolgert, Bartolo and Dorsey (1996), also shown in Fig. 3 and given by
| (4) |
This agrees to within 1% with more recent numerical calculations for 1, which appear to differ only slightly from the SBC curve above 0.15. As evident in Fig. 3, neither of the previous analyses appears in particularly good agreement with Padé in the region 0.08.
Fig. 4(a) summarizes the combined results in tin using Eq. (4), together with the respective determinations from Eq. (2). Here, 4% uncertainties are again shown except where measurements overlap, in which case the standard mean and deviation are given. The of Refs. Feder and McLachlan (1968) and Larrea et al (1968) are raised, and coincide with those of Ref. Smith et al. (1970). In particular, both and are seen not to converge well at = 1.
The results of a least squares fitting are given in Table II, together with the reported results of SBC and FM. The errors in this work are fitting errors only, using = m1+m2(1-)ρ . As indicated, the , converge at = 1 to within 3, yielding (Sn) = 0.094 0.006. Although the difference with the previously-quoted results appears insignificant, it occurs at the level of 4.
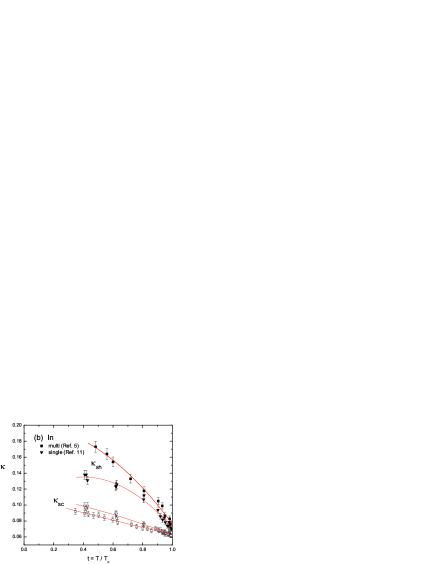
The similar reanalyses of for indium using Eq. (4) shows a continuing discrepancy below 0.9. Although the SBC is little affected in the reanalyses, those of FM are significantly increased above their Fig. 1 values. The implied larger superheating fields of the FM determinations suggest that the SBC suspension was in a mixed state and not fully superheated. Nonetheless, both converge towards at = 1, as seen in Fig. 4(b), with (In) = 0.064 0.008 resulting from a (1-)ρ fit. This is shown in Table II in comparison with the results of SBC and FM. The difference with previous determinations is well within error owing to the fitting uncertainty. The analyses is however strongly dependent on the data near = 1, with the larger uncertainty in the indium result reflecting both the lack of data below 0.4 and measurement differences between the samples.
| tin | indium | |
|---|---|---|
| SBC | 0.087 0.002 | 0.060 0.002 |
| FM | 0.093 0.001 | 0.062 0.001 |
| this work (combined) | 0.094 0.006 | 0.064 0.008 |
IV IV. Discussion
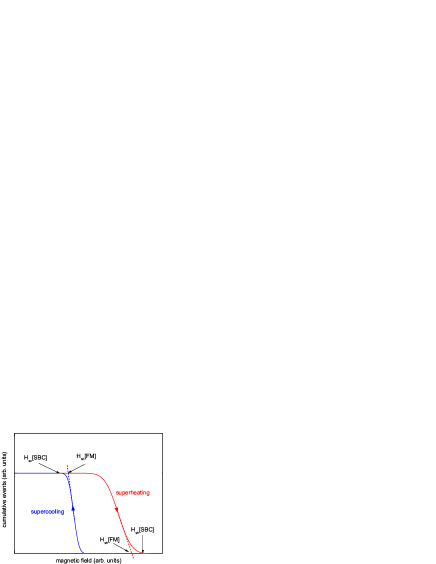
The supercritical fields determinations of all reports are obtained from hysteresis curves of the first order tin and indium transitions. Different reports have however assumed different definitions of the critical fields within the hysteresis curves, as shown schematically in Fig. 5. As evident, these definitions alone can lead to an appreciable variation in the reported . In general, the , parameters of FM should be consistently higher than SBC, which is not observed in the case of FM .
In the case of single grain measurements, variations in the supercritical fields arise mainly from the grain metallurgy. FM performed careful investigations of defects as part of their study. The hysteresis curves were measured as a function of the orientation of the spheres in the applied field, and the , taken from the direction yielding the lowest values (i.e. highest , lowest ). The results are strongly dependent on . In principle, for , the coherence length is sufficiently large that these effects are negligible; at lower temperatures, the coherence length is smaller than the defect and the effects are more noticeable. For this reason, FM also employed (/)2/3 as a comparison for , which has the advantage of being insensitive to since it is independent of .
In the case of the suspension measurements, the deformation of the hysteresis from the rectangular single sphere cycle is due largely to the interplay between defects and diamagnetic interactions between the spheres Hueber,Valette and Waysand (1979). At lower temperatures, defects in the sphere metallurgy may significantly reduce the superheating capacity of the material, resulting in a lowered transition field such as observed in the indium data of SBC. However, the defects should also serve as nucleation centers for ”early” normal (N) superconducting (S) transitions at lower temperatures, which is not observed. On the other hand, the advantage of the multisphere measurement lies in the averaging over the defect contribution - the last sphere to transition to the normal state is the most defect-free sphere of the suspension.
The recent work of Peñaranda et. al. Penaranda, Auguet and Ramirez-Piscina (1999) has demonstrated significant diamagnetic interactions even for filling factors as small as 5%. These may vary from one suspension to another of the same material as a result of inhomogeneous distributions. Although the last sphere to transition in the S N case is effectively free of diamagnetic interactions, this is not true for the N S where diamagnetic interactions are a maximum. As the field decrease continues, the new N S transitions enhance the local diamagnetic contribution to the local fields of those spheres still normal. This would suggest that the determinations with suspensions are lower than actual by some amount proportional to the diamagnetic interactions, since the local field is higher. As seen in Fig. 1(a), the SBC h for tin is essentially the same as those of the FM single sphere. For indium however, the SBC are systematically lower than those of FM by 10% for 0.8.
All results were moreover obtained by variation of the magnetic field, rather than temperature, which as shown by Chaddah and Roy Caddah and Roy (1999) results in an enhanced , apart from any diamagnetic interaction, as a result of the thermal fluctuations induced by the field changes themselves.
The variation of with temperature suggests a variation of the transition order with temperature, which has possibly important ramifications since is then less a fundamental property of the superconductor than a simple ratio between the two characteristic lengths in the description, both of which vary with temperature and yield results consistent with the observed determinations. Variation of the order of the transition with the temperature is predicted in recent renormalization-based reformulations of basic superconductive theory Hove and Sudbø (2002), which include fluctuations in the involved gauge and scalar fields, and result in a dividing line between type-I and -II behavior at with a magnetic response which can be varied between type-I and type-II simply by temperature change. This variation has been seen in magnetization measurement of nitrogen-doped Ta ( = 0.665) Auer and Ullmaier (1973), but is otherwise unconfirmed.
V V. Conclusions
Reexamination of previous Ginzburg-Landau parameter determinations from superheating field measurements of microspheres of tin and indium shows the long-standing discrepancy in reported of tin to derive from the different analyses methods employed, rather than whether single- or multi-grain determinations, or grain metallurgy. Although the tin results of SBC can be made to agree with those of FM (and Larrea et. al.), the customary analyses via Eq. (2) is in disagreement with that performed numerically. This is not the case of indium, where the discrepancy reflects severe differences in the supercritical field measurements themselves.
The similar reexamination of the supercooling field measurements uncovers no divergences capable of explaining the discrepancies with the measurements of Ref. Chang and Serin (1966); Miller and Cody (1968). To the contrary, the variation of with appears to confirm the latter, raising severe questions as to the true significance of as a descriptor of superconductors. The resolution of these is however beyond the scope of this work.
The available 1 data is of insufficient precision to permit more than suggestions as to . Analyses of all superheating results via the Padé approximation yields a convergence of , to , with values for each material only slightly different from those previously reported on the basis of alone. These previous results however are likely larger than actual as a result of diamagnetic interactions between the superconducting sphere population. Apart from nonlocal effects, the large for 0.8 is likely due to defect presence, which causes nucleation of the normal state to occur at fields below the maximal . These become unimportant as 1, increasing and generating a rapid drop in .
Whether the proper analyses is by Eq. (2a), numerical or Padé remains in question. Nevertheless, all of the materials analyzed in Ref. Smith et al. (1970) (tin, indium, thallium, lead and mercury) follow from the SBC Fig. 1; in contrast, the analyses of the remaining Refs. has proceeded via Eq. (2), which is seen to underestimate the respective . In view of the significance of the Ginzburg-Landau parameter, the uncertainties inherent to this technique and the variation in experimentally-obtained results, and technological advances over the last thirty years, careful remeasurements of the supercritical fields over the full temperature range, and their analysis within a definitive description of the plane, would seem to be indicated.
The discrepancy in between spheres and thin film/foil determinations has been known for some decades, but to the best of our knowledge remains unexplained. The thin film/foil results are in fact a factor 1.7 larger than those from the microspheres; they are also in better agreement with derived from via , and also agree in general with the lower temperature results of the microspheres.
VI Acknowledgements
We thank J. Seco for preliminary investigations of the discrepancy which stimulated the re-analyses herein, A. Baptista for assistance in last phases of the analysis, and G. Waysand for critical comments. The work was supported in part by grants PRAXIS/FIS/10033/1998 and POCTI/FNU/39067/2001 of the Foundation for Science and Technology of Portugal, co-financed by FEDER.
References
- Tinkham (1975) M. Tinkham, Introduction to Superconductivity (McGraw-Hill, NY, 1975).
- P.G. de Gennes (1966) P.G. de Gennes, Superconductivity of Metals and Alloys (W. A. Benjamin, Inc., NY, 1966).
- Chang and Serin (1966) G. K. Chang and B. Serin, Phys. Rev. 145, 274 (1966).
- Miller and Cody (1968) R. E. Miller and G. D. Cody, Phys. Rev. 173, 494 (1968).
- Smith et al. (1970) F. W. Smith, A. Baratoff, and M. Cardona, Phys. Kondens. Materie 12, 145 (1970).
- de la Cruz et al. (1969) F. de la Cruz, M. D. Maloney, and M. Cardona, Proc. Conf. on Science of Superconductivity (Stanford University Press, Stanford, 1969).
- de la Cruz et al. (1971) F. de la Cruz, M. D. Maloney, and M. Cardona, Phys. Rev. B3, 3802 (1971).
- Feder et al. (1966) J. Feder, S. R. Kiser, F. Rothwarf, J. P. Burger, and C. Valette, Sol. State. Comm. 4, 611 (1966).
- Smith et al (1968) F. W. Smith and M. Cardona, Sol. State. Comm. 6, 37 (1968).
- Burger et al. (1994) J. P. Burger, J. Feder, and S. R. Kiser, et al., Proc. 10th Int’l Conf. on Low Temperature Physics (VINITI, Moscow, 352 1967).
- Feder and McLachlan (1968) J. Feder and D. McLachlan, Phys. Rev. 177, 763 (1968).
- Feder et al. (1994) J. Feder, S. R. Kiser, and F. Rothwarf, Phys. Rev. Lett. 17, 87 (1966).
- Smith et al (1968) F. W. Smith and M. Cardona, Sol. State. Comm. 5, 345 (1966).
- Larrea et al (1968) A. Larrea et al., Nucl. Instr. & Meth. A137, 541 (1992).
- Smith et al (1967) F. W. Smith and M. Cardona, Phys. Lett. 24A, 247 (1967).
- Smith et al (1967) F. W. Smith and M. Cardona, Phys. Lett. 25A, 345 (1967).
- Valko et al. (1994) P. Valko, M. R. Gomes, and TA Girard, Phys. Rev. B75, 140504(R) (2007).
- Auer and Ullmaier (1973) J. Auer and H. Ullmaier, Phys. Rev. B66, 136 (1973).
- Landau and Ott (2003) I. L. Landau, and H. R. Ott, Physica C398, 73 (2003).
- Ebneth and Tewordt (1965) G. Ebneth, and L. Tewordt, Z. Physik 185, 421 (1965).
- Ginzburg (1958) V. L. Ginzburg, Sov. Phys. JETP 7, 78 (1958).
- Thompson and Baratoff (1968) R. S. Thompson, and A. Baratoff, Phys. Rev. 167, 361 (1968).
- Dolgert, Bartolo and Dorsey (1996) A. J. Dolgert, S. J. D. Bartolo, and A. T. Dorsey, Phys. Rev. B534, 5650 (1996-I).
- Hueber,Valette and Waysand (1979) D. Hueber, C. Valette, and G. Waysand, Physica 108B, 1229 (1979).
- Penaranda, Auguet and Ramirez-Piscina (1999) A. Penaranda, C. E. Auguet, and L. Ramirez-Piscina, Nucl. Instr. & Meth. A424, 512 (1999).
- Caddah and Roy (1999) P. Chaddah, and S. B. Roy, Phys. Rev. B60, 11926 (1999-I).
- Hove and Sudbø (2002) S. M. J. Hove and A. Sudbø, Phys. Rev. B66, 064524 (2002).