Planetary embryos and planetesimals residing in thin debris disks
Abstract
We consider constraints on the planetesimal population residing in the disks of AU Microscopii, Beta Pictoris and Fomalhaut taking into account their observed thicknesses and normal disk opacities. We estimate that bodies of radius 5, 180 and 70 km are responsible for initiating the collisional cascade accounting for the dust production for AU-Mic, Beta-Pic and Fomalhaut’s disks, respectively, at break radii from the star where their surface brightness profiles change slope. Larger bodies, of radius 1000km and with surface density of order g cm-2, are required to explain the thickness of these disks assuming that they are heated by gravitational stirring. A comparison between the densities of the two sizes suggests the size distribution in the largest bodies is flatter than that observed in the Kuiper belt. AU Mic’s disk requires the shallowest size distribution for bodies with radius greater than 10km suggesting that the disk contains planetary embryos experiencing a stage of runaway growth.
1 Introduction
Recent visible band images taken with the Advanced Camera for Surveys on the Hubble Space Telescope well resolve the vertical scale height of two edge on debris disks, the 12Myr old (Barrado y Navascues et al., 1999; Zuckerman et al., 2001) dusty circumstellar disks of the M1Ve star AU Microscopii (AU Mic) and the A5V star Pictoris ( Pic) (Krist et al., 2005; Golimowski et al., 2006). Also resolved is the inner edge of Fomalhaut’s eccentric ring also allowing a measurement of the disk scale height (Kalas et al., 2005). The vertical scale height, , is related to the inclination dispersion of dust particles and so allows an estimate of the velocity dispersion of the smallest particles. The velocity dispersion of planetesimals sets the energy of inter-particle collisions and so affects a calculation of the dust production rate through a collisional cascade (e.g., Kenyon 2002; Wyatt & Dent 2002; Dominik & Decin 2003; Wyatt et al. 2007). The velocity dispersion is also sensitive to the presence of larger bodies in the disk as gravitational scattering or stirring causes an increase in the velocity dispersion with time (e.g., Stewart & Ida 2000; Kenyon & Bromley 2001). Here by combining observations of observed vertical thickness with estimates for the dust production and gravitational stirring rates we will place constraints on the underlying planetesimal population in these disks. Because of the difficulty in resolving vertical structure, previous cascade calculations have not used a velocity dispersion consistent with that estimated for these disks or estimated the role of gravitational stirring.
2 Scaling across the collisional cascade
We consider three disks with resolved vertical scale heights. The properties of these three systems along with the quantities we estimate from them are listed in Table 1. For AU Mic and Pic we list properties at the radius, , from the star where there is break in the surface brightness profile. For Fomalhaut, we list properties in the ring edge. One of the observed quantities is the optical depth, , at wavelength, , normal to the disk plane. Because the absorption or emissivity coefficient of a dust grain with radius is reduced for , and there are more dust grains with smaller radii, we expect the optical depth to be related to the number density of particles of radius (e.g., see discussion in section 4 by Wyatt & Dent 2002). As we only detect the dust particles in scattered light or in thermal emission, we use scaling arguments to estimate the number of larger bodies residing in the disk.
Another observed quantity is the disk thickness that we describe in terms of a scale height that here is a half width. The disk aspect ratio is the scale height divided by radius; . A population of low inclination orbits has , so . Here and is the inclination dispersion. Subsequently we also refer to where is the eccentricity dispersion. We assume a Rayleigh distribution of particle inclinations and eccentricities.
We review how the dust opacity and disk thickness can be used to estimate the planetesimal size distribution. Dust production in a destructive collisional cascade can in its simplest form be studied with a power law size distribution. The single power law form for the size distribution is in part based on the simplest assumption that the specific energy (kinetic energy per unit mass), , required to catastrophically disrupt a body is a fixed number independent of body radius; (often erg g-1 for icy bodies is used based on the estimates by Kenyon & Luu 1999). The number of particles with radius in a logarithmic bin of size is predicted to be
| (1) |
Using a logarithmic bin gives the same scaling with as a cumulative distribution (see appendix A by O’Brien & Greenberg 2005). In an infinite destructive self-similar collisional cascade, the exponent is predicted to be (Dohnanyi, 1968; Tanaka et al., 1996; Davis & Farinella, 1997; Kenyon, 2002). The main asteroid belt, if fit with a single power law, has a lower exponent of (Ivezic et al, 2001). It is collisionally evolved but deviates from because of additional removal mechanisms (e.g., Yarkovsky drift and resonances) and because the material properties depend non trivially on size (O’Brien & Greenberg, 2005). In contrast the larger bodies in the Kuiper belt are consistent with (Bernstein et al., 2004). Because of their low number these do not collide often enough to be part of an ongoing destructive collisional cascade. The high exponent probably reflects conditions during the early solar system when planetesimals were growing as well as colliding (e.g., Wetherill & Stewart 1993; Kokubo & Ida 1996).
The number of objects of radius can be estimated from another of radius using the scaling relation
| (2) |
This relates the number of larger particles to the smallest and so observable particles. Estimates of the number of dust particles, , as a function of their radius, , can be made from studies of optical, infrared and submillimeter observations. It must be kept in mind that because of the uncertainty in the exponent , it is difficult to be accurate when extrapolating over orders of magnitude in the size distribution.
The fractional area covered by particles of radius or in a log radial bin can be similarly estimated. Because the opacity depends on the number per unit area times the cross section area, our assumed power law gives for the opacity integrated over a log radial bin
| (3) |
where and is the number of particles per unit area with radius in a log radial bin. Likewise the surface mass density
| (4) |
where . For , most of the disk mass is in the largest particles or at the top of the cascade. Gravitational stirring and dynamical friction heating and cooling rates are proportional to the product of the surface density time the mass (e.g., equations 6.1 and 6.2 by Stewart & Ida 2000), scaling as
| (5) |
where . Even when the size distribution is as steep as that for the large objects in the Kuiper belt () gravitational stirring is dominated by the largest bodies.
The optical depth is related to the collision time. For a population of identical objects the collision timescale
| (6) |
(Hanninen & Salo, 1992) where is the mean motion (angular rotation rate for a particle in a circular orbit) at radius . Since the collision lifetime is proportional to the inverse of the optical depth, the timescale for a particle of radius to hit another with the same size scale (again in log radial bins) is
| (7) |
As explored by Dominik & Decin (2003); Wyatt et al. (2007), smaller particles are capable of dispersing a larger one if the specific energy of the collision exceeds the critical value. The collision lifetime is shorter by a factor of (Equation 21,22 and associated discussion by Dominik & Decin 2003), where is the radius of a smaller particle capable of disrupting one with radius . The parameter is estimated by considering what energy projectile object can disrupt the target,
| (8) |
(approximating Equation 25 by Dominik & Decin 2003)111The square root term in equation 25 by Dominik & Decin (2003) should be positive, where is the relative or inter-particle velocity dispersion. We expect the relative velocity dispersion is twice the particle velocity dispersion or .
We can now estimate the collisional lifetime for particles in a log radial bin taking into account collisions with smaller particles. After multiplying by Equation 8, Equation 7 becomes
| (9) |
For , the timescale consistent with Equation 23 by Dominik & Decin (2003). The maximum radius object that will disrupt during the lifetime of the system is found by setting to the age of the system, , and solving Equation 9 for . This estimate was also used by Wyatt & Dent (2002) in their section 5.3. In other words we define a radius, such that or
| (10) |
For this gives
| (11) |
where is the rotation period at radius . If the disk is hotter or older then a higher surface density disk that contains more massive bodies is required to initiate the collisional cascade and account for the dust production.
Objects of radius are those likely to be currently initiating the collisional cascade. Using Equation 4 with we can estimate the total surface density in these massive objects. As the disk grinds up and is depleted, more massive but lower number density objects can enter and generate the cascade.
2.1 In relation to observables
We first relate the disk aspect ratio, , to the velocity dispersion and the inclination and eccentricity dispersions. A population of low inclination orbits has , so . An isotropically scattering disk is expected to have (e.g., Inaba et al. 2001). At low eccentricity, the radial velocity dispersion is , and the tangential and vertical velocity dispersions are , where is the velocity of a particle in a circular orbit (e.g., see equations C10a,b by Wetherill & Stewart 1993). The total velocity dispersion is the sum of the three velocity components corresponding to or
| (12) |
These approximations are consistent with used by previous studies (Wyatt & Dent, 2002; Wetherill & Stewart, 1993).
In Equation 3 we described the scaling of opacity in a log radial bin. The normal disk opacity inferred from observations at wavelength , depends on the disk emissivity or absorption coefficient (here denoted )
| (13) |
This is consistent with our definition for (Equation 3) and approximations commonly used in interpreting observed fluxes (e.g., equation 1 by Backman et al. 1992 relating dust opacity to flux and the definition given in the caption of Fig. 6 by Pantin et al. 1997). The simplest models for the absorption or emissivity coefficient of a particle estimate that these coefficients are
| (14) |
(e.g., Backman et al. 1992; Wyatt & Dent 2002) with . For and by integrating Equation 13 we find that .
More detailed modeling of the absorption coefficients (e.g., Pollack et al. 1994) shows deviations from this simplest model with strong structure at specific wavelengths such as the m silicate feature. In addition, the exponent , describing the dust size distribution, may not be well constrained or may not be the same for small dust particles as for larger ones (e.g., Augereau & Beust 2006) or for cm or m sized bodies. The wavelength at which the absorption coefficient begins to drop for equation 14 may depend on dust composition (see discussion in appendix D by Backman et al. 1992). Multi-wavelength observations are required to better model the size distribution and composition of the dust. To take this uncertainty into account we describe our estimates in terms of a factor , such that
| (15) |
that relates the opacity estimated at a wavelength based on observations to the size distribution of particles with radius equal to that wavelength.
An estimate of normal disk opacity at a particular radius requires modeling the surface brightness distribution (Golimowski et al., 2006; Krist et al., 2005; Augereau & Beust, 2006). Unfortunately, normal disk opacity estimates are available only at a few wavelengths for the three disks we are considering here and not all of these are based on multi-wavelength models. While optical and near-infrared wavelength observations tend to better resolve the disks, they may not accurately predict the mm size distribution (e.g., see the discussion comparing the optical and near-infrared opacities to that predicted from the submillimeter for AU Mic by Augereau & Beust 2006). We summarize the existing observed optical depth measurements for these three disks in Table 1 and in the associated table notes but note that there is uncertainty in the conversion factor between the measured optical depths and the opacity function that we have use here, , the optical depth integrated in a log radial bin of size 1 for dust particles of size . As the opacity of smaller grains is sensitive to the removal process as well as collisions it is important to use observed opacity that is dominated by particles that are not affected by radiative forces (e.g., see discussion by Dominik & Decin 2003).
We now convert Equation 11 into a form more easily computed from observables. The observables are the disk aspect ratio, and the normal disk opacity at wavelength . The size of the objects initiating the collisional cascade when
| (16) | |||||
Because we have scaled with the inclination or aspect ratio instead of the collision velocity the exponent of and differ from but are consistent with equation 36 by Dominik & Decin (2003). The relation also differs from previous work (Wyatt & Dent, 2002; Dominik & Decin, 2003; Wyatt et al., 2007) because we have based our estimate on a collision time scaled from the face on disk opacity at a particular radius rather than the total fraction of starlight re-emitted in the infrared.
Inserting our value for the into equation 4 yields an estimate for the total disk density,
| (17) | |||||
We have assumed here that the collision cascade started very early in the life of the system, however at early stages the inter-particle velocities were probably not high enough for destructive collisions (Kenyon & Bromley, 2001; Dominik & Decin, 2003). If the timescale of the destructive cascade were smaller then and would both be smaller than the estimates given above.
The product of the density times the mass for the bodies initiating the cascade
| (18) | |||||
3 Heating the disk with gravitational stirring
We explore the idea that the observed thickness of the disk is due to gravitational stirring by bodies of mass, , surface density, , and size . We define a mass ratio , and surface density ratio . If the disk is in collisional equilibrium then we expect that .
In the dispersion dominated regime, and assuming that the dispersions of the tracer particles exceed those of the massive particles doing the stirring ( and )
| (19) |
(based on Equation 6.2 by Stewart & Ida 2000) where (corresponding to Equation 2.11 by Stewart & Ida 2000). The function described by Stewart & Ida (2000) . The coefficient and we estimate using Equation 2.7 by Stewart & Ida (2000)
| (20) |
As the coefficient, , only depends logarithmically on we can use the scale height estimated from observations to estimate and we can solve Equation 19 finding that , specifically
| (21) |
The above Equation can be inverted at time
| (22) |
where we have set to be the rotation period at . In terms of observables this leads to a constraint on the largest bodies with size
| (23) | |||||
We note that the constraint on the product of the surface density times the mass of the largest bodies is independent of the disk opacity. In contrast the estimates for the top of the collisional cascade (size of object and density) are sensitive to the dust opacity.
3.1 Connecting the size distributions
Equation 16 gives us an estimate for the size of the bodies at the top of the collisional cascade, and Equation 18 gives us the surface density times mass in the disk for these bodies. This product is well below that needed to account for the disk thickness with gravitational stirring (Equation 23). To find the size, , of the bodies responsible for the gravitational stirring we must extend the size distribution beyond .
Unfortunately, for bodies with sizes we can no longer assume a size distribution consistent with a collisional cascade. There are few guidelines on what type of power law to use for bodies greater than 10km. The only known system that differs significantly from the size distribution expected from collisional evolution might be the largest bodies in the Kuiper belt that have size distribution with power law (Bernstein et al., 2004). A variety of size distributions might be produced during the phase of planetesimal growth with low values for the exponent at the high mass end implying runaway growth (e.g., Wetherill & Stewart 1993; Kokubo & Ida 1996; Inaba et al. 2001).
To place constraints on the size and density of the largest bodies and exponent of the size distribution for these bodies we compare our constraint on the product of the surface density and mass of the largest bodies to the surface density and size of the bodies initiating the collisional cascade.
In Figure 1 we plot the constraint on the product of disk surface density times mass for AU Mic. This constraint corresponds to a surface density as a function of the radius of a body and is computed from Equation 23 using values listed in Table 1 and . The horizontal axis is log radius instead of log mass so the slope of this constraint is -3. The conversion between mass and radius has been done with a density of 1 g cm-3. On this plot we have plotted as dotted lines two other constraints on bodies in the disk. We estimate that the most massive bodies cannot on average be closer together than their mutual Hill spheres,
| (24) |
where the mutual Hill radius for two bodies of similar mass . This constraint gives the upper dotted line. We also require that the number of bodies not be extremely low,
| (25) |
This constraint is plotted as the lower dotted line. The range of densities for the most massive bodies in the disk must lie on the solid one and between the two dotted ones. Also plotted on this plot is the estimated density, , and radius, , of the particles initiating the cascade. Arrows are drawn for surface densities that have size distributions with exponents and and that have . The circle showing the top of the collisional cascade must be connected to the thick solid line segment that lies between the two dotted ones to estimate the exponent of the size distribution for .
The solid thick line segment between the two thin dotted lines in Figure 1 suggests that 1000km bodies reside in AU Mic’s disk even though the collisional cascade only requires bodies of radius a few km. We have checked that our estimated value of 12 for is consistent with the mass of these 1000 km bodies and the disk thicknesses. (equation 20). For most of the disk mass resides in the most massive bodies. Connecting the circle with the line segment requires a slope shallower than . Most of the disk mass must reside in 1000 km embryos in AU Mic’s disk to account for its thickness even though only km sized bodies are required to account for its dust production.

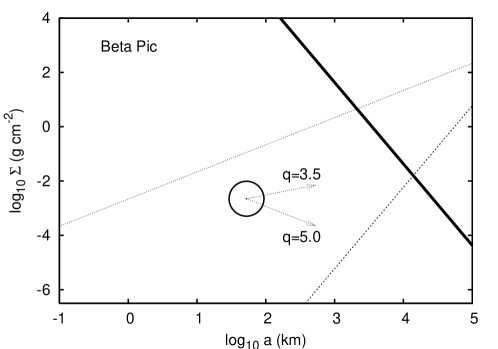

Figure 2 and 3 are similar to Figure 1 except computed for Pic’s and Fomalhaut’s disks also using parameters listed in Table 1. We attribute the differences in these figures primarily to the observed thickness as (equation 16). -Pic’s disk is quite a bit thicker than Fomalhaut’s or AU Mic’s so its collisional cascade is more efficient and so requires higher mass progenitors. Fomalhaut is older allowing a lower density disk to account for the thickness.
Gravitational stirring requires similar sized embryos for the three disks but for Fomalhaut the mass and surface density of the bodies is only an order of magnitude larger than that predicted from estimating the top of the collisional cascade. Nevertheless, the bodies we infer at the top of the collisional cascade are not sufficiently dense and massive to account for the thickness of this disk.
A comparison between the surface densities in the bodies required to account for the disk thickness and that predicted at the top of the collision cascade allows exponents and for the three disks AU Mic, -Pic and Fomalhaut, respectively. The extremely shallow exponent for AU Mic at the top end suggests that the size distribution deviates from power law form. A curve in the size distribution at the high mass end has been predicted by models and simulations of planetesimal accretion when the disk contain embryos in a stage of runaway growth (Wetherill & Stewart, 1993; Kokubo & Ida, 1996; Inaba et al., 2001).
We have only considered the effect of gravitational stirring in the dispersion dominated regime. Now that we have an estimate for the masses of the most massive bodies residing in these disks, we check this assumption. Only for km does a body’s Hill radius approach a scale height for an inclination . The dispersion dominated gravitational stirring estimate used in Equation 19 (rather than a sheer dominated one) is therefor reasonable. Previous work has found that passage through the sheer dominated regime is comparatively fast (e.g., Kenyon & Bromley 2001). A better estimate would take into account both regimes, though the improved constraints on the massive bodies should not significantly deviate from those estimated here.
4 Discussion
We have used estimates of collisional cascades (e.g., Kenyon 2002; Dominik & Decin 2003; Wyatt et al. 2007) to estimate the size and surface density of the bodies responsible for initiating the collisional cascade. We have done this for 3 debris disks, that of AU Mic, -Pic and Fomalhaut, with resolved vertical structure estimating that these bodies have radii of 4, 180, and 70 km, respectively. We have estimated these at the radius at which the surface brightness profile changes slope (also called the break radius). The body sizes are a few times larger than previous estimates (e.g., Wyatt & Dent 2002). The differences arise because we have based our estimate on a collision time scaled from the face on disk opacity at a particular radius rather than the total fraction of starlight re-emitted in the infrared and we have used the observed disk aspect ratio to estimate the velocity of collisions.
Assuming that the smallest particles are heated solely by gravitational stirring from the largest ones, the disk thickness can be used to place a constraint on the product of the surface density times mass of the largest bodies (Equation 18). From this we infer that 1000km radius bodies or planetary embryos are likely to reside in these three disks. The large body sizes do not conflict with the lack of observed gaps in the disks (Quillen, 2006, 2007) except possibly for the extreme high mass end allowed for -Pic’s disk. A comparison between the surface densities in these bodies and that predicted at the top of the collision cascade allows exponents for the three disks AU Mic, -Pic and Fomalhaut, respectively. The shallow exponent for AU Mic at the top end suggests that this disk contains embryos in a stage of runaway growth, as predicted by simulations (Wetherill & Stewart, 1993; Kokubo & Ida, 1996; Inaba et al., 2001). For all three disks we infer that most of the disk mass is likely to reside in embryos and estimate that the surface densities are of order g cm-2.
A number of simplifying assumptions went into estimating the properties of the top of the cascade. We assumed only a single power law form for the size distribution, however, the specific energy for dispersion is predicted to depend on body size (Benz & Asphaug, 1999) so a single power law is probably not a good assumption. The disks may not have been sufficiently excited for efficient dust production during the entire lifetime of these systems (Dominik & Decin, 2003). A shorter collisional lifetime would lead to a lower surface density and size estimated for the top of the cascade (see Equations 17, 16), though taking into account the dependence of the specific energy on size in the regime where self-gravity is important would increase the surface density of larger bodies and might decrease the size at the top of the cascade. The sizes at the top of the cascade predicted here are nearing the threshold for a destructive equal-mass collision at a velocity estimated from the disk thickness, particularly in the case of Fomalhaut that has a very thin disk but has a large estimated .
Our estimate of the gravitational stirring rate neglected the role of dynamical friction from smaller particles and the sheer dominated regime. Both should be taken into account to improve the estimate of size and number of the largest bodies residing in these disks.
Better modeling of the dust distribution using multi-wavelength observations and high angular resolution imaging would significantly improve constraints on the small radius end of the size distribution. While we have found normal disk opacity measurements in a few wavelengths in the literature, the different wavelength estimates, different assumptions for the assumed size distributions and different procedures for modeling the data make it difficult to constrain and compare the dust size distributions and normal disk opacities among the disks.
We have discussed ways to improve the estimates introduced here. We now discuss possible implications based on these predictions. If the size distributions inferred here are common then longer lifetimes would be predicted for dust production because the larger bodies (inferred here), entering the cascade later, contain a reservoir of mass available for dust production at later times. The distribution of disk properties as a function of age can be used to place constraints on planetesimal growth models as well as dust production.
We have only considered opacities at particular radii for these disks. For AU Mic and -Pic we chose radii at which there is a break (or change in slope) in the surface brightness profile. If the disk aspect ratios do not strongly vary with radius then Equation 23 implies that the product of the mass times the surface density in the largest bodies, is only weakly decaying with radius. Compare this to and predicted via Equations 16,17. Both and must drop rapidly with radius. If disks are not extremely thin at larger radii then either there is another source of heating at large radii accounting for the disk thickness, or dust particles detected at large radii originate from inner radii and are either blown out or are on highly eccentric orbits (Augereau & Beust, 2006; Strubbe & Chiang, 2006). A thin and sparse disk will not efficiently produce dust as the collisions are not destructive. Consequently multi-wavelength observations resolving disks as a function of radius should be able to test the utility of the estimates explored here as well as better probe planetesimal growth and evolution with radius.
—————
We thank the Observatoire de la Côte D’Azur for support, a warm welcome and and hospitality during January 2007. We thank Patrick Michel, Derek Richardson and Hal Levison for interesting discussions. Support for this work was in part provided by National Science Foundation grants AST-0406823 & PHY-0552695, the National Aeronautics and Space Administration under Grant No. NNG04GM12G issued through the Origins of Solar Systems Program, and HST-AR-10972 to the Space Telescope Science Institute.
References
- Augereau & Beust (2006) Augereau, J.-C., & Beust, H. 2006, A&A, 455, 987
- Augereau et al. (2001) Augereau, J.-C., Nelson, R. P., Lagrange, A. M., Papaloizou, J. C. B., & Mouillet, D. 2001, A&A, 370, 447
- Barrado y Navascues et al. (1999) Barrado y Navascues, D., Stauffer, J.R., Song, I., & Caillault, J.-P. 1999, ApJ, 520, L123
- Barrado y Navascues (1998) Barrado y Navascues D., 1998, A&A, 339, 831
- Backman et al. (1992) Backman, D. E., Witteborn, F. C., & Gillett, F. C. 1992, ApJ, 385, 670
- Benz & Asphaug (1999) Benz, W., & Asphaug, E. 1999, Icarus, 142, 5
- Bernstein et al. (2004) Bernstein, G. M., Trilling, D. E., Allen, R. L., Brown, M. E., Holman, M., & Malhotra, R. 2004, AJ, 128, 1364
- Crifo et al. (1997) Crifo, F., Vidal-Madjar, A., Lallement, R., Ferlet, R., & Gerbaldi, M. 1997, A&A, 320, L29
- Davis & Farinella (1997) Davis, D. R., & Farinella, P. 1997, Icarus, 125, 50
- Dohnanyi (1968) Dohnanyi, J. S. 1968, in IAU Symp. 33, Physics and Dynamics of Meteors, ed. L. Kresak & P. M. Millman (Dordrecht:Reidel), 486
- Dominik & Decin (2003) Dominik, C., & Decin, G. 2003, ApJ, 598, 626
- Golimowski et al. (2006) Golimowski, D. A., et al. 2006, AJ, 131, 3109
- Hanninen & Salo (1992) Hanninen, J., & Salo, H. 1992, Icarus, 97, 228
- Houdebine & Doyle (1994) Houdebine, E. R., & Doyle, J. G. 1994, A&A, 289, 185
- Inaba et al. (2001) Inaba, S., Tanaka, H., Nakazawa, K., Wetherill, G. W., & Kokubo, E. 2001, Icarus, 149, 235
- Ivezic et al (2001) Ivezic, Z., et al. 2001, AJ, 122, 2749
- Kalas et al. (2005) Kalas, P., Graham, J. R., & Clampin, M. 2005, Nature, 435, 1067
- Kenyon (2002) Kenyon, S. J. 2002, PASP, 114, 265
- Kenyon & Bromley (2001) Kenyon, S. J., & Bromley , B. C. 2001, AJ, 121, 538
- Kenyon & Luu (1999) Kenyon, S. J., & Luu, J. X. 1999a, AJ, 118, 1101
- Kokubo & Ida (1996) Kokubo, E., & Ida, S. 1996, Icarus, 123, 180,
- Krist et al. (2005) Krist, J. E. et al. 2005, AJ, 129, 1008
- Marsh et al. (2005) Marsh K. A., Velusamy T., Dowell C. D., Grogan K., & Beichman C. A., 2005, ApJ, 620, L47
- O’Brien & Greenberg (2005) O’Brien, D. P., & Greenberg, R. 2005, Icarus, 178, 179
- Pantin et al. (1997) Pantin, E., Lagage, P. O., & Artymowicz, P. 1997, A&A, 327, 1123
- Pollack et al. (1994) Pollack, J. B., Hollenbach, D., Beckwith, S., Simonelli, D.P., Roush, T., & Fong, W. 1994, ApJ, 421, 615 Predictions for a planet just inside Fomalhaut’s eccentric ring
- Quillen (2006) Quillen, A. C. 2006, MNRAS, 372, L14
- Quillen (2007) Quillen, A. C. 2007, MNRAS, in press, astro-ph/0701304
- Song et al. (2001) Song I., Caillault J.-P., Barrado y Navascues D., & Stauffer J. R., 2001, ApJ, 546, 352
- Stewart & Ida (2000) Stewart, G. R., & Ida, S. 2000, Icarus, 143, 28
- Tanaka et al. (1996) Tanaka, H., Inaba, S., & Nakazawa, K. 1996, Icarus, 123, 450
- Strubbe & Chiang (2006) Strubbe, L. E., & Chiang, E. I. 2006, ApJ, 648, 652
- Wetherill & Stewart (1993) Wetherill, G. W. & Stewart, G. R. 1993, Icarus, 106, 190
- Wyatt et al. (2007) Wyatt, M. C., Smith, R., Greaves, J. S., Beichman, C. A., Bryden, G., & Lisse, C. M. 2007, ApJ, 658, 569
- Wyatt & Dent (2002) Wyatt, M. C., & Dent, W. R. F. 2002, MNRAS, 334, 589
- Zuckerman et al. (2001) Zuckerman, B., Song, I., Bessell, M. S., & Webb, R. A. 2001, ApJ, 562, L87
| Stellar and Disk Properties | ||||
|---|---|---|---|---|
| Row | AU Mic | Pic | Fomalhaut | |
| 1 | () | 0.59 | 1.75 | 2.0 |
| 2 | Age (Myr) | 12 | 12 | 200 |
| 3 | (AU) | 30 | 100 | 133 |
| 4 | 0.019 | 0.05 | 0.013 | |
| 5 | ||||
| 6 | (m) | 1 | 10 | 24 |
| Estimated Planetesimal Properties | ||||
| 7 | (km) | 4 | 180 | 68 |
| 8 | (g cm-2) | 0.00005 | 0.005 | 0.002 |
| 9 | (g2 cm-2) | |||
| 10 | (g2 cm-2) | |||
By Row. 1) References for the stellar masses: Houdebine & Doyle (1994); Crifo et al. (1997); Song et al. (2001), respectively. 2) References for the ages: Barrado y Navascues et al. (1999); Barrado y Navascues (1998). 3) The radii are chosen to be where there is a break in the surface brightness profile as described by Krist et al. (2005); Golimowski et al. (2006); Kalas et al. (2005), respectively. 4) The aspect ratio for the half width half max of the disk at radius . Aspect ratios are taken from the same references as the break radii listed in row 3. 5,6) The normal disk opacity at wavelength is given. References for normal disk opacities: The normal disk opacity for AU Mic is estimated for sized particles from Fig. 6 by Augereau & Beust (2006) based on images in the optical and near infrared. That for -Pic is taken from Fig. 6 by Pantin et al. (1997) based on mid-infrared spectra. That for Fomalhaut is from Table 1 by Marsh et al. (2005) predicted for a reference wavelength of m based on 350, 160 and 70m imaging. 7) The radius of objects initiating the collisional cascade, is estimated using Equation 16. 8) The surface density is estimated using Equation 17. 9) The product of the surface density times the mass is estimated for bodies initiating the collisional cascade. 10) The product of the surface density times the mass is estimated using Equation 18 for bodies responsible for thickening the disk. Computed quantities listed in rows 7-10 have been done with parameter (defined in Equation 15).