Deconstructing dwarf galaxies: a Suprime-Cam survey of Andromeda II††thanks: Based on data collected at Subaru Telescope, which is operated by the National Astronomical Observatory of Japan
Abstract
We present deep, sub-horizontal branch, multi-colour photometry of the Andromeda II dwarf spheroidal (And II dSph) taken with the Subaru Suprime-Cam wide field camera. We identify a red clump population in this galaxy, the first time this feature has been detected in a M31 dSph, which are normally characterized as having no significant intermediate age populations. We construct radial profiles for the various stellar populations and show that the horizontal branch has a nearly constant density spatial distribution out to large radius, whereas the reddest red giant branch stars are centrally concentrated in an exponential profile. We argue that these populations trace two distinct structural components in And II, and show that this assumption provides a good match to the overall radial profile of this galaxy. The extended component dominates the stellar populations at large radius, whereas the exponential component dominates the inner few arcminutes. By examining colour-magnitude diagrams in these regions, we show that the two components have very different stellar populations; the exponential component has an average age of Gyrs old, is relatively metal-rich ([Fe/H] ) but with a significant tail to low metallicities, and possesses a red clump. The extended component, on the other hand, is ancient ( Gyrs), metal-poor ([Fe/H] ) with a narrower dispersion , and has a well developed blue horizontal branch. The extended component contains approximately three-quarters of the light of And II and its unusual density profile is unique in Local Group dwarf galaxies. This suggests that its formation and/or evolution may have been quite different to other dwarf galaxies. The obvious chemo-dynamical complexity of And II lends further support to the accumulating body of evidence which shows that the evolutionary histories of faint dSph galaxies can be every bit as complicated as their brighter and more massive counterparts.
keywords:
galaxies: dwarf — galaxies: individual (Andromeda II) — Local Group — galaxies: stellar content — galaxies: structure1 Introduction
The classic view of dwarf spheroidal (dSph) galaxies consisting of a single, old, stellar population has changed drastically in recent years, as deeper and more detailed observations of the Milky Way (MW) satellites have been conducted. The shift has been so dramatic that only a minority of the MW dSphs are now suspected of being composed of a single stellar population, with most demonstrating multiple epochs of star formation (for recent reviews, see Grebel 1997; Mateo 1998; Skillman 2005, and references therein). As emphasised in Grebel (1997), no dwarf galaxies in the Local Group appear to share the same star formation history (SFH).
Most recently, various groups are independently showing that the evolutionary complexities revealed in the SFHs of some dwarf galaxies also extend to their global structural properties. Harbeck et al. (2001) investigated the presence of population gradients in the stellar populations of a selection of Local Group dwarf galaxies, by comparing the ratio of blue-to-red horizontal branch (HB) stars, and blue-to-red red giant branch (RGB) stars. These colour differences should reflect changes in the ages and/or metallicities of the stellar populations. They found evidence for gradients in six out of the nine systems they studied. Recent spectroscopic studies of Sculptor (Tolstoy et al. 2004), Fornax (Battaglia et al. 2006) and Canes Venatici (Ibata et al. 2006) have shown that these galaxies possess spatially and kinematically distinct stellar populations. The radial gradients in these systems therefore reflect the changing contributions of the distinct stellar components as a function of radius. However, Koch et al. (2007b, a) do not detect any radial gradients or kinematically distinct population in their spectroscopic studies of Leo I and Leo II, and Koch et al. (2006) do not spectroscopically detect a metallicity gradient in Carina despite a strong age gradient implied by Harbeck et al. (2001). At this time, it is therefore unclear how common all these features are, particularly regarding kinematically distinct populations.
Less is known about the global stellar populations of the M31 dSphs than for the MW dwarfs. However, several of the dSph galaxies studied by Harbeck et al. (2001) belong to the M31 subgroup. Hubble Space Telescope (HST) WFPC2 imaging by Da Costa et al. (1996, 2000, 2002) and related programs were used to explore the presence of gradients in these systems. Harbeck et al. (2001) found that only Andromeda (hereafter And) I and VI in this subgroup show clear evidence for gradients. This agrees with the analyses by Da Costa et al. on the same data, where no radial gradient was detected over the fields sampling And II and III (Da Costa et al. 2000, 2002), whereas a gradient was observed in And I (Da Costa et al. 1996).
McConnachie & Irwin (2006a) (hereafter MI6) have recently presented global wide-field photometry of Andromeda I, II, III, V, VI and VII taken with the Isaac Newton Telescope Wide Field Camera (INT WFC), sampling the top few magnitudes of the RGBs of these systems. By analysing the global stellar structure of these galaxies, they find that And II shows a factor of two excess of stars in the central regions, above that obtained by a simple extrapolation of the outer surface brightness profile to small radii. MI6 suggest that this is evidence showing And II consists of two structural components with distinct spatial distributions, similar to Sculptor and Fornax. If the stellar populations of these components are different, then we might expect radial gradients to be detected in this galaxy as the relative contribution of stars from each component changes. This gradient would probably act on a scale larger than the HST field observed by Da Costa et al. (2000), otherwise it would likely have been detected by this study. The existence of multiple populations in And II would be consistent with the fact that Da Costa et al. (2000) were unable to match the HB morphology of this galaxy using a stellar population with a single age, and implied that populations of multiple ages must be present.
Multi-colour photometry which reaches the HB level can be a key discriminant of structural variations in a dwarf galaxy (eg. Harbeck et al. 2001), and is a particularly powerful tool when the data covers the entire projected area of the dwarf so that a global view is obtained (eg. Tolstoy et al. 2004; Battaglia et al. 2006). In addition, data of this type provides much stronger constraints on the ages, metallicities and SFHs of the stellar populations in the galaxy than can be achieved by analysis of the RGB alone. In this paper, we present deep, global photometry of And II which reaches to below the HB level, obtained as part of a survey of Local Group dwarf galaxies with the Subaru Suprime-Cam wide field camera. We use these data to probe the structures, ages and metallicities of the stellar populations of this dwarf galaxy over its entire spatial extent, to a depth equivalent to the earlier HST-WFPC2 study by Da Costa et al. (2000).
This paper is organised as follows: in Section 2, we introduce the survey, and discuss the targets, observations and data analysis procedure. In Section 3, we present colour – magnitude diagrams (CMDs) for And II, and examine the spatial properties, ages and metallicities of the dominant stellar populations. In Section 4, we discuss the structure and evolution of And II in light of these results. Section 5 summarises. We assume a distance modulus to And II of ( kpc; McConnachie et al. 2004, 2005). The average extinction in the direction of And II is (Schlegel et al. 1998).
2 The Subaru Suprime-Cam Survey
Inevitably, the majority of our detailed information on the stellar content and evolution of dSphs comes from observations of the MW subgroup, although there are several notable exceptions. Environmental effects, such as ram pressure stripping and tidal effects, are thought to play an important role in the evolution of dwarf galaxies (eg. Einasto et al. 1974; Mayer et al. 2001a, b), and so dwarfs which have evolved in different environments could possess very different properties. For example, MI6 have shown that the dSph satellites of M31 are a factor of times more extended than for the MW population, showing that, in at least one respect, results derived from the MW population do not necessarily hold for other Local Group dSphs. Similarly, McConnachie & Irwin (2006b) show that the radial distribution of all of M31’s dwarf satellites is nearly twice as extended as that of the MW population. It is clearly of considerable importance to obtain a complete census of nearby dwarf galaxy properties, but it is only relatively recently that the instrumentation has existed to probe the global stellar content of the more distant dwarf galaxies of the Local Group.
As a follow-up to our INT WFC survey of Local Group dwarf galaxies (McConnachie et al. 2004, 2005, MI6), we have undertaken a deeper, wide-field, multi-colour photometric survey of Local Group dwarf galaxies using the Subaru Suprime-Cam wide-field camera, with the aim of obtaining photometry which reaches below the HB components in each of our targets over their entire spatial extent. Data of this type are generally lacking for the galaxies of the Local Group which are not satellites of the MW, but hold a large amount of information relating to their global structural properties and SFHs. Subaru Suprime-Cam is ideally suited to this task; it is able to reach the HB of Local Group dwarf galaxies located beyond 500 kpc in a reasonable amount of time and, importantly, the large ( arcmins arcmins) field of view is sufficient to cover the entire dwarf galaxy at this distance.
2.1 The survey
During the nights of – August 2005, we obtained Johnson – Cousins and band imaging of the M31 dSph galaxies Andromeda I, II, III, V, VI and VII using Subaru Suprime-Cam (P.I. N. Arimoto). Conditions were uniformly excellent, being photometric throughout and with typical seeing of arcsecs. At the start of the night, we also obtained some multi-colour imaging of the distant transition dwarf galaxy DDO210 and the isolated dSph in Cetus. The observations and results for DDO210 are presented in McConnachie et al. (2006).
For And II, we exposed for a total of seconds in and 4800 seconds in , split as seconds and seconds dithered sub-exposures respectively. The telescope was typically offset arcsecs between sub-exposures. The exposure times were designed to reach below the horizontal branch to an equivalent depth in the and bands. The final stacked images have sub-arcsec seeing over the whole array, averaging arcsec for the -band and arcsec for the V-band. During stacking, the single frame object catalogues were used to improve the positional match with respect to the chosen reference image catalogue by applying an additional constant linear solution after the application of the differential WCS. This improved the WCS solution to approximately one tenth of a pixel precision.
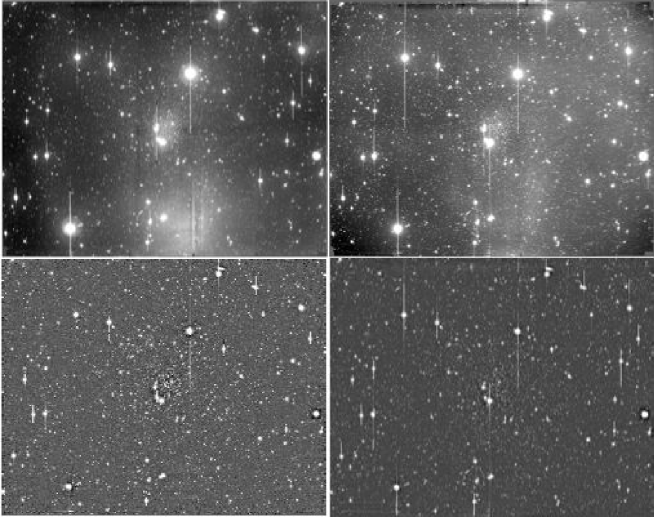
Data were processed using a general purpose pipeline for processing wide-field optical CCD data (Irwin & Lewis 2001). Images were debiased and trimmed, and then flatfielded and gain-corrected to a common internal system using clipped median stacks of nightly twilight flats. In addition, the band images, which suffer from an additive fringing component, were also corrected using a fringe frame computed from the entire series of -band exposures taken during the 3 nights. The top panels of Figure 1 shows the full arcmins arcmins field for our reduced and band Suprime-Cam images of And II. North is at the top, and east is to the left.
The top panels of Figure 1 reveal the presence of scattered light which affects the final stacked images in an unusual way. The light appears to be scattered from bright stars either in, or just off, the field-of-view. This leads to complex, but generally smoothly varying, background light patterns. However, when the component images are stacked in a conventional way the induced scattered light patterns can become disjoint, even after allowing for overall changes in the background during the stacking process. To compensate for this we were forced to remove the smoothly varying background components prior to stacking using a non-linear equivalent of unsharp masking. Although this worked well at removing the disjoint patterns, some of the more rapidly varying spatial components are still visible as low level artifacts (eg. the horizontal striations below the center). The other drawback of unsharp masking is the low level negative halo induced around bright stars; however, this has a negligible effect on the photometry of the overwhelming majority of individual objects. The bottom two panels of Figure 1 show the and band Suprime-Cam images after this correction has been applied.
For each image frame an object catalogue was generated using the object detection and parameterisation procedure discussed in Irwin et al. (2004). Astrometric calibration of the individual frames was based on a simple Zenithal polynomial model derived from linear fits between catalogue pixel-based coordinates and standard astrometric stars derived from on-line APM plate catalogues. The astrometric solution was then used to register the frames prior to creating a deep stacked image in each passband. Object catalogues were then created from these stacked images and objects were morphologically classified as stellar or non-stellar (or noise-like). The detected objects in each passband were then merged by positional coincidence (within arcsec) to form a combined catalogue.
We cross-correlated the Suprime-Cam photometry with our earlier multi-colour INT WFC photometry of And II, for which we know the colour transformations into the Landolt system111http://www.ast.cam.ac.uk/ wfcsur/technical/photom/colours. This ensures our new photometry is on the same systems as our previous photometry. By only considering those objects reliably identified as stellar in all four sets of observations, we find
| (1) |
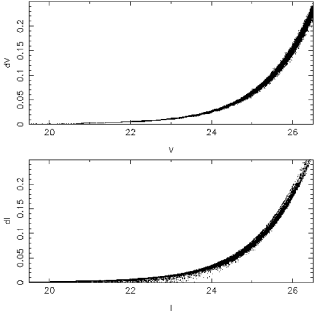
where we now use to denote the original Subaru filter. These transformations are identical to those derived using our data for DDO210 (McConnachie et al. 2006). Figure 2 shows our photometric errors as a function of magnitude for our -band (top panel) and -band (bottom panel) data. Our errors are mags for and . The data start to become incomplete at a signal-to-noise of 10, corresponding to .
3 Stellar Populations and Structure
3.1 Colour-magnitude diagrams
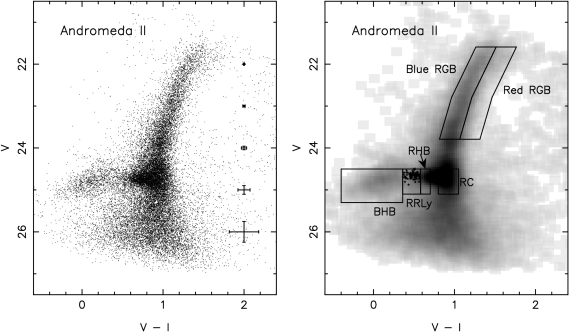
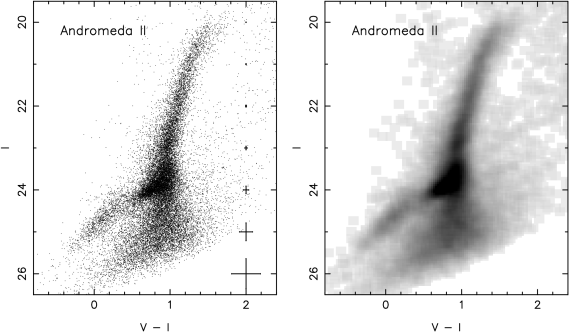
The left panels of Figure 3 show the extinction-corrected CMDs for And II, where each star has had its and magnitude corrected for extinction by cross-correlating the position of the star with the maps of Schlegel et al. (1998). The right panels show the corresponding Hess diagrams with square-root scaling. Also marked on the CMDs are error bars which represent the photometric uncertainties in our data. These data go several magnitudes deeper than our earlier INT WFC imaging in both filters, to a depth comparable to the earlier HST-WFPC2 imaging of Da Costa et al. (2000). Suprime-Cam has a larger field of view than HST-WFPC2; stars are shown in the CMDs in Figure 3, compared to the shown in Figure 5 of Da Costa et al. (2000). A MW foreground sequence is visible in Figure 3 at bright magnitudes, starting at mags. All the other features in the CMD are produced by stellar populations intrinsic to And II. The lack of any obvious bright, main-sequence stars or blue-loop stars suggests that there has not been any recent (last few Gyrs) star formation. Instead, all of the prominent populations (the RGB and core helium burning stars) are signs of intermediate ( Gyrs) and/or old ( Gyrs) ages.
3.1.1 The red giant branch
In the top left panel of Figure 3 we have divided the broad RGB of And II into a ‘blue’ and ‘red’ component. In general, blue RGB stars are likely younger and/or more metal-poor than redder RGB stars, although the unknown effects of the well known age-metallicity degeneracy leads to difficulty in the interpretation of RGB colour. We also note the presence of an overdensity of stars on the RGB at , which is most likely due to a RGB bump.
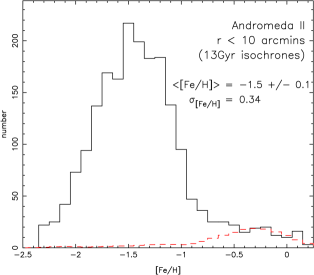
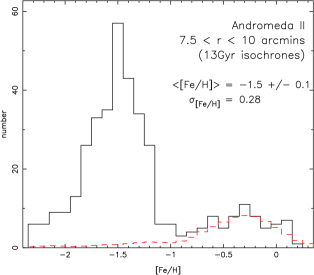
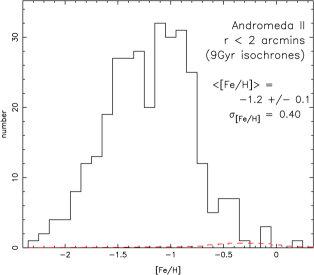
Da Costa et al. (2000) showed that And II has the broadest colour dispersion in its RGB of any of the Local Group dSph galaxies, implying dex for a single, co-eval, ancient population. Côté et al. (1999b) spectroscopically measured a scatter in the metallicity of 50 RGB stars in And II of dex, virtually identical to the photometric measurement. Figure 4 shows a metallicity distribution function (MDF) for arcmins derived from our data, where we have calculated the metallicity of each star in the top two magnitudes of the RGB by interpolating its position in colour-magnitude space between Gyr isochrones with a range of metallicities (assuming zero enhancement). Our technique is standard, and uses the Victoria-Regina set of isochrones from VandenBerg et al. (2006) with colour- relations as described by VandenBerg & Clem (2003). The dashed histogram shows the MDF for RGB stars at arcmins, scaled by area, which will be dominated by foreground stars and which we use as a reference field. Since these stars are predominantly foreground dwarfs in the Milky Way halo, the metallicities which we calculate are physically meaningless, and useful only as a comparison to the main MDF.
The mean metallicity of RGB stars under our age assumption is [Fe/H] . The dispersion in metallicity is dex, in excellent agreement with Da Costa et al. (2000) and Côté et al. (1999b), demonstrating good consistency with these earlier studies. We note, however, that the mean metallicity and dispersion are sensitive to our age assumption, reflecting the age-metallicity degeneracy in the colour of the RGB discussed above. If the stellar populations of And II are younger than 13 Gyrs, or if a range in age is present, then the metallicity estimates we derive will be misleading. Later, we show that this is nearly certainly the case for And II.
3.1.2 The core helium burning stars
Horizontal branch stars (low mass, core helium burning) are only present in old stellar populations. The presence of blue HB stars and RR Lyrae variables in particular are an unambiguous sign of the presence of a population which is at least as old as the MW globular clusters ( Gyrs). The CMDs in Figure 3 clearly show the presence of a HB at which extends far to the blue. The boundary between blue and red HB stars is marked by the instability strip: at the HB level, this is marked by the mean colours of RR Lyrae variable stars.
The Subaru Suprime-Cam data is unsuitable for the identification of RR Lyraes. However, Da Costa et al. (2000) identify over 70 RR Lyrae variables in their HST-WFPC2 dataset, which are analysed in detail in Pritzl et al. (2004), and who give the and magnitudes for these stars. To compare the position of this RR Lyrae locus with our data requires the calculation of the colour transformation between for the HST-WFPC2 data and for the Suprime-Cam data. To this end, we have cross-correlated the HST-WFPC2 dataset with the Suprime-Cam data and identified common objects by positional coincidence within 1 arcsec. We apply the additional constraint that the photometric uncertainties in the ground-based data should be less than magnitudes in each filter. We then determine the relation between and , and find it is well fit by the linear relation
| (2) |
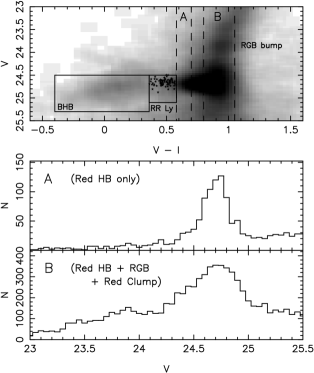
The star symbols in the top right panel of Figure 3 show the locus of the RR Lyrae stars identified in the earlier HST-WFPC2 study. The rectangle surrounding these points shows the colour-magnitude cuts we use to approximate the position of this locus. The large rectangle immediately to the blue of this defines the colour-magnitude cuts used to isolate the blue HB. Likewise, the red HB will lie immediately to the red of the RR Lyrae locus. However, the structure of the CMD in this region is quite complex.
The top panel of Figure 5 shows an enlarged version of the band Hess diagram at the level of the HB. The RR Lyrae and blue HB are marked as before. To the red of the RR Lyrae locus, a significant overdensity of stars is present. Some of these will clearly be red HB stars; however, the width of this overdensity increases significantly towards the red. To illustrate this, in the middle panel we have plotted the luminosity function of stars in a strip in colour space immediately redder than the RR Lyrae locus (A) and compared this to the luminosity function of stars in another strip which is even redder (B) in the bottom panel. Strip A is likely to only sample red HB stars; however, strip B additionally sample a significant number of RGB stars, and will also sample red clump stars, if present. This latter stellar population are also core helium burning stars, but they have a significantly higher mass than their low mass, HB counterparts. Their presence would therefore imply the existence of an intermediate-age stellar population (see Girardi & Salaris 2001 for a comprehensive theoretical study of the red clump).
The peak of the luminosity functions in Figure 5 correspond to core helium burning stars in And II; however, the peaks clearly have vastly different dispersions and shapes. Therefore, either the spread in the luminosity of red HB stars varies dramatically as a function of colour, or the broader peak in B is due to the presence of an additional stellar population with similar luminosities and colours to the HB. We are unaware of a physical mechanism which could cause the former to occur. On the other hand, Da Costa et al. (2000) independently implied that And II had to possess an intermediate-age population (of age Gyrs) in order to explain the overall HB morphology of And II as revealed by their HST-WFPC2 data. Such a population would be expected to possess a red clump. Therefore, we conclude that the morphology of the region of the CMD shown in Figure 5 is best and most naturally explained by the presence of a red clump population in this galaxy. This is the first detection of a red clump in any of the M31 dSphs, which are often characterised as having no significant intermediate age populations. Colour-magnitude cuts to define the red HB locus and red clump locus are shown in the top-right panel of Figure 3 (the red clump locus will also contain significant contributions from red HB and RGB stars). We will examine the luminosity and colours of all the core helium burning stars in more detail in Section 3.5.
3.2 Radial gradients

3.2.1 The red-to-blue horizontal branch profile
Da Costa et al. (2000) and Harbeck et al. (2001) looked for population gradients in And II by examining the change in the number of blue HB stars to the total number of (blue + red) HB stars over the radial extent of the HST-WFPC2 field. Both papers concluded that no significant radial variation in this quantity was present in their data.
Using our colour cuts to define blue and red HB stars, we have calculated an analogous quantity to Da Costa et al. (2000), (the ratio of the number of red HB stars to the number of blue HB stars) as a function of radius. The radial extent of And II probed by our data is significantly larger than that probed by the HST-WFPC2 data, and so should display any large-scale variations in this ratio if they are present. We count stars in annuli of width 1 arcmin centered on And II, and display our results in the top panel of Figure 6. remains approximately flat, with no significant deviation from the mean value, out to 13 arcmins from the center of And II. This implies that all of the obviously old stellar populations in And II have very similar radial distributions, and is in agreement with the earlier studies.
3.2.2 The red clump to horizontal branch profile
We now define an analogous quantity to , (the ratio of the number of red clump stars to the number of all HB stars). This will probe the relative contribution of low-to-high mass helium burning stars in And II as a function of radius.
The profile of is shown in the bottom panel of Figure 6. In contrast to the ratio of red to blue HB stars, the ratio of red clump to HB stars declines significantly and continually as a function of radius by nearly a factor of 6 over a 13 arcmin radial range. Clearly, the low and high mass helium burning stars in And II have very different radial distributions, such that the red clump stars are more centrally concentrated than the HB stars. This then implies that the intermediate age stellar populations in And II are significantly more centrally concentrated than the old stellar populations. And II clearly possesses a very strong radial gradient in its stellar populations.
3.3 Spatial distributions

Figure 7 shows maps of the spatial distribution of stellar sources satisfying various colour-magnitude cuts in And II, projected into the tangent plane of this galaxy. The top panels of Figure 7 show the spatial distribution of all stars in And II brighter than our incompleteness limits. And II is a very large, extended spheroid of stars with a slight ellipticity of (MI6). Foreground stars will dominant in the outer parts of the Suprime-Cam field, but the tidal extent of And II is sufficiently large ( arcmins; MI6) that some of its stars will be present at all radii probed.
The remaining five panels in Figure 7 correspond to stars in the stellar loci indicated in Figure 3. Given the tight colour-magnitude cuts used to isolate each population, the contamination from foreground stars in these panels is generally small. Some of the irregularity of the stellar distributions can be traced back to the presence of saturated stars in the field, which can cause holes to appear in the spatial distributions; for example, near the center of the red and blue HB distributions.
The red and blue HB both have extended, diffuse stellar distributions which do not obviously increase in density at small radius, as is common for spheroidal profiles. In comparison, the red clump and blue RGB populations are approximately as extended as the HB distributions, but are much more centrally concentrated. This naturally explains the gradient observed in Section 3.2.2. The red RGB, on the other hand, is far less extended than all the other stellar distributions, and is concentrated in the central regions of And II. The contrast between the HB distribution and the red RGB distribution is striking.
3.4 Radial profiles
We robustly quantify the spatial distribution of the stellar populations shown in Figure 7 by constructing radial profiles for each population. We count stars in elliptical annuli with the average ellipticity and position angle of And II (; MI6). While the maps in Figure 7 show that these quantities change for And II depending upon the stellar population examined, adopting annuli of fixed shape and orientation for all the populations allows for a more robust and meaningful comparison between the resulting profiles.
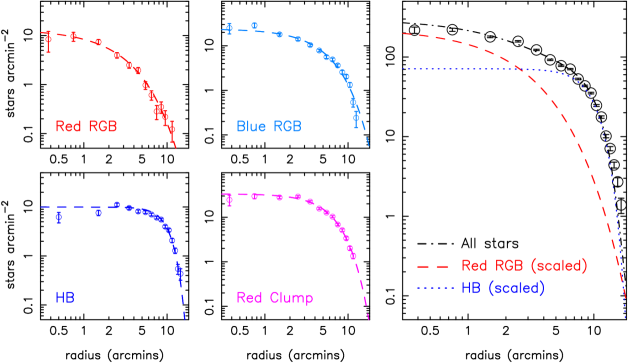
The radial profiles for the individual stellar populations are shown in the left and center panels of Figure 8 in log-log space. The HB profile consists of the blue HB, RR Lyrae and red HB stellar loci, since these have been shown to possess similar distributions. The radial profile for all stars above the completeness limit of our data is shown in the right panel of Figure 8.
A foreground correction has been applied to the overall profile by comparison with the (foreground-corrected) radial profile in MI6. We have assumed that the core and tidal radii of the best-fitting King model derived by MI6 should also fit the outer regions of our Suprime-Cam data. Our free parameters in this fit are a vertical scale factor and a constant representing the foreground contamination in the Suprime-Cam data. The best-fit value of the latter can then be subtracted from the Suprime-Cam profile. Although no foreground correction has been applied to the profiles for the individual populations, the tight colour-magnitude cuts which define these populations ensure that the foreground contamination is minimal.
Since the radial profiles in the left and center panels of Figure 8 show significant differences, we choose the flexible Sersic profile to parameterise them all. The projected density of this distribution function is given by
| (3) |
is a shape parameter ( corresponds to an exponential profile and corresponds to a de Vaucouleurs profile) and is a scale-radius. is a normalisation constant and is equivalent to the central surface brightness. The best-fit Sersic profiles to the radial profiles of the individual stellar populations are shown as dashed lines in the left and center panels of Figure 8. For each population, we find the following best-fit parameters:
-
•
Red clump: ,
-
•
Blue RGB: ,
-
•
Red RGB: ,
-
•
HB: ,
The red clump and blue RGB are the most similar out of these 4 profiles, although even these are statistically different from each other. The red clump profile has a slightly more steeply declining profile than the blue RGB, and a slightly larger scale length. Both these profiles are very distinct from the red RGB profile, which has an essentially exponential () profile with a scale length of only arcmins ( pc). This is much more similar to the typical overall radial profile of dSph galaxies in the Local Group (Irwin & Hatzidimitriou 1995, MI6). We note with interest that the exponential scale length of this population is a factor of larger than the exponential scale length of the overall radial profiles of most of the MW dSph population (Irwin & Hatzidimitriou 1995).
The radial profile of the HB component is very unusual. The slight decline in the stellar density of this component at small radii is an artifact of the few saturated stars in this region which produce holes in the spatial maps in Figure 7. The scale radius of the HB profile is not well constrained, due to the unusual, nearly constant density shape of the profile. The value of the power-law index, produces a very steeply declining profile at large radius. Thus, the HB population has an approximately constant density profile out to large radius before it essentially truncates.
Although the radial profiles of the red RGB and HB can both be described by Sersic profiles, the two bear no similarity to each other at all, as even a cursory glance of Figure 8 makes clear. A K-S test on the red RGB and HB cumulative radial profiles shows that the two are absolutely inconsistent with being drawn from the same underlying distribution at extremely high significance ().
Given that the red RGB has an exponential profile, and the HB has a constant density profile, it is very likely that the two must have very different dynamical properties. For example, if they are both in equilibrium with the overall potential of the dSph, then they cannot both have the same kinematic properties (velocity dispersion profile, orbital anisotropy etc) and have such vastly different density profiles. This is because they will not both satisfy Jeans equation, which requires a balance between the overall potential, the density distribution of the tracer population and the kinematic properties of the tracer population. On the other hand, if one or both of the populations is not in equilibrium, then there is no reason to expect that they will have similar kinematics in the first place. It is very likely therefore that the red RGB population and the HB population belong to two kinematically distinct components in And II.
Compelling evidence for this interpretation comes from the overall radial profile displayed in the right panel of Figure 8. The dot-dashed line is the best-fit to the data obtained on fitting a weighted sum of the HB and red RGB profiles, that is the function
| (4) |
where and are the best fitting Sersic profiles to the HB and red RGB populations found previously, and and are scaling constants found through a least-squares fit to the overall profile. If, as we postulate, the HB and red RGB populations trace two distinct components in And II, then the sum of the radial profiles of these components must equal the overall radial profile of And II.
The dot-dashed line in the right panel of Figure 8 is a remarkably good fit to the overall profile of And II. The only slight deviation of this line from the data is at large radius, where we are particularly sensitive to the foreground correction we applied (which was not measured directly from our data). Therefore, this deviation seems small as it is only of order star arcmin-2, and the fit is good over 2.5 dex in stellar density.
The individual, weighted Sersic profiles of the HB and red RGB populations, and respectively, are shown in the right panel of Figure 8 as dotted and dashed lines respectively. Inside of 2 – 3 arcmins, the exponential component traced by the red RGB stars dominates, whereas outside of this radius the extended component traced by HB stars begins to dominate. This naturally explains the peculiar profile for And II measured by MI6, where a factor of two excess of stars was seen at arcmins upon the extrapolation of the best-fitting density profile at large radius to small radius: at large radius, the extended component dominates, whereas at small radius an additional component contributes to the density profile, and dominates over the extended component. In Section 3.5, we present additional evidence in the ages and metallicities of the stellar populations of And II which supports the presence of two distinct components. We note that the blue RGB and red clump profiles are also able to be approximated by a weighted sum of the red RGB and HB profiles, as is required in this model.
The absolute magnitude of And II obtained by MI6 upon integrating the surface brightness profile is . By using the best-fit values of and , it is straightforward to calculate the expected luminosities of the two postulated components. We find that the extended component contributes of the light in And II, while the exponential component will contribute of the light. This translates into magnitudes of and for the extended and concentrated components, respectively. The corresponding central surface brightnesses are and mags arcsec-2, respectively, where the total central surface brightness of And II has been taken to be mags arcsec-2 (MI6).
Table 1 lists the above parameters for And II, along with error estimates. The uncertainties in and are obtained by propagating the uncertainties in the absolute magnitude of And II, and . They are likely to be underestimates of the true uncertainties, since the adopted profiles of each component also have considerable uncertainties associated with them. Nevertheless, these values illustrate the approximate contribution of each component to the overall composition of And II.
3.5 The ages and metallicities of Andromeda II
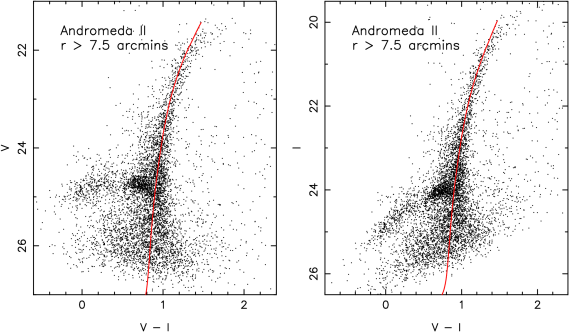
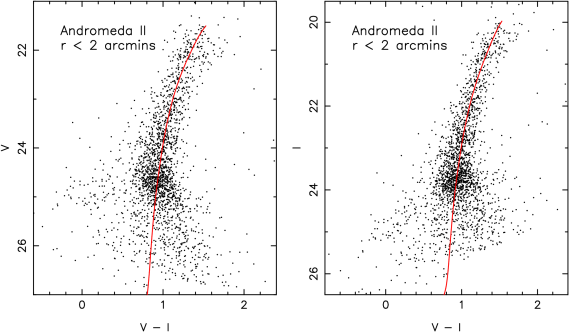
The analysis in Section 3.4 suggests that different stellar components with different characteristic stellar populations dominate And II at small and large radius. To investigate this possibility further, we show in Figure 9 the extinction corrected CMDs of And II split by radius. The top panels show the And II CMDs for stars with arcmins. According to the fits in Section 3.4, the exponential component dominates the extended component by a factor of approximately 2:1 inside this radius. The bottom panels of Figure 9 show the And II CMDs for stars with arcmins. The extended component is expected to dominate the concentrated component by a factor of approximately 8:1 over this radial range. To aid visual comparison, a 13 Gyr isochrone with [Fe/H] from the Victoria - Regina set of isochrones, shifted to the distance modulus of And II, has been overlaid. The difference in the stellar populations divided by radius is striking, particularly regarding the width of the RGB and the morphology of the HB/red clump level. Each of these features contains information regarding the average ages and metallicities of the dominant stellar populations at these radii.
3.5.1 Populations at large radii
The large majority of stars in the top panels of Figure 9 are expected to belong to the spatially extended stellar component. A blue HB population occupying the same colour-magnitude locus as defined earlier is clearly visible in these panels. These stars unambiguously determine the age of this population to be as old as the MW globular clusters ( Gyrs).
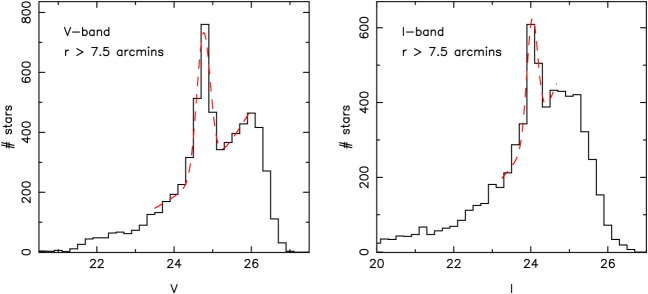
Additionally information on the average age and metallicity come from the colour and magnitude of the core helium burning stars. Girardi & Salaris (2001) show that the mean -band magnitude of core helium burning stars is primarily dependent on age, whereas the mean colour is primarily dependent on metallicity. While their study is focused towards understanding the evolution of red clump stars, the results they provide extend to old (low mass) helium burning stars as well. The top panels of Figure 10 show the extinction-corrected - and -band luminosity functions of all stars in And II with arcmins. The peak of stars in both panels is due to the HB. The dot-dashed lines correspond to the best fits of a Gaussian (which models the luminosity profile of the HB ) and a power law (which models the slope of the RGB in this region). The peak magnitude of the Gaussians are the mean magnitudes of the HB stars. We find and , with corresponding dispersions of and . This implies , , and . The uncertainties in the magnitudes are dominated by the uncertainty in the distance modulus of And II.
The relationships derived by Girardi & Salaris (2001) between the colour, magnitude, age and metallicity of core helium burning stars are shown in their Figure 1. By comparing this with our observed values for the luminosity and colour of the HB stars we find that either these stars belong to a very young, comparatively metal-rich population ( Gyrs, [Fe/H] ), or they belong to a very old, metal-poor population (Gyrs, ). However, the blue HB stars show that this population must be old, favouring the more metal-poor estimate.
A final constraint can be placed on the metallicity of the stars in this radial range by constructing a MDF from interpolation of the position of stars on the RGB. We use exactly the same technique as before, adopting 13 Gyr isochrones for the interpolation procedure to ensure consistency with the HB age information. The result is shown in the left panel of Figure 11 (for stars with arcmins). Also shown in this panel as a dashed histogram is the MDF for stars with arcmins, which is dominated by foreground stars. Clearly, the influence of foreground contamination on this MDF is minimal. The implied median metallicity of the (foreground corrected) MDF is [Fe/H] , with a dispersion of dex. The mean metallicity is the same as we derived in Section 3.1.1, although the MDF for stars at large radii is notably narrower than the overall MDF for And II (Figure 4). The excellent agreement between the age and metallicity estimates from the HB and the metallicity estimate of the RGB demonstrates good consistency in our analysis.
3.5.2 Populations at small radii
The bottom panels of Figure 9 show the CMDs for the inner few arcminutes of And II, which we expect is dominated by the exponential stellar component. However, approximately one-third of the stars are expected to belong to the spatially extended component. The RGB in this radial range is extremely broad, and the morphology of the HB/red clump is very different to any of the CMDs examined previously. Some stars occupy the locus of the blue HB defined earlier: we count a total of such stars. However, our earlier analysis of the radial profiles shows that the expected number density of HB stars at this radii is stars arcmin-2 (Figure 8), or a total of HB stars in the area probed by these CMDs. Of these, are expected to be blue HB stars. We concluded earlier that the HB stars traced an extended component; the expected contribution of blue HB stars from the extended component at arcmins is therefore , which is consistent with the number we actually observe. We cannot rule out the possibility that the exponential component has a very weak blue HB, but this cannot contribute more than of the total number of blue HB stars in And II.
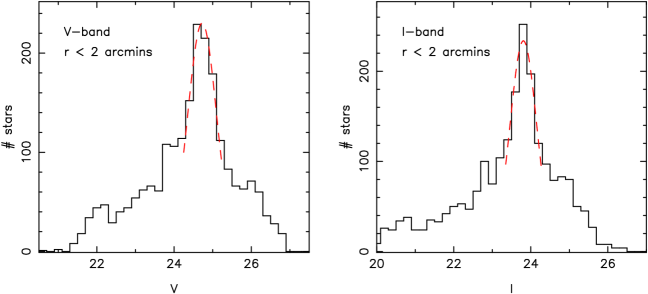
The lower panels of Figure 10 show the extinction-corrected luminosity functions for stars with arcmins. The dashed lines show the best-fit Gaussians to the red clump/HB peaks. The mean magnitudes of the core helium burning locus are and , with dispersions of and . These correspond to , and . By comparing the colour with Figure 1 of Girardi & Salaris (2001), we imply a mean metallicity of [Fe/H] and a mean stellar age of Gyrs, with a plausible range given the uncertainties of Gyrs. The mean -band magnitude of the red clump is notably brighter than the mean HB luminosity measured previously, implying a stellar population that is significantly younger by at least 3 or so Gyrs. This finding is in good agreement with Da Costa et al. (2000), who implied that there was a younger population in And II and that its age was probably in the range Gyrs.
We derive an MDF for the inner regions in the same way as before, except we now use isochrones which are 9 Gyrs old to agree with the red clump age estimate. The MDF is shown in the right panel of Figure 11, and the dashed histogram shows the corresponding MDF for the foreground population scaled by area. The median metallicity is [Fe/H] , with a very broad dispersion of dex. Clearly, the broad metallicity dispersion for And II measured by Da Costa et al. (2000) and Côté et al. (1999b) reflects the large dispersion present in the central regions of this galaxy, and which is not found at large radius.
3.5.3 MDFs of the two components
In our two component picture of And II, the MDFs shown in the left and right panels of Figure 11 are expected to predominantly sample the spatially extended and exponential components, respectively. However, neither will give a clean sample of that component.
To derive the intrinsic MDFs for the extended and exponential components, we note that any MDF which samples some radial range of And II will be a weighted sum of the two intrinsic MDFs, and , such that
| (5) |
where is the ratio of the number of stars in component A to component B, and is found by integrating the radial profiles of the two components in the appropriate radial ranges. If we produce two MDFs (using the same age assumption) for two different radial ranges in And II, then we can solve these equations to find and (for that age assumption).
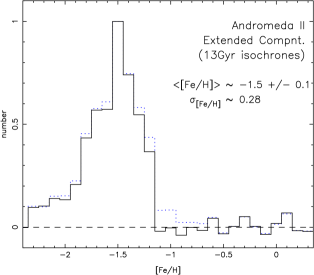
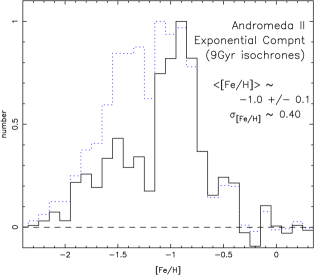
Figure 12 shows the intrinsic MDFs for the spatially extended component (left panel) and the exponential component (right panel) using this technique (under the age assumptions derived earlier). The dashed histograms show the MDFs for the outer and inner regions calculated previously. The MDF for the extended component is unsurprisingly very similar to the MDF for the outer regions, given the complete dominance of this component at large radius. On the other hand, the MDF for the exponential component is significantly different to the MDF for the inner regions given the non-negligible contribution of the extended component in this radial range. The MDF for the exponential component implies a mean metallicity of [Fe/H] , in reasonable agreement with the estimate from the colour of the red clump. Despite being significantly metal-rich, this component nevertheless appears to possess a large tail to very low metallicity. Interpretation of this feature is difficult, however, since age-metallicity degeneracies will undoubtedly have an effect, and the age of this component means that there could be contributions from Asymptotic Giant Branch stars masquerading as bluer RGB stars.
We conclude that, in the two component model of And II, the spatially extended component is old ( Gyrs), has a mean metallicity of [Fe/H] , and a dispersion of dex. The exponential component, on the other hand, is younger ( Gyrs) and more metal-rich ([Fe/H] ) with what appears to be a significant tail to low metallicities.
4 Discussion
| Old | Intermediate age | |
|---|---|---|
| ANDROMEDA II | (extended) | (concentrated) |
| (arcmins) | ||
| (pc) | ||
| light | ||
| () | ||
| (mags arcsec-2) | ||
| (Gyrs) | Gyrs | Gyrs |
| dex | dex |
4.1 Two components versus smoothly varying gradients
And II is a complex dwarf galaxy, both in terms of its structure and its SFH. The inner region of the galaxy possesses very different stellar populations to the outer region. Radial gradients in the stellar populations of dwarf galaxies have been observed many times before, most notably by Harbeck et al. (2001). Radial gradients can be produced due to the presence of two or more dynamically distinct stellar components with different stellar populations. In this scenario, the gradient arises as a result of the changing contributions of the two components as a function of radius. Alternatively, gradients could arise within a single dynamical component. For example, a centrally concentrated, chemically homogeneous gas cloud will form stars everywhere; however, more stars will be formed in the higher density central regions, which will enrich the central parts of the cloud more than the outer parts. Subsequent generations of stars at the center of the cloud will therefore form out of more enriched gas than stars in the outer parts, and so will evolve to occupy different loci in the colour-magnitude diagram after a fixed time, thereby producing a gradient in the stellar populations.
For the specific case of the population gradients in And II, we strongly favor the first scenario of multiple dynamical components. Compelling evidence in favour of this interpretation comes from the radial profiles shown in Figure 8. The radial distributions of the red RGB and HB populations are dramatically different, and effectively possess different functional forms; the former is an exponential profile, whereas the latter is constant density out to large radius. It is very unlikely that two populations with such disparate spatial distributions could have formed out of the same gas cloud and still possess the same kinematics. If both populations are in equilibrium with the dSph then they cannot both have the same kinematic properties while possessing such vastly different density profiles and still satisfy Jeans equation. If instead we argue that one or both of the populations is not in equilibrium, then we have no reason to expect the two populations will have the same kinematics.
In addition to these considerations, if we adopt the assumption that And II consists of two distinct components then the overall radial profile of And II must equal the sum of the radial profiles of its two components. We find that a weighted sum of the HB and red RGB profiles fits the overall radial profile of And II very well. We also find that the radius at which the central component begins to dominate is coincident with the radius at which MI6 noticed their profile for And II deviated significantly from a single component fit. In the Suprime-Cam data, the stellar populations inside this radius are very different to the populations at larger radii, and have different metallicities and mean ages. Given all of these factor, we conclude that the change in the stellar populations of And II as a function of radius is due to the presence of two, dynamically distinct, stellar components with distinct stellar populations.
Table 1 presents a summary of the main properties we derive for the two components in And II. Da Costa et al. (2000) first showed that the chemical abundance distribution of And II could not be explained by a single component simple chemical enrichment model and instead required two contributing populations of different ages. The metal-poor population had a mean metallicity of and the metal-rich population had . The former outnumbered the latter by . The metallicity estimates we derive for the two components in And II agree well with the values implied by Da Costa et al. (2000); in addition, we calculate the ratio of the metal-poor population to the metal-rich population to be (assuming equal mass-to-light ratios), in good agreement with their model. We also find that the younger, more metal-rich population possesses a red clump; this is the first time this feature has been observed in a M31 dSph companion. The M31 dSphs are often characterised as having no significant intermediate age populations; we stress that these earlier results for And II and our own discovery of a red clump highlight that this characterisation is probably inadequate.
4.2 Andromeda II and the Local Group dwarf spheroidals
Tolstoy et al. (2004) were the first to show convincingly that the Sculptor dSph consisted of two, spatially, chemically and dynamically distinct populations. This is contrary to the prevailing treatment of dSph galaxies as single stellar component systems supported by velocity dispersion, embedded within a dark matter halo. Subsequently, Battaglia et al. (2006) have shown that the Fornax dSph consists of three dynamically distinct populations of stars, and Ibata et al. (2006) have shown the presence of similarly distinct populations in Canes Venatici. However, equivalent studies of Leo I (Koch et al. 2007b), Leo II (Koch et al. 2007a) and Carina (Koch et al. 2006) have not revealed any dynamically distinct stellar populations in these galaxies. In all cases where dynamically distinct components and/or radial gradients have been observed, the comparatively metal-rich component is shown to be more centrally concentrated than the metal-poor component.
And II appears to bear some resemblance to Sculptor and Fornax. In all these galaxies, the more concentrated populations are younger than the more extended populations. Kawata et al. (2006) examine the evolution of the baryonic component of dwarf galaxies in a cosmological simulation and show that they can reproduce this general feature as a result of multiple episodes of star formation: later episodes of star formation are spatially less extended than earlier episodes due to the dissipative collapse of the gas component. In this model, the populations form in situ, although this does not prevent the gas which formed the younger populations from being recently accreted.
In contrast, Battaglia et al. (2006) present tentative evidence for non-equilibrium kinematics in the most extended (oldest) stellar component in Fornax. This might suggest that its formation was driven by mergers, perhaps by accreting an old dwarf galaxy or even a globular cluster which was subsequently destroyed in the tidal field of Fornax (see Coleman et al. 2004; Coleman & Da Costa 2005 for tentative evidence of past mergers in Fornax). Ibata et al. (2006) also tentatively propose that the two components in Canes Venatici are not in equilibrium with the same dark matter halo.
Other than an overall velocity dispersion for And II based on 7 stars (Côté et al. 1999a), high quality global kinematics for And II are lacking. It is tempting, however, to speculate on the origin of the bizarre density profile of the extended component of And II. This component is effectively constant density out to large radius ( arcmins kpc) before truncating. This has not been observed in any other dwarf galaxy to date and is in contrast to the usual King, exponential, Plummer etc profiles of dwarf galaxies. Interestingly, numerical simulations of the tidal disruption of dwarf galaxies in MW-like potentials show some evidence of producing debris which is distributed roughly evenly with radius (eg. Figure 3 of Peñarrubia et al. 2006). Scaled down to dwarf galaxy potentials, the same physics may be responsible here; that is, the stars in the extended component of And II may be the debris from the accretion and eventual destruction of an old stellar system in the potential of And II. Thus perhaps this component is a relic of the hierarchical formation of And II.
While intriguing, detailed simulations of the tidal destruction of stellar systems in the potential of a dwarf galaxy do not yet exist to study the above proposal in any detail. Indeed, a strong argument against this scenario is that the extended component of And II is the oldest component and contributes the majority of the light. As such, we would expect it to be the main body of And II and not accreted debris. The exponential component formed later, perhaps through a mechanism similar to that proposed by Kawata et al. (2006). While this does seem the most natural explanation, we are forced to address the question of why the original body of And II has such an unusual and unique density profile. This is a fascinating question, and one which we are currently unable to answer.
5 Summary
We have used Subaru Suprime-Cam to obtain multi-colour imaging of the M31 dSph And II to a depth equivalent to earlier HST-WFPC2 studies but over an area 100 times larger. We identify various stellar populations, including a red clump. This is the first time this feature has been detected in a M31 dSph, which are often characterized as having no significant intermediate age populations. In the case of And II, this characterization is incorrect.
We construct radial profiles for the various stellar populations and show that the HB has a nearly constant density spatial distribution out to large radius, whereas the reddest RGB stars are centrally concentrated in an exponential profile. We argue that these populations trace two distinct structural components in And II, and show that this assumption provides a good match to the overall radial profile of this galaxy. We go on to demonstrate that the two components have very different stellar populations; the exponential component has an average age of Gyrs old, is relatively metal-rich ([Fe/H] ) with a significant tail to low metallicity, and possesses a red clump. The extended component, on the other hand, is ancient, metal-poor ([Fe/H] ) with a narrower dispersion , and has a well developed blue HB.
The extended component contains approximately three-quarters of the light of And II. Its unusual surface brightness profile is unique in Local Group dwarf galaxies, and implies that its formation and/or evolution may have been quite different to most other dSphs. The two component structure, however, is also observed in Fornax and Sculptor, and it may be that the centrally concentrated exponential component formed in the way envisioned by Kawata et al. (2006) through the dissipative collapse of gas after the main component had formed. The chemo-dynamical structure of And II is clearly very complex and warrants spectroscopic studies of its metallicity and kinematic properties. It lends yet further support to the accumulating body of evidence which suggests that the evolutionary histories of faint dSph galaxies can be as every bit as complicated as their brighter and more massive counterparts.
Acknowledgements
We thank Gary Da Costa for sharing his HST-WFPC2 data with us and his assistance in cross correlating it with these Subaru data, and the anonymous referee for many suggestions which lead to a significant improvement in this paper. AWM thanks Jorge Peñarrubia, Julio Navarro, Kim Venn and Don VandenBerg for useful and enjoyable conversations during the preparation of this paper, and S. Ellison and J. Navarro for financial assistance. AWM is supported by a Research Fellowship from the Royal Commission for the Exhibition of 1851. This work is partly supported by a Grant-in-Aid for Science Research (No.16540223) by the Japanese Ministry of Education, Culture, Sports, Science and Technology.
References
- Battaglia et al. (2006) Battaglia, G., Tolstoy, E., Helmi, A., Irwin, M. J., Letarte, B., Jablonka, P., Hill, V., Venn, K. A., Shetrone, M. D., Arimoto, N., Primas, F., Kaufer, A., Francois, P., Szeifert, T., Abel, T., & Sadakane, K. 2006, A&A, 459, 423
- Côté et al. (1999a) Côté, P., Mateo, M., Olszewski, E. W., & Cook, K. H. 1999a, ApJ, 526, 147
- Côté et al. (1999b) Côté, P., Oke, J. B., & Cohen, J. G. 1999b, AJ, 118, 1645
- Coleman et al. (2004) Coleman, M., Da Costa, G. S., Bland-Hawthorn, J., Martínez-Delgado, D., Freeman, K. C., & Malin, D. 2004, AJ, 127, 832
- Coleman & Da Costa (2005) Coleman, M. G. & Da Costa, G. S. 2005, Publications of the Astronomical Society of Australia, 22, 162
- Da Costa et al. (2002) Da Costa, G. S., Armandroff, T. E., & Caldwell, N. 2002, AJ, 124, 332
- Da Costa et al. (1996) Da Costa, G. S., Armandroff, T. E., Caldwell, N., & Seitzer, P. 1996, AJ, 112, 2576
- Da Costa et al. (2000) —. 2000, AJ, 119, 705
- Einasto et al. (1974) Einasto, J., Saar, E., Kaasik, A., & Chernin, A. D. 1974, Nature, 252, 111
- Girardi & Salaris (2001) Girardi, L. & Salaris, M. 2001, MNRAS, 323, 109
- Grebel (1997) Grebel, E. K. 1997, in Reviews in Modern Astronomy, ed. R. E. Schielicke, 29–60
- Harbeck et al. (2001) Harbeck, D., Grebel, E. K., Holtzman, J., Guhathakurta, P., Brandner, W., Geisler, D., Sarajedini, A., Dolphin, A., Hurley-Keller, D., & Mateo, M. 2001, AJ, 122, 3092
- Ibata et al. (2006) Ibata, R., Chapman, S., Irwin, M., Lewis, G., & Martin, N. 2006, MNRAS, 373, L70
- Irwin & Hatzidimitriou (1995) Irwin, M. & Hatzidimitriou, D. 1995, MNRAS, 277, 1354
- Irwin & Lewis (2001) Irwin, M. & Lewis, J. 2001, New Astronomy Review, 45, 105
- Irwin et al. (2004) Irwin, M. J., Lewis, J., Hodgkin, S., Bunclark, P., Evans, D., McMahon, R., Emerson, J. P., Stewart, M., & Beard, S. 2004, in Ground-based Telescopes. Edited by Oschmann, Jacobus M., Jr. Proceedings of the SPIE, Volume 5493, pp. 411-422 (2004)., 411–422
- Kawata et al. (2006) Kawata, D., Arimoto, N., Cen, R., & Gibson, B. K. 2006, ApJ, 641, 785
- Koch et al. (2007a) Koch, A., Grebel, E. K., Kleyna, J. T., Wilkinson, M. I., Harbeck, D. R., Gilmore, G. F., Wyse, R. F. G., & Evans, N. W. 2007a, AJ, 133, 270
- Koch et al. (2006) Koch, A., Grebel, E. K., Wyse, R. F. G., Kleyna, J. T., Wilkinson, M. I., Harbeck, D. R., Gilmore, G. F., & Evans, N. W. 2006, AJ, 131, 895
- Koch et al. (2007b) Koch, A., Wilkinson, M. I., Kleyna, J. T., Gilmore, G. F., Grebel, E. K., Mackey, A. D., Evans, N. W., & Wyse, R. F. G. 2007b, ApJ, 657, 241
- Mateo (1998) Mateo, M. L. 1998, ARA&A, 36, 435
- Mayer et al. (2001a) Mayer, L., Governato, F., Colpi, M., Moore, B., Quinn, T., Wadsley, J., Stadel, J., & Lake, G. 2001a, ApJ, 559, 754
- Mayer et al. (2001b) —. 2001b, ApJ, 547, L123
- McConnachie et al. (2006) McConnachie, A. W., Arimoto, N., Irwin, M., & Tolstoy, E. 2006, MNRAS, 373, 715
- McConnachie & Irwin (2006a) McConnachie, A. W. & Irwin, M. J. 2006a, MNRAS, 365, 1263
- McConnachie & Irwin (2006b) —. 2006b, MNRAS, 365, 902
- McConnachie et al. (2004) McConnachie, A. W., Irwin, M. J., Ferguson, A. M. N., Ibata, R. A., Lewis, G. F., & Tanvir, N. 2004, MNRAS, 350, 243
- McConnachie et al. (2005) —. 2005, MNRAS, 356, 979
- Peñarrubia et al. (2006) Peñarrubia, J., McConnachie, A., & Babul, A. 2006, ApJ, 650, L33
- Pritzl et al. (2004) Pritzl, B. J., Armandroff, T. E., Jacoby, G. H., & Da Costa, G. S. 2004, AJ, 127, 318
- Schlegel et al. (1998) Schlegel, D. J., Finkbeiner, D. P., & Davis, M. 1998, ApJ, 500, 525
- Skillman (2005) Skillman, E. D. 2005, New Astronomy Review, 49, 453
- Tolstoy et al. (2004) Tolstoy, E., Irwin, M. J., Helmi, A., Battaglia, G., Jablonka, P., Hill, V., Venn, K. A., Shetrone, M. D., Letarte, B., Cole, A. A., Primas, F., Francois, P., Arimoto, N., Sadakane, K., Kaufer, A., Szeifert, T., & Abel, T. 2004, ApJ, 617, L119
- VandenBerg et al. (2006) VandenBerg, D. A., Bergbusch, P. A., & Dowler, P. D. 2006, ApJS, 162, 375
- VandenBerg & Clem (2003) VandenBerg, D. A. & Clem, J. L. 2003, AJ, 126, 778