The Detection and Characterization of cm Radio Continuum Emission from the Low-mass Protostar L1014-IRS
Abstract
Observations by the Cores to Disk Legacy Team with the Spitzer Space Telescope have identified a low luminosity, mid-infrared source within the dense core, Lynds 1014, which was previously thought to harbor no internal source. Followup near-infrared and submillimeter interferometric observations have confirmed the protostellar nature of this source by detecting scattered light from an outflow cavity and a weak molecular outflow. In this paper, we report the detection of cm continuum emission with the VLA. The emission is characterized by a quiescent, unresolved 90 Jy 6 cm source within of the Spitzer source. The spectral index of the quiescent component is between 6 cm and 3.6 cm. A factor of two increase in 6 cm emission was detected during one epoch and circular polarization was marginally detected at the level with Stokes V/I % . We have searched for 22 GHz H2O maser emission toward L1014-IRS, but no masers were detected during 7 epochs of observations between June 2004 and December 2006. L1014-IRS appears to be a low-mass, accreting protostar which exhibits cm emission from a thermal jet or a wind, with a variable non-thermal emission component. The quiescent cm radio emission is noticeably above the correlation of 3.6 cm and 6 cm luminosity versus bolometric luminosity, indicating more radio emission than expected. In this paper, we characterize the cm continuum emission in terms of observations of other low-mass protostars, including updated correlations of centimeter continuum emission with bolometric luminosity and outflow force, and discuss the implications of recent larger distance estimates on the physical attributes of the protostar and dense molecular core.
Subject headings:
radiation mechanisms:thermal,non-thermal — radio continuum:stars — stars: formation1. Introduction
It is extremely difficult to identify the incipient stages of low-mass ( Msun) star formation because dense molecular cloud cores obscure nascent protostars. Submillimeter dust continuum surveys (e.g., Ward-Thompson et al. 1994, Shirley et al. 2000, Visser et al. 2002, Kirk et al. 2005) have identified several dense cores with no apparent internal sources, based on the lack of an IRAS point source and the diffuse nature of submillimeter dust emission. Observations by the Cores to Disk Legacy Team (c2d) with the Spitzer Space Telescope have identified a few mid-infrared sources that are embedded near the submillimeter continuum peaks of previously classified starless cores (e.g. Young et al. 2004, Bourke et al. 2006). These new objects are of low-luminosity ( L⊙) and presumably low-mass since they were not previously detected by IRAS. Some of these objects may be in the earliest stages of accretion. These newly identified low-mass, low-luminosity protostars warrant detailed follow-up studies to determine their evolutionary status.
The first newly identified object detected in the c2d survey, L1014-IRS (Young, et al. 2004), was modeled as a very low-luminosity (L⊙), low-mass (M⊙) object embedded within the Lynds 1014 dark cloud (Lynds 1962) at a distance of approximately 200 pc. This object has been classified as a VeLLO (Very Low-Luminosity Object) by the c2d team: an object with an internal protostellar luminosity L⊙ that is directly associated with a dense molecular core. The recent study of Morita et al. (2006) has suggested a revised distance estimate of to pc based on the possible age ranges of nearby T-Tauri stars that are spatially within ∘ of the L1014 dense core. However, it is not clear that these T-Tauri stars are directly associated with L1014.
Determining the evolutionary state of L1014-IRS has been the subject of several follow-up studies. The large scale molecular distribution in the dense core was determined by the single-dish mapping survey of Crapsi et al. (2005). No evidence for a large scale CO outflow was detected; however, a molecular outflow was detected on small scales with the SMA (Bourke et al. 2005). Near-infrared observations detect scattered light, presumably from the outflow cone, at µm and µm (Huard et al. 2006). The SMA-detected CO outflow is aligned with the direction of the near-infrared scattered light cavity. High resolution molecular observations with BIMA indicate that the protostar is not at the peak of the molecular and dust column density in the core, but offset by about ″ in the plane of the sky (Lai et al., in preparation). This offset is also seen in (sub)millimeter continuum maps (Young et al. 2004) and the near-infrared extinction map (Huard et al. 2006).
Despite these significant observational efforts, a single, consistent picture of the evolutionary state of L1014-IRS has not emerged. In order to better characterize the physical nature of L1014-IRS, we have conducted centimeter radio continuum observations using five array configurations of the Very Large Array 111The VLA is operated by NRAO. The National Radio Astronomy Observatory is a facility of the National Science Foundation operated under a cooperative agreement by Associated Universities, Inc. (VLA). Centimeter radio continuum emission is well correlated with the luminosity of protostellar sources (Anglada 1995) and is thought to arise from shock ionization from protostellar winds (Ghavamian & Hartigan 1998), from interaction of the protostellar jets with dense gas in the interface of the outflow cavity (Curiel et al. 1987, 1989, Shang et al. 2004), or from accretion shock-driven photoionization (Neufeld & Hollenbach 1996).
In this paper we report the detection and characterization of the cm radio continuum emission toward L1014-IRS (§3.1). We compare the detected cm emission with observations of other low-mass protostars (§4.1). We discuss the non-detections of 22 GHz H2O masers and compare our upper limits to the recent maser monitoring surveys of low-mass protostars (§4.2). We also compare the derived source properties from the diverse studies of the protostar and dense core in terms of the range of distance estimates to L1014 (§4.3).
2. VLA Observations
L1014-IRS was observed during 10 epochs in 5 array configurations (D, A, BnA, B, and C) with the Very Large Array (Table 1). All observations were centered on the published Spitzer mid-infrared source (, , J2000.0). Continuum observations were made at 3.6 cm, and 6.0 cm, with two polarization pairs at adjacent frequencies, providing a total equivalent bandwidth of 172 MHz. We also attempted to detect H2O masers by observing the J transition at GHz with, typically, kHz spectral resolution ( km/s) spanning km/s velocity coverage.
For the 3.6 and 6.0 cm data, the data were reduced independently using the standard routines in AIPS++ and AIPS. Complex gain calibration was performed by switching to the nearby quasar 2137+510, ∘ from L1014-IRS, on time-scales of 15 to 30 minutes (Hamaker, Bregman, & Sault 1996a,b). The absolute flux density and bandpass calibration were determined from observations of the quasars 3C48 and 3C283.
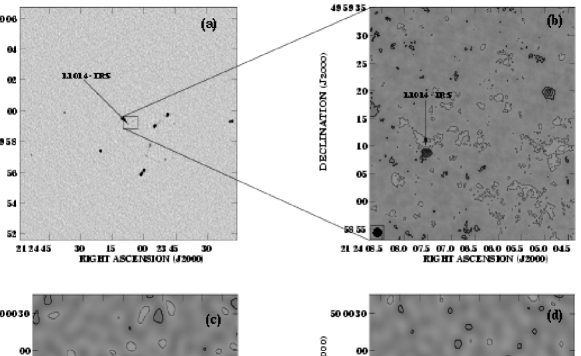
The Stokes I and V images were deconvolved using the Cotton-Schwab algorithm (e.g., Schwab 1984) and Clark-Högbom algorithm (Högbom 1974, Clark 1980) with a few thousand iterations and interactive CLEAN regions. Imaging the L1014-IRS field was difficult due to the presence of several bright sources within the VLA primary beam (Figure 1a). Special care had to be taken in the CLEANing process (e.g., Cornwell, Braun, & Briggs 1999) and multiple reductions with variations in the CLEAN parameters were performed. We have checked the consistency of our images by also reducing the data with the standard AIPS routines, and the fluxes agree within the statistical errorbars. Generally, the images are made with natural weighting of the visibilities (Briggs 1995); however, uniform weighting was used to obtain better angular resolution for the full track ( hour) observations on the days of July 1, 2004 and August 21, 2004.
3. Results
3.1. Radio Continuum Detections
We detected cm radio continuum emission from a source within of the Spitzer mid-IR source using the VLA at 3.6 cm and 6 cm (Figure 1). The initial detections were made during 9 hour tracks at 3.6 cm and 6 cm with the VLA in the D configuration. Subsequent observations detected the source at 6 cm in the other three VLA configurations, and again at 3.6 cm in D configuration. All of the 6 cm observations, except for the initial 6 cm detection on August 21, 2004, indicate a constant flux density source with an average 6 cm flux of Jy (). The source is unresolved in all array configurations. The two detections at 3.6 cm are also in agreement with each other despite being separated by 17 months. The average 3.6 cm flux is Jy (). The spectral index between two wavelengths () is defined as
| (1) |
We find an average spectral index between 3.6 cm and 6 cm of .
We may estimate the likelihood that the radio continuum emission is directly related to L1014-IRS and not due to a background object by calculating the number of background extragalactic sources with sufficient flux that are expected within our synthesized beam. The cm continuum source is unresolved in the A configuration observations at 6 cm with a synthesized beam (natural weighting). The position of the 6 cm source (, , J2000.0) is within of the Spitzer mid-infrared source. The 6 cm source is the only source with a flux Jy within of the Spitzer source. The total number of background sources with a flux greater than Jy at 6 cm is given by per square arcminute (Fomalont et al. 1991); therefore, the number of background sources with a flux Jy is 0.115 arcmin-2. The probability that a background source lies within our 6 cm synthesized beam is . We believe the centimeter emission is associated with L1014-IRS and not associated with a background source due to the exceptional positional coincidence and strength of the emission.
The cm continuum emission was not constant at all observed epochs. The 6 cm observations during the epoch of August 21, 2004 indicate a factor of 2 higher flux. The 6 cm detection is an detection of Jy (Figure 1c). This indicates that the centimeter flux is variable and may be an indication of a flare (§4.1.2). We checked the consistency of the August 21 observations by comparing the 6 cm flux of other unresolved sources within the L1014 field during the other 6 cm epochs. No systematic increase was detected among the background unresolved sources on August 21, 2004.
We checked for variability on short timescales by separating and re-imaging the August 21, 2004 6 cm observations into four 2 hour time blocks. The source was found to not vary, within the uncertainties, during each 2 hour time block. This does not rule out a variation on shorter timescales; however, it is extremely difficult to detect that variation due to the higher noise level in progressively shorter time blocks.
A Stokes V source (circularly polarized) was marginally detected at the level at 6 cm on August 21, 2004 with a flux of Jy at the position of the 6 cm Stokes I source (Figure 1d). The fraction of circular polarization, Stokes V/I %, is quite high if the detection is significant. Since the Stokes V result was obtained during a full single track of VLA observations, it will be difficult to confirm until L1014-IRS is observed with wider bandwidth (e.g., with the eVLA). If the circular polarization signal is real, then this observation indicates that the radio emission observed on August 21, 2004 must originate from a non-thermal mechanism (§4.1.2).
3.2. Water Maser Search
We searched for H2O masers during seven epochs spanning 22 months by observing the J transition at 22.23508 GHz. No H2O masers were detected at any epoch. The combined rms of the non-detection is mJy/beam with a channel spacing of kHz and a total bandwidth of 3.125 MHz (40 km/s). The individual observations are summarized in Table 1.
4. Discussion
4.1. Centimeter Radio Continuum Emission
4.1.1 Steady Component
Centimeter continuum emission has been detected toward many but not all high-mass and low-mass protostars. The emission is most commonly thought to originate from bremsstrahlung (free-free) emission from ionized gas, although some protostellar objects also display non-thermal emission. For high-mass protostars, the ionization mechanism is photoionization usually in the form of an embedded HII region (Churchwell 1990). For protostars that are later in spectral type than B, the ionizing radiation from the star is not enough to significantly photoionize the surrounding envelope and an alternative mechanism is needed to explain the observed emission (Rodríguez et al. 1989, Anglada 1995). Since nearly all low-mass, embedded protostars are known to have molecular outflows (e.g. Wu et al. 2004), the ionization is postulated to arise from shocks generated from a jet (e.g., Cohen, Bieging, & Schwartz 1982, Bieging & Cohen 1989, Curiel et al. 1987, 1989, Rodríguez & Reipurth 1996, Shang et al. 2004). Direct evidence for this hypothesis comes from observations using interferometers at high angular resolution. Elongated centimeter continuum emission regions are observed with the same orientation as the large-scale molecular outflow toward a few protostars (e.g., Anglada 1995; Bontemps, Ward-Thompson, & André 1996). In addition, the observed outflow force (M⊙ km/s/yr) theoretically provides enough energy in the shock to explain the observed centimeter fluxes toward most low-mass protostars (Cabrit & Bertout 1992, Skinner et al. 1993, Anglada 1995). Finally, the radio spectral index of many protostellar sources is consistent with optically thin () to partially optically thick free-free emission between 3.6 cm and 6.0 cm (, e.g., Anglada et al. 1998, Beltrán et al. 2001).
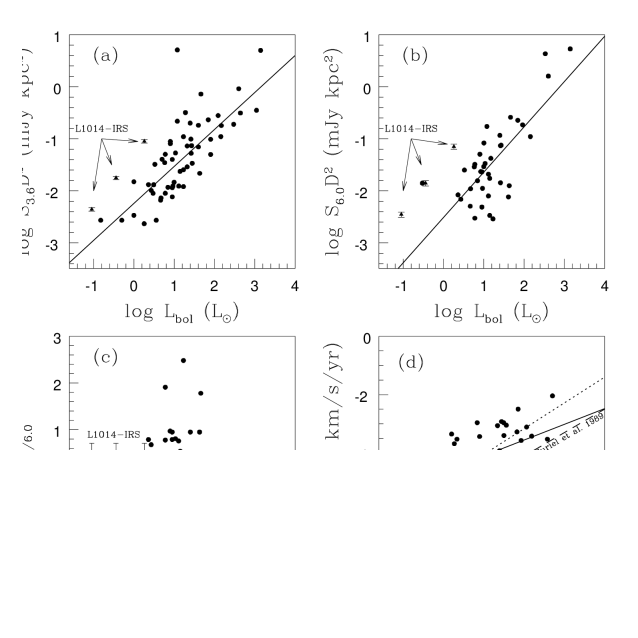
The centimeter continuum luminosity (e.g., mJy kpc2) of low-mass and intermediate-mass protostellar sources was first cataloged from the literature in the review by Anglada (1995). Anglada plotted the 3.6 cm luminosity against the bolometric luminosity of protostars with L⊙ and found a well correlated relationship (), mJy kpc2. This relationship has formed the basis for predictions of the amount of centimeter emission that is expected in searches for new low-mass protostars (e.g., Harvey et al. 2002, Stamatellos et al. 2007). The 3.6 cm luminosity correlation is directly related to the well established correlation of outflow force vs. bolometric luminosity (Bontemps et al. 1996, Wu et al. 2004); higher luminosity sources drive more powerful outflows that result in a larger degree of shock ionization and therefore a larger 3.6 cm luminosity (Anglada 1995).
Since 1995, many more centimeter observations have been made and the spectral coverage of the photometry of protostars has increased. We have used the detailed summary tables of Furuya et al. (2003; Table 4) and Anglada (1995) supplemented by the surveys of Eiroa et al. (2005) and Anglada et al. (1998) to catalog the 3.6 cm, 6.0 cm, and bolometric luminosities of detected protostellar sources. We updated the bolometric luminosity of sources observed in the submillimeter surveys of Shirley et al. (2000), Mueller et al. (2003), and Young et al (2003). The resulting sample of sources at 3.6 cm and sources at 6.0 cm are plotted in Figure 2. We find updated correlations of
| (2) | |||||
| (3) |
with correlation coefficients of and respectively. This sample is not complete as there are many more protostellar centimeter detections for which no has been published. Nevertheless, we have updated the correlation of Anglada (1995) with twice as many points at 3.6 cm and plotted the correlation at 6.0 cm for the first time.
For comparison, we have plotted the 3.6 cm and 6.0 cm luminosities of L1014-IRS in Figure 2 at the distances of 200, 400, and 900 pc. L1014-IRS is above the correlation at all distances indicating that we have detected more centimeter continuum flux than expected.
The spectral index of sources between 3.6 cm and 6.0 cm is used to argue for the interpretation that the emission mechanism is consistent with partially optically thick free-free emission. Optically thin free-free emission is expected to have a spectral index at centimeter wavelengths. In the optically thick limit, approaches with intermediate values indicative of partially optically thick plasmas. We have also plotted the spectral index of sources from the literature that have been detected at both wavelengths and have a published determination in Figure 2. No correlation of is observed with bolometric luminosity, probably indicating that the optical depth associated with the jet’s shock ionization is not dependent on the total protostellar luminosity or the strength of the molecular outflow. The median spectral index is , with most protostellar sources having flat or positive spectral indices. This median value is close to the result expected for an ionized wind or jet with a density gradient (e.g., Panagia & Felli 1975, Wright & Barlow 1975, Reynolds 1986). Unfortunately, most of the sources in Figure 2 were not observed at both wavelengths on the same day and variability may result in significant scatter in the plot.
The spectral index of the quiescent emission of L1014-IRS () is consistent with ionized free-free emission with a density gradient. The spectral index agrees well with the median of the ensemble of protostellar sources measured.
We have also updated the correlation between outflow force, (M⊙km/s/yr), and centrimetric luminosity of Anglada (1995) using the molecular outflow compilations of Bontempts et al. (1996), Furuya et al. (2003), and Wu et al. (2004). The updated correlation of 44 sources is weak (),
| (4) |
This correlation is interpreted as evidence that jets from the molecular outflow provide enough shock ionization to account to the observed centimeter continuum emission (e.g., Anglada 1995). Assuming maximum ionization efficiency, the minimum outflow force needed to create the observed level of 3.6 cm flux was estimated by Curiel et al. (1987, 1989) to be . This level is shown as a dashed line in Figure 2d. The observed outflow force toward L1014-IRS ranges from M⊙ km/s/yr for distances of 200 to 900 pc (see Bourke et al. 2005). At a distance of 200 pc, the upper limit on the outflow force is a factor of 2 lower than the Curiel theoretical minimum outflow force. The upper limit in the observed outflow force includes estimates of the missing flux due to interferometric spatial filtering as well as the average opacity corrections for low-mass protostellar outflows (see Bourke et al. 2005). Given the range of uncertainty in these estimates, the observed outflow force is below, but not necessarily inconsistent with the theoretical minimum outflow force needed to produce the observed 3.6 cm luminosity. The disagreement between the observed outflow force is more pronounced at larger distances, increasing to an order of magnitude below the theoretical curve for a distance of 900 pc.
The small observed molecular outflow force and the large observed centimeter continuum luminosities may indicate that another ionization mechanism is operating in L1014-IRS. There are a few other possibilities that have been discussed in the literature. We shall analyze the viability of two popular possibilities.
Radiative transfer modeling of emission at and µm indicate a flux excess from a disk around L1014-IRS (Young et al. 2004). Neufeld & Hollenbach (1996) postulated that the supersonic infall of material onto a protostellar disk will create an accretion shock with enough ionization to generate mJy of continuum emission at centimeter wavelengths at distances of pc. However, this mechanism does not appear to be able to provide enough ionization to explain the emission observed toward L1014-IRS. In order to produce Jy emission at 6 cm at a distance of pc, the protostellar mass has to be M⊙ and the accretion rate onto the disk must be M⊙/yr (see Figure 2 of Neufeld & Hollenbach 1996). Estimates of the protostellar mass are very uncertain and highly distance dependent, however, M⊙ is likely larger than the L1014-IRS protostar and disk mass, even for the far distance estimate of pc (see Young et al. 2004). Furthermore, this accretion rate is an order of magnitude larger than the range of inferred accretion rates from the observed outflow momentum flux and the modeled internal luminosity of the source ( M⊙/yr; Bourke et al. 2006, Young et al. 2004). Ionization from an accretion shock does not appear to be a likely explanation.
A more plausible possibility is that there is a spherical wind component. The expected continuum emission from self-shocked spherical winds have been modeled by numerous authors (e.g., Panagia & Felli 1975, Wright & Barlow 1975, Reynolds 1986, González & Cantó 2002). The recent study of González & Cantó model a time variable wind that generates internal shocks (Raga et al. 1990) which produce ionization and centimeter continuum emission (see Ghavamian & Hartigan 1998). Their models produce centimeter continuum emission of several hundreds of -Janskys and spectral indices that are positive for mass loss rates of M⊙/yr at a distance of 150 pc. Accounting for the larger distance estimates of to pc and potentially lower mass loss rates for L1014-IRS, then this type of emission may still account for the flux observed at 3.6 cm and 6 cm ( Jy). However, the spherical wind models is usually applied to evolved protostellar sources that are Class II (classical T-Tauri stars) or later (e.g., Evans et al. 1987). If L1014-IRS is an older, more evolved protostar, then this may not be a problem (§4.3).
4.1.2 Variable Component
While the quiescent component of L1014-IRS is constant over 5 epochs with a positive spectral index, the emission properties of L1014-IRS were significantly different during the single epoch of August 21, 2004. The 6 cm flux was larger by a factor of two, Jy. Unfortunately, the spectral index of elevated emission was not determined since L1014-IRS was observed at a single wavelength. Circular polarization was detected at the level indicating non-thermal emission. Thus, L1014-IRS has variable centimeter emission, although the timescale of the variability is not constrained since it was seen to vary during only a single epoch.
In general variability of centimeter continuum sources has not been properly addressed since observations of sources are limited to a few epochs. There has not been a systematic, monthly monitoring campaign of deeply embedded sources to characterize their centimeter variability; however, there is observational evidence for variability among deeply embedded protostellar sources. For instance, the Class 0 source, B335, is known to vary between an upper limit of Jy (1994 December) and 390 Jy (2001 January) at 3.6 cm (Avila et al. 2001, Reipurth et al. 2002). Another example is the variability and purported evidence for jet precession of the centimeter continuum sources toward IRAS16293 (Chandler et al. 2005). Variability contributes scatter (de-correlation) of the luminosity correlations shown in Figure 2. In additional to the known variable thermal sources, several non-thermal protostellar sources are known to be highly variable (e.g. T Tauri stellar flares, see White 1996); but, most of those objects are more evolved than deeply embedded protostars.
The observed increase in emission on August 21, 2004 and Stokes V detection is indicative of variable non-thermal emission toward L1014-IRS. While there have been a few high-mass protostars with observed negative spectral indices (e.g., Reid et al. 1995; Garay et al. 1996), most embedded ( Class I) low-mass protostars with cm radio emission have positive spectral indices (see Figure 2). There are only a few embedded low-mass protostars toward which negative spectral index, non-thermal emission is detected (e.g., Shepherd & Kurtz 1999, Girart et al. 2002). One case, R CrA IRS5, was detected with significant circular polarization (Feigelson et al. 1998). The authors postulate that the emission is due to gyrosynchrotron emission and may originate from magnetic reconnection events associated with flares (Feigelson et al. 1998). The physical mechanism for generating the radio flare is still not well understood (e.g., Basri 2004) and it is questionable whether it applies to the embedded phase of low-mass protostars (see below). A second case, IRAS 192432350, is a steep spectrum non-thermal source () that is elongated in the direction of its CO outflow (Girart et al. 2002). Girart et al. postulate that the emission may originate from a bi-conical synchrotron source tracing the protostellar jet, similar to observations of the high-mass source W3(OH) (Reid et al. 1995, Wilner, Reid, & Menten 1999). Non-thermal emission may be present in low-mass protostellar jets, but the level of emission may be dominated by the thermal, shock-ionized component of the jet. In the case of L1014-IRS, this non-thermal jet component would have to be variable. We shall discuss several possibilities for the origin of the observed non-thermal emission toward L1014-IRS.
In order to better understand the non-thermal emission mechanism, we estimate the brightness temperature of the emission to be K for distances of 200 to 900 pc and an emitting region that is AU in size. The brightness temperature is very sensitive to the assumed size of the emitting region. A of 1 AU is appropriate for a small flare; but, smaller when compared to the solar coronal emitting region which is typically less than AU (e.g. Leto et al. 2000). Since the emission observed toward L1014-IRS was unresolved, even in the A-array configuration, then we can only limit the size of the emission region to AU. For instance, if we assumed that the emitting region was AU (half of our A-array resolution), then the brightness temperature drops to K. This is too low even for the steady, thermal free-free component ( K), unless the emission was very optically thick. This cannot be the case since would imply approaching which is not observed. While the size of the emitting region is severely unconstrained, the detection of circular polarization indicates non-thermal emission probably on small ( few AU) size scales, most likely due to gyrosynchrotron emission (e.g., Ramaty 1969; Dulk & Marsh 1982).
Radio flares are observed toward very low-mass objects including brown dwarfs (Berger et al. 2002, Osten et al. 2006), late M dwarfs (Berger 2006), and T-Tauri stars (Bieging & Cohen 1989; White, Pallavicini, & Kundu 1992). The typical level of quiescent emission toward low-mass stars and brown dwarfs is Jy and the flares are mJy (for nearby distances of pc) with significant circular polarization (% ) detected during the flaring events. The spectral luminosity at 6 cm of L1014-IRS during the event is erg s-1 Hz-1. This is about 2400 times larger than the most luminous observed solar flares (Bastian 2004) and about times larger than the flares observed by Berger (2006) toward late M dwarfs. If the radio emission is due to a flare, it must be a powerful flare since L1014-IRS is at least times farther away than the average distance of sources detected by Berger ( pc). However, it is not larger than the typical non-thermal flaring emission observed toward young T Tauri stars of erg s-1 Hz-1 (Güdel 2002). The ratio of spectral flare luminosity to bolometric luminosity, Hz-1, is also similar to the ratio observed toward classical T-Tauri stars (see Güdel 2002).
The timescale over which radio flares toward low-mass stars are observed tends to occur over minutes to hours. For instance, the low-mass brown dwarf, LP944-2, discovered by the 2001 NRAO summer students (Berger et al. 2002), displays flaring activity with an average timescale of 10 to 15 minutes. This is very different from the activity observed toward L1014-IRS on August 21, 2004. We detected no evidence for short-term variability within our detected emission. The source appears to have a nearly constant flux that is twice as high as the steady component for at least an 8 hour period. This elevated emission then appears to be longer in duration than that observed during flaring events toward low-mass (proto)stars (Güdel 2002).
An alternative possibility is that the elevated emission is not due to a flare, but due to rotational modulation of a non-thermal component associated with the magnetic connection between disk and accretion onto the star (i.e., Bieging & Cohen 1989). Such a mechanism has been postulated for the T-Tauri star, V410 Tauri, with a rotational period of 1.9 days. The observed emission toward V410 is mJy with a negative spectral index. If the accretion spot is blocked from view for a fraction of the stellar rotation period, then it is possibly that we could have observed the source with the accretion spot is in view on August 21, 2004 and with the accretion spot blocked from view during the other epochs. The rotational period of L1014-IRS must be longer than 8 hours since elevated emission was observed during the entire 8 hour track. A negative spectral index was observed toward V410 Tauri, while a negative spectral has not been observed toward L1014-IRS. This hypothesis is highly speculative and would require a regular monitoring campaign to test.
Unfortunately, it is currently not possible to strongly constrain the origin of the non-thermal component toward L1014-IRS. The expanded bandwidth of the eVLA is needed to permit a systematic monitoring campaign with high enough signal-to-noise in only a few hour observations to routinely check for a Stokes V detection and to determine an instantaneous spectral index.
4.2. Water Maser Non-detections
A compact, weak molecular outflow has been detected toward L1014-IRS (Bourke et al. 2005); therefore it may be possible to detect water masers if the jet is impinging on dense knots of material near the protostar. Previous monitoring of water masers around low-luminosity protostars (L⊙) indicate that the maser activity is highly variable and fugacious (e.g., Wilking et al 1994, Claussen et al. 1996, Furuya et al. 2003). There appears to be a threshold in luminosity ( L⊙) above which water masers are always detected (Wilking et al. 1994). In general, low-luminosity protostars display less water maser activity and have lower isotropic water maser luminosities than their high-luminosity counterparts (e.g., Brand et al. 2004, Furuya et al. 2003). The lowest luminosity protostar with a water maser detection is the Class 0 source, GF9-2, with L⊙ (Furuya et al. 2003). If the distance to L1014 is 200 pc, then protostellar luminosity of L1014-IRS is a factor of 3 less luminous than GF9-2. A search for water masers toward VeLLOs significantly expands the probed luminosity parameter space.
Water maser activity for low-mass protostars is quantified in terms of the isotropic maser luminosity, (e.g. Wouterloot & Walmsley 1986). We can calculate the upper limit to the isotropic maser luminosity of L1014-IRS using the combined rms of the non-detections ( mJy/beam in a 24.4 kHz channel). The average linewidth of H2O masers sources with L⊙ is km/s (Furuya et al. 2003), corresponding to 3.5 channels in the VLA spectrum. Therefore, the upper limit to the maser intensity toward L1014-IRS, assuming the average maser linewidth, is 11.2 mJy/beam.
Furuya et al. find a correlation between the average isotropic H2O maser luminosity and ; however, there is a mistake in their conversion from integrated intensity (K km/s) to isotropic water maser luminosity (L⊙) due to confusion of kpc with pc (Furuya 2007, private communication). The correct conversion equation is given by
| (5) |
We have updated the Furuya et al. correlation by correcting the conversion factor in their Table 2 and also adding in points from the literature, namely from a survey of high-mass star-forming regions and UCHII regions by Wouterloot & Walmsley (1986), Palla et al (1993), and a survey of Bok globules by Gómez et al. (2006). Unfortunately, we were not able to add points from some prominent water maser surveys such as Wilking et al. (1994) and Valderetto et al. (2002) due to incomplete reporting or differences in the definition of the integrated flux. The updated correlation for 73 maser sources is shown in Figure 3. While at any given epoch, the water maser luminosity of a source is highly variable, the mean isotropic water maser luminosity is well-correlated with () over 6 orders of magnitude in bolometric luminosity: . The relationship is less well correlated (), but does not significantly change, if we restict the linear regression to just low-luminosity sources with L⊙, . The best fit slope is near the mean value from the many determinations made in the literature: e.g., Wouterloot & Walmsley (1986, ), Felli et al. (1992, ), Palla et al. (1993, ), Brand et al. (2004, ).
If we extrapolate this correlation to the internal luminosity of L1014-IRS at 200 pc (L⊙), then the expected is L⊙. Therefore, our 3 upper limits ( L⊙) are more than an order of magnitude below the predicted correlation and are significant compared to the strength of other detected low-luminosity protostars. The VLA is a very sensitive instrument for water maser searches, and a systematic monitoring campaign toward newly identified VeLLOs with molecular outflows is needed to constrain the threshold for the excitation of water masers.
4.3. The Distance and Evolutionary State of L1014-IRS
4.3.1 Distance
The evolutionary state of L1014-IRS depends on many observational factors and on the assumed distance to the protostar. Distances to dark clouds are very difficult to determine by standard star counting or extinction techniques (e.g., Schmidt 1975). For the previously published papers from the Cores to Disk Legacy group, a distance of pc was assumed. Recent observation of T-Tauri stars, presumed to be associated with the L1014 dense core, indicate that the distance is greater than pc and may be as large as pc (Morita et al. 2006). The association of the T Tauri stars with the dense core is not clear as L1014 is located in a region with multiple dark clouds within a few degrees. Nevertheless, in light of these new results, we discuss the physical properties derived toward the L1014 core and L1014-IRS with distances that range from to pc (see Table 2).
One potential tool to constrain the distance to L1014 is the use of stellar color excess, , of stars in the direction of L1014 (see Bourke et al. 1995). The MK Classification Extension Catalogue (Morris-Kennedy 1983) is used to determine the spectral type and the intrinsic stellar color . If the dark clouds near L1014 are associated with each other, then the extinction measured toward the MK stars may be used to look for discrete jumps in extinction with distance. This method is used to produce Figure 4 for stars within ∘ of L1014. As evinced by E. E. Barnard’s original photographs of this region (1927), there are many dark clouds within ∘ of L1014. One of the clouds, B164 (∘ from L1014), is estimated to be to pc away based on its apparent association with the nearby star 80 Cygni (Pagani et al. 1996). Another cloud, B361 (∘ from L1014), was estimated to be pc away (Schmidt 1975). Unfortunately, many of these clouds are probably not directly associated with L1014. As a result, there is no clear jump in extinction with distance, but instead the jump in extinction occurs over a range of values from pc to pc.
Since many of the derived properties have different dependences on distance in Table 2, we can attempt to use them to limit the range of distances to the core. The mass of the dense core has been determined from dust continuum observations (Young et al. 2004, ) and molecular line observations (Crapsi et al. 2005, ). The virial mass is equal to the dust mass (using the same radius to calculate both quantities) at a distance of pc; however, if we allow for the typical uncertainties in assumed dust opacity, then the dust mass is usually within a factor of 2 of the virial mass for star-forming cores (e.g., Shirley et al. 2002, 2003). Such a range varies the distance from pc to pc.
A better constraint is found from the measured outer radius of the dense core. The radius was determined by near-infrared extinction observations of background stars (Huard et al. 2006). The size of low-mass star forming cores is limited to typical outer radii of AU (Shirley et al. 2002, Jorgensen et al. 2002, Kandori et al. 2005), or pc. The measured outer radius is less than pc only for distances of pc or less. Therefore, the size of the dense core argues for a closer value of the distance to L1014.
The current set of observations are unable to place strong constraints on the distance to L1014, although there is evidence for a distance of pc. A detailed spectroscopic study of stars near the periphery of L1014 is needed to better constrain the distance.
4.3.2 Evolutionary State
A fundamental question that remains to be answered is whether L1014-IRS is a newly formed protostar or a more evolved, accreting object. In order to address this question, we must synthesize the current observational information on L1014. The derived quantities are summarized in Table 2.
First, there is a discrepancy between the modeled density structure of the L1014 dense core from the near-infrared extinction map (Huard et al. 2006) and the (sub)millimeter continuum maps (Young et al. 2004). The near-infrared data fit a Bonnor-Ebert sphere (Ebert 1955, Bonnor 1956), a hydrostatic pressure-bounded configuration, with a central density that is a factor of 8 higher than the (sub)-millimeter models. Both methods have biases that compromise the estimates of the central density. The (sub)-millimeter observations detect the core at less than , resulting in a relatively low signal-to-noise radial profile. The ability to successfully model the size of the “plateau” region of a Bonnor-Ebert profile is marginalized by the poor signal-to-noise and telescope resolution (Shirley & Jorgensen 2007, in preparation). Therefore, the (sub)-millimeter models are a lower limit to the central density of the core. The near-infrared extinction maps are limited by the number of background stars that can be traced at high extinction ( mag). In the case of L1014, there are only two stars above mag that heavily bias the smoothed density structure (T. Huard 2006, private communication). Therefore, near-infrared extinction mapping is unable to reliably determine the size of the “plateau” region for densities above a few cm-3. The true central density of L1014 probably lies between cm-3 and cm-3. These value indicate a core that is moderately to strongly centrally condensed, but there are dense starless cores that have higher central densities (e.g., L1544 Evans et al. 2001; L183, Pagani et al. 2003)
The evolutionary state of L1014-IRS may not be directly tied to the density structure of the core since L1014 may have fragmented in the past. There is evidence for this hypothesis since L1014-IRS is not located at the peak of the dust column density or molecular column density distributions (Young et al, 2004, Crapsi et al. 2005, Huard et al. 2006, Lai et al. 2007 in preparation), unlike the case for other Class 0 protostars (see Shirley et al. 2000, Jorgensen et al. 2002). The protostar is located 8″ to the north of the core peak or to AU in separation in the plane of the sky for distances of to pc. While this distance is within the core’s FWHM contour (see Jörgensen et al. 2006), it may be evidence of fragmentation. Fragmentation of the core is a more likely possibility due to the higher than average (for low-mass, dense cores) level of turbulence observed toward L1014 (MacLow & Klessen 2004); it is higher than observed in most starless cores with a CS linewidth of km/s (Crapsi et al. 2005; Lee, Myers, & Plume 2004). The protostar may have also moved from its birth-site near the peak of the core. This can occur if non-spherical accretion is considered (Stamatellos et al. 2005). For a reasonable protostellar velocity of km/s (Walsh et al. 2007), it would take L1014-IRS to years to move 8″ in projection for distances of to pc. These numbers are within the estimated lifetimes of the prestellar and Class 0 protostellar phases (Kirk et al. 2005, Ward-Thompson et al. 2007).
L1014-IRS has a disk (Young et al. 2004) and is currently accreting material at a relatively low rate based on its weak molecular outflow and low luminosity. The outflow has been active for at least several thousand years since an observable outflow cavity has been cleared over a region greater than 10″ (corresponding to AU) and has a wide opening angle (∘,Huard et al. 2006). L1014-IRS is still classified as a Class 0 source; however, if the distance is greater than pc, L1014-IRS would not be strictly classified as a VeLLO since its internal luminosity is most likely greater than L⊙.
The radio continuum observations indicate that L1014-IRS is one of the lowest luminosity protostars toward which centimeter continuum emission is detected. The 3.6 cm and 6 cm emission is higher than expected for its protostellar luminosity and the outflow force is lower than theoretically expected for its centimeter continuum luminosity. Shock ionization from the protostellar outflow is marginally a plausible explanation for nearby distances ( pc). Another possible explanation may be a self-shocked spherical wind, although this type of emission is usually associated with more evolved protostellar objects. Variable emission is observed and the properties are consistent with the flaring properties observed toward T-Tauri stars except for the duration of the elevated emission. The true nature of the variable non-thermal component is still a mystery. The characteristics of both the thermal steady component and the variable non-thermal component are consistent with centimeter continuum emission from the later stages of protostellar evolution. The bulk evidence seems to indicate that L1014-IRS is not an extremely young protostar (e.g. a first or second hydrostatic core), but instead seems to have been accreting material for at least several thousand years to tens of thousands of years and is currently observed in a low accretion state because it has decoupled from the peak of the L1014 dense core.
Future observations are needed to better characterize the centimeter continuum emission variability and to better constrain the mass loss properties of L1014-IRS. Observations with the new eVLA correlator will permit “instantaneous” spectral index studies due to the greatly enhanced bandwidth. Deep monitoring (rms Jy) of the centimeter emission of low-mass protostars will be possible with integration times less than 1 hour. If L1014-IRS is observed during a “flaring” event with the eVLA, it will be much easier to measure the degree of circular polarization and to test for short term variability. Near-infrared observations of the protostar with large aperture telescopes (e.g., Gemini 8-m) of accretion diagnostics, such as Br, are needed to better constrain the accretion properties of L1014-IRS. Finally, high angular resolution observations of the dense core with an interferometer with a wide range of coverage and brightness sensitivity (e.g., eVLA, CARMA, ALMA) will permit detailed analysis of the density structure of the inner core and the properties of the core in the offset regions between the protostar and the core column density peak.
5. Conclusions
We have detected cm radio continuum emission from L1014-IRS at 3.6 cm and 6.0 cm. The emission is characterized by a quiescent, nearly constant unresolved component of Jy at 6 cm with a spectral index of between 3.6 cm and 6 cm. We have updated, using recently published observations of low-mass protostars, the correlations of cm and cm continuum luminosity versus bolometric luminosity and the correlation of molecular outflow force with cm luminosity. The quiescent emission component is consistent with partially ionized free-free emission, but is above the linear correlation for low-mass protostars between 3.6 cm luminosity and bolometric luminosity and below the correlation of outflow force and cm luminosity. The quiescent continuum emission may be explained by shock-ionization from the protostellar jet or a time-variable wind. A non-thermal brightening by a factor of 2 of the 6 cm continuum was detected on August 21, 2004 with circular polarization at the level. The true nature of the variable non-thermal component remains a mystery although the ratio of the flare luminosity to bolometric luminosity is consistent with those observed toward T-Tauri flares. We have also updated the correlation of isotropic water maser luminosity with bolometric luminosity. We do not detect water masers toward L1014-IRS, consistent with the highly variable nature of water masers around low-luminosity protostars. Analysis of the derived properties of the L1014 dense core and the L1014-IRS protostar indicate that it is probably not an extremely young protostar but is a low-luminosity source that appears to have been accreting for at least several thousand years and is currently in a low accretion state. Properties of the protostar and dense core indicate it is probably at a distance of pc.
References
- (1)
- (2) Anglada, G. 1995, in Circumstellar Disks, Outflows and Star Formation, ed. S. Lizano & J. M. Torrelles (Rev. Mexicana Astron. Astrofis. Ser. Conf. 1)(México, D.F.: Inst. Astron. Univ. Nac. Autónoma México), 67
- (3) Anglada, G., Villuendas, E., Estella, R., Beltrán, M. T., Rodríguez, L. F., Torrelles, J. M., & Curiel, S. 1998, AJ, 116, 2953
- (4) Avila, R., Rodríguez, L. F., & Curiel, S. 2001, RMxAA, 37, 201
- (5) Barnard, E. E., Frost, E. B., & Calvert M. R. 1927, A Photographic Atlas of Selected Regions of the Milky Way, Carnegie Institution of Washington.
- (6) Basri, G. 2004, in Star as Suns: Activity, Evolution, and Planets, IAU Symposium, Vol. 219, eds. A. K. Dupree & A. O. Benz, 275
- (7) Bastian, T. S. 2004, in Stars as Suns: Activity, Evolution, and Planets, IAU Symposium, eds. A. K. Dupree & A. O. Benz, 219, 145
- (8) Beiging, J. H., & Cohen, M. 1989, AJ, 98, 1686
- (9) Beltrán, M. T., Estella, R., Anglada, G., Rodríguez, L. F., & Torrelles, J. M. 2001, AJ, 121, 1556
- (10) Berger, E., Ball, S., Becker, K. M., et al. 2001, Nature, 410, 338
- (11) Berger, E. 2002, ApJ, 572, 503
- (12) Berger, E. 2006, ApJ, 648, 629
- (13) Bieging, J. H. & Cohen, M. 1989, AJ, 98, 1686
- (14) Bonnor, W. B. 1956, MNRAS, 116, 351
- (15) Bontemps, S., André, P., Terebey, S., & Cabrit, S. 1996, A&A, 311, 858
- (16) Bourke, T. L., Hyland, A. R., Robinson, G., James, S. D., & Wright, C. M. 1995, MNRAS, 276, 1067
- (17) Bourke, T. L., Crapsi, A., Myers, P. C., et al. 2005, ApJ, 633, 129
- (18) Bourke, T. L, Myers, P. C., Evans, N. J., II, et al. 2006, ApJ, 649, L37
- (19) Brand, J., Cesaroni, R., Comoretto, G., Felli, M., Palagi, F., Palla, F., & Valdettaro, R. 2003, A&A, 407, 573
- (20) Briggs, D. S. 1995, Ph. D. thesis, New Mexico Institute of Mining and Technology
- (21) Cabrit, S. & Bertout, C. 1992, A&A, 261, 274
- (22) Chandler, C. J., Brogan, C. L., Shirley, Y. L., & Loinard, L. 2005, ApJ, 632, 371
- (23) Clark, B. G. 1980, A&A, 89, 377
- (24) Claussen, M. J., Wilking, B. A., Benson, P. J., Wootten, A., Myers, P. C., & Terebey, S., 1996 ApJS, 106, 111
- (25) Cohen, M., Bieging, J. H., & Schwartz, P. R. 1982, ApJ, 253, 707
- (26) Cornwell, T., Braun, R., & Briggs, D. S. 1999, in Synthesis Imaging in Radio Astronomy II, ASP Conf. Ser. 180, eds. G. B. Taylor, C. L. Carilli, and R. A. Perley, 151
- (27) Crapsi, A., Devries, C. H., Huard, T. L., et al. 2005, A&A, 439, 1023
- (28) Curiel, S., Canto, J., & Rodríguez, L. F. 1987, RMxAA, 14, 595
- (29) Curiel, S., Rodríguez, L. F., Bohigas, J., Rith, M., & Cantó, J. 1989, Astrophys. Lett. Comm., 27, 299
- (30) Dulk, G. A. & Marsh, K. A. 1982, ApJ, 259, 350
- (31) Ebert, R. 1955, Zeitschrift für Astrophysik, 36, 222
- (32) Eiroa, C., Torrelles, J. M., Curiel, S., & Djupvik, A. A. 2005, AJ, 130, 643
- (33) Evans, N. J., II, Levreault, R. M., Beckwith, S., & Skrutskie, M. 1987, ApJ, 320, 364
- (34) Evans, N. J., II, Rawlings, J. M. C, Shirley, Y. L., & Mundy, L. G. 2001, ApJ, 557, 193
- (35) Feigelson, E. D., Carkner, L., & Wilking, B. A. 1998, ApJ, 494, 215
- (36) Felli, M., Palagi, F., & Tofani, G. 1992, A&A, 255, 293
- (37) Fomalont, E. B., Windhorst, R. A., Kristian, J. A., & Kellerman, K. I. 1991, AJ, 102, 1258
- (38) Furuya, R. S., Kitamura, Y., Wootten, A., Claussen, A., Claussen, M. J., & Kawabe, R. 2003, ApJS, 144, 71
- (39) Garay, G., Ramirez, S., Rodríguez, L. F., Curiel, S., & Torrelles, J. M. 1996, ApJ, 459, 193
- (40) Ghavamian, P. & Hartigan, P. 1998, ApJ, 501, 687
- (41) Girart, J. M., Rodríguez, L. F., & Cantó J. 2002, RMxA&A, 38, 169
- (42) Gómez, J. F., de Gregorio-Monsalvo, I., Suárez, O., Kuiper, T. B. H. 2006, AJ, 132, 1322
- (43) Gonzálex, L. F. & Cantó, J. 2002, ApJ, 580, 459
- (44) Güdel M. 2002, ARA&A, 217
- (45) Hamaker, J. P., Bregman, J. D., & Sault, R. J. 1996, A&AS, 117, 137
- (46) Harvey, D. A., Wilner, D. J., DiFrancesco, J., Lee, C.-W., Myers, P. C., & Williams, J. P. 2002, ApJ, 123, 3325
- (47) Högbom, J. A. 1974, A&AS, 15, 417
- (48) Huard, T. L., Myers, P. C., Murphy, D. C., et al. 2006, ApJ, 640, 391
- (49) Jorgensen, J. K., Schöier, F. L., & van Dishoeck, E. F. 2002, A&A, 389, 908
- (50) Kandori, R., Nakajima, Y., Tamura, M., et al. 2005, AJ, 130, 2166
- (51) Kirk, J. M., Ward-Thompson, D., & André, P. 2005, MNRAS, 360, 1506
- (52) Leto, G., Pagano, I., Linsky, J. L., Rodonó, & Umana, G. 2000, A&A, 359, 1035
- (53) Lee, C. W., Myers, P. C., & Plume, R. 2004, ApJS, 153, 523
- (54) Lynds, B. T. 1962, ApJS, 7, 1
- (55) Mac Low, M.-M. & Klessen, R. S. 2004, Rev. of Mod. Phys., 76, 125
- (56) Morris-Kennedy, P. 1983, MK Classification Extension. Mt. Stromlo Obs., Canberra (also in The Astronomical Data Centre CD-ROM Selected Astronomical Catalogs, Vol. 1, 1989)
- (57) Morita, A., Watanabe, M., Sugitani, K., Itoh, Y., Uehara, M., Nagashima, C., Ebizuka, N., Hasegawa, T., Kinugasa, K., & Tamura, M. 2006, PASJ, 58, 41
- (58) Neufeld, D. A., & Hollenbach, D. J. 1996, ApJ, 471, L45
- (59) Osten, R. A. & Jayawardhana, R. 2006, ApJ, 644, 67
- (60) Pagani, L. & Breart de Boisanger, C. 1996, A&A, 312, 989
- (61) Pagani, L., Lagache, G., Bacmann, A. 2003, A&A, 406, 59
- (62) Palla, F., Cesaroni, R., Brand, J., Caselli, P., Comoretto, G., & Felli, M. 1993, A&A, 280, 599
- (63) Panagia, N. & Felli, M. 1975, A&A, 39, 1
- (64) Raga, A. C., Cantó, J., Binette, L. & Calvert, N. 1990, ApJ, 364, 601
- (65) Ramaty, R. 1969, ApJ, 158, 753
- (66) Reid, M. J., Argon, A. L., Masson, C. R., Menten, K. M., & Moran, J. M. 1995, ApJ, 443, 238
- (67) Reipurth, B., Rodríguez, L. F., Anglada, G., & Bally, J. 2002, AJ, 124, 1045
- (68) Reynolds, S. P. 1986, ApJ, 304, 713
- (69) Rodríguez, L. F., Myers, P. C., Cruz-González, I., & Terebey, S. 1989, ApJ, 347, 461
- (70) Rodríguez, L. F., & Reipurth B. 1996, RMxA&A, 32, 27
- (71) Schmidt, E. G. 1975, MNRAS, 172, 401
- (72) Schwab, F. R. 1984, AJ, 89, 1076
- (73) Shang, H., Lizano, S., Glassgold, A., & Shu F. 2004, ApJ, L69
- (74) Shepherd, D. S. & Kurtz, S. E. 1999, ApJ, 523, 690
- (75) Shirley, Y. L., Evans, N. J., II, & Rawlings, J. M. C. 2000, ApJS, 131, 249
- (76) Shirley, Y. L., Evans, N. J., II, & Rawlings, J. M. C. 2002, ApJ, 575, 337
- (77) Shirley, Y. L., Evans, N. J., II, Young, K. E., Knez, C. & Jaffe , D. T. 2003, ApJS, 149, 375
- (78) Skinner, S. L., Brown, A., & Stewart, R. T. 1993, ApJS, 87, 217
- (79) Stamatellos, D., Whitworth, A. P., Boyd, D. F. A., & Goodwin, S. P. 2005, A&A, 439, 159
- (80) Stamatellos, D., Ward-Thompson, D., Whitworth, A. P., & Bontemps, S. 2007, A&A, 462, 677
- (81) Valdettaro, R., Palla, F., Brand, J., Cesaroni, R., Comoretto, G., Felli, M., & Palagi, F. 2002, A&A, 383, 244
- (82) Villuendas, E., Anglada, G., Estalella, R., Rodríguez, L. F., Curiel, S., & Torrelles, J. M. 1996, in Radio Emission from the Stars and Sun, ASP Conf. Ser. 93, eds. A. R. Taylor & J. M. Paredes, 56
- (83) Visser, A. E., Richer, J. S., & Chandler C. J. 2002, AJ, 124, 2756
- (84) Walsh, A. J., Myers, P. C., DiFrancesco, J., Mohanty, S., Bourke, T. L., Gutermuth, R., & Wilner, D. 2007, ApJ, 655, 958
- (85) Ward-Thompson, D., Scott, P. F., Hills, R. E., & André, P. 1994, MNRAS, 268, 276
- (86) Ward-Thompson, D., André, P., Crutcher, R., Johnstone, D., Onishi, T., & Wilson C. 2007, in Protostars and Planets V, eds. B. Reipurth, D. Jewitt, & K. Keil, University of Arizona Press, Tucson, 33
- (87) White, S. M., Pallavicini, & Kundu, M. R. 1992, A&A, 259, 149
- (88) White, S. M. 1996, in Cool Stars, Stellar Systems, and the Sun, 9th Cambridge Workshop, APS Conf. Ser., 109, eds., R. Pallavicini & A. K. Dupree, 21
- (89) Wilking, B. A., Claussen, M. J., Benson, P. J., Myers, P. C., Terebey, S., & Wootten, H. A. 1994, ApJ, 431, L119
- (90) Wilner, D. J., Reid, M. J., & Menten, K. M. 1999, ApJ, 513, 775
- (91) Wouterloot, J. G. A. & Walmsley, C. M. 1986, A&A, 168, 237
- (92) Wright, A. E., & Barlow, M. J. 1975, MNRAS, 170, 41
- (93) Wu, Y., Wei, Y, Zhao, M. Shi, Y., Yu, W., Qin, S., & Huang, M. 2004, A&A, 426 503
- (94) Young, C. H., Shirley, Y. L., Evans, N. J., II, Rawlings, J. M. C. 2003, ApJS, 145, 111
- (95) Young, C. H., Jorgensen, J. K., Shirley, Y. L., et al. 2004, ApJS, 154, 396
- (96)
| L1014-IRS | ||||||||
|---|---|---|---|---|---|---|---|---|
| UT Date | Config. | (GHz) | Stokes | BeamaaAll epochs are imaged with natural weighting except for 01 Jul, 2004 and 21 Aug, 2004 where uniform weighting was used. | bbThe total bandwidth for continuum observations and the channel spacing for H2O maser observations. | Sν | units | |
| 01 Jul 2004 | D | 8.46 | I | 59 59 | 172 MHz | 103 | 15 | Jy |
| D | 22.23508 | I | 43 34 | 24.4 kHz | … | 7.6 | mJy | |
| 21 Aug 2004 | D | 4.86 | I | 101 100 | 172 MHz | 173 | 16 | Jy |
| D | 4.86 | V | 101 100 | 172 MHz | 84 | 17 | Jy | |
| D | 22.23508 | I | 51 36 | 24.4 kHz | … | 13 | mJy | |
| 21 Nov 2004 | A | 4.86 | I | 046 044 | 172 MHz | 90 | 18 | Jy |
| 11 Jan 2005 | BnA | 22.23508 | I | 012 010 | 24.4 kHz | … | 9.5 | mJy |
| 07 Mar 2005 | B | 22.23508 | I | 035 030 | 97.6 kHz | … | 6 | mJy |
| 09 Apr 2005 | B | 4.86 | I | 17 14 | 172 MHz | 87 | 15 | Jy |
| B | 22.23508 | I | 037 030 | 24.4 kHz | … | 6 | mJy | |
| 19 Jul 2005 | C | 4.86 | I | 50 44 | 172 MHz | 89 | 21 | Jy |
| 05 Dec 2005 | D | 8.46 | I | 95 59 | 172 MHz | 119 | 20 | Jy |
| 29 Nov 2006 | C | 22.23508 | I | 115 097 | 48.8 kHz | … | 4.9 | mJy |
| 28 Dec 2006 | C | 22.23508 | I | 164 083 | 48.8 kHz | … | 9.8 | mJy |
| Combined | ABC | 4.86 | I | 16 15 | 172 MHz | 84 | 10 | Jy |
| Property | Dependence | D=200pc | D=400pc | D=900pc | units | Ref. |
|---|---|---|---|---|---|---|
| AU | 1,3,5 | |||||
| Lint | 0.09 | 0.36 | 1.8 | L⊙ | 1 | |
| M | 1.7 | 6.8 | 34.4 | M⊙ | 1 | |
| n | 1.5 | 1.1 | 7.1 | cm-3 | 1 | |
| M | 4.2 | 8.4 | 19.0 | M⊙ | 2 | |
| R | 0.13 0.16 | 0.26 0.32 | 0.59 0.72 | pc | 3 | |
| iout | … | ∘ | ∘ | ∘ | … | 3 |
| Rout | 540 | 1080 | 2430 | AU | 4 | |
| Mout | 0.14 1.4 | 0.56 5.6 | 0.28 2.8 | M⊙ | 4 | |
| t | 700 | 1400 | 3150 | yr | 4 | |
| M⊙/yr | 4 | |||||
| Pout | 0.24 4.5 | 0.1 1.8 | 0.5 9.1 | M⊙ km/s | 4 | |
| Eout | 0.02 1.4 | 0.1 5.8 | 0.05 2.9 | M⊙ km2 / s2 | 4 | |
| L | 0.03 2.5 | 0.7 5.0 | 0.15 1.1 | L⊙ | 4 | |
| F | 0.34 6.4 | 0.07 1.3 | 0.15 2.9 | M⊙ km/s/yr | 4 | |
| L3.6 | 4.4 | mJy kpc2 | 6 | |||
| L6.0 | 3.5 | mJy kpc2 | 6 | |||
| L | 3.9 | 1.6 | 7.9 | erg s-1 Hz-1 | 6 | |
| L | L⊙ | 6 |
References. — 1. Young et al. 2004; 2. Crapsi et al. 2005; 3. Huard et al. 2006; 4. Bourke et al. 2006; 5. Lai et al., in preparation, 6. This paper.
Note. — Source properties: = plane-of-sky distance between L1014-IRS and dense core peak, Lint = L1014-IRS internal luminosity (), Menv = mass of the envelope, n = Bonnor-Ebert central density from mm continuum, Mvir = envelope virial mass, R = outer radius, Rout = outflow radius, iout = outflow inclination, Mout = outflow mass, t = outflow dynamical time, = outflow mass-loss rate, Pout = outflow momentum, Eout = outflow energy, L = outflow mechanical luminosity, F = outflow force, L3.6 = 3.6 cm quiescent luminosity (), L6 = 6 cm quiescent luminosity (), L = 6 cm flare spectral luminosity (), L = isotropic H2O maser luminosity ().