Testing the Accuracy of Synthetic Stellar Libraries
Abstract
One of the main ingredients of stellar population synthesis models is a library of stellar spectra. Both empirical and theoretical libraries are used for this purpose, and the question about which one is preferable is still debated in the literature. Empirical and theoretical libraries are being improved significantly over the years, and many libraries have become available lately. However, it is not clear in the literature what are the advantages of using each of these new libraries, and how far behind are models compared to observations. Here we compare in detail some of the major theoretical libraries available in the literature with observations, aiming at detecting weaknesses and strengths from the stellar population modelling point of view. Our test is twofold: we compared model predictions and observations for broad-band colours and for high resolution spectral features. Concerning the broad-band colours, we measured the stellar colour given by three recent sets of model atmospheres and flux distributions (Castelli & Kurucz, 2003; Gustafsson et al., 2003; Brott & Hauschildt, 2005), and compared them with a recent UBVRIJHK calibration (Worthey & Lee, 2007) which is mostly based on empirical data. We found that the models can reproduce with reasonable accuracy the stellar colours for a fair interval in effective temperatures and gravities. The exceptions are: 1) the U-B colour, where the models are typically redder than the observations, and; 2) the very cool stars in general (V-K 3). Castelli & Kurucz (2003) is the set of models that best reproduce the bluest colours (U-B, B-V) while Gustafsson et al. (2003) and Brott & Hauschildt (2005) more accurately predict the visual colours. The three sets of models perform in a similar way for the infrared colours. Concerning the high resolution spectral features, we measured 35 spectral indices defined in the literature on three high resolution synthetic libraries (Coelho et al., 2005; Martins et al., 2005; Munari et al., 2005), and compared them with the observed measurements given by three empirical libraries (Valdes et al., 2004; Sánchez-Blázquez et al., 2006; Prugniel & Soubiran, 2001). The measured indices cover the wavelength range from 3500 to 8700 . We found that the direct comparison between models and observations is not a simple task, given the uncertainties in parameter determinations of empirical libraries. Taking that aside, we found that in general the three libraries present similar behaviours and systematic deviations. For stars with Teff 7000K, the library by Coelho et al. (2005) is the one with best average performance. We detect that lists of atomic and molecular line opacities still need improvement, specially in the blue region of the spectrum, and for the cool stars (Teff 4500K).
keywords:
stars:atmospheres; stars:evolution; stars:general1 Introduction
Evolutionary population synthesis models describe the spectral evolution of stellar systems, and are fundamental tools in the analysis of both nearby and distant galaxies (e.g. Bruzual & Charlot, 2003; Cerviño & Mas-Hesse, 1994; Fioc & Rocca-Volmerange, 1997; Leitherer et al., 1999; Vazdekis, 1999; Buzzoni, 2002; Jimenez et al., 2004; Le Borgne et al., 2004; Delgado et al., 2005; Maraston, 2005; Schiavon, 2006). They are needed to derive the star formation history and chemical enrichment in a variety of systems, from early type galaxies and spiral bulges to star forming galaxies at different redshifts.
Libraries of stellar spectra are one of the main ingredients of stellar population models, and both empirical and theoretical libraries have improved dramatically in recent years, allowing the construction of more detailed models. Observations are also becoming increasingly better and demanding more from the modelling point of view.
Recently, many new empirical libraries suitable to stellar population synthesis have been made available with improved spectral resolution and parameter coverage: e.g. STELIB (Le Borgne et al., 2003), UVES POP (Jehin et al., 2005), Indo-US (Valdes et al., 2004), Elodie (Prugniel & Soubiran, 2001), MILES (Sánchez-Blázquez et al., 2006), and NGSL (Gregg et al., 2004).
The choice of using either an empirical or a synthetic library in stellar population models is a subject of debate. Many aspects are important when considering a library for stellar population synthesis, and parameter coverage is one of the main issues. A good parameter coverage is not trivial for empirical libraries, which are limited to whatever is possible to obtain given observational constraints (resolution, wavelength coverage, exposure time, etc.). They have to cover not only a good wavelength range (which limits the spectral resolution), but also cover from cool to hot stars, dwarfs and giants, and different chemical abundances.
Amongst the synthetic libraries, perhaps the most widely used is the flux distribution predicted by the Kurucz (1993) model atmospheres. The BaSeL library (Lejeune et al., 1997, 1998; Westera et al., 2002) extended these flux distributions including spectra of M stars computed with model atmospheres by Fluks et al. (1994), Bessell et al. (1989, 1991) and Allard & Hauschildt (1995). However the spectral resolution of the BaSeL library is limited to 20 , which is by far lower than the modern observed spectra of both individual stars and integrated stellar populations. Resolution ceased to be a limitation recently, with many high-resolution theoretical libraries appearing in the literature (Chavez et al., 1997; Barbuy et al., 2003; Bertone et al., 2003; Lanz & Hubeny, 2003a; Zwitter et al., 2004; Murphy & Meiksin, 2004; Coelho et al., 2005; Gustafsson et al., 2003; Brott & Hauschildt, 2005; Rodríguez-Merino et al., 2005; Malagnini et al., 2005; Martins et al., 2005; Munari et al., 2005; Frémaux et al., 2006). Many of these libraries were created with refined and updated line lists, state of the art model atmospheres and spectral synthesis codes, and a very extensive parameter coverage. A qualitative comparison of some of the recent high resolution synthetic libraries is given by Bertone (2006).
The major concern when using synthetic libraries for high resolution stellar population models is to know whether a synthetic library can safely replace an empirical one. These libraries are based on model atmospheres and therefore are limited to the approximations adopted in the computations. Ideally, one would like to generate models that accounts for all the effects taking place across the HR diagram: non-Local Thermodynamic Equilibrium (NLTE), line-blanketing, sphericity, expansion, non-radiative heating, convection, etc. Such an approach is unfeasible at present time, even if the astrophysical models were available. What is usually done is to take some of these effects into account where they matter the most. The hardest stars to reproduce in this sense are the very hot and very cool stars, where extreme scenarios take place (e.g. non-LTE effects for very hot stars, and sphericity for cool giants). Additionally, computing reliable high-resolution synthetic spectra is a very challenging task, since it requires building an extensive and accurate list of atomic and molecular line opacities.
Nevertheless, synthetic libraries overcome limitations of empirical libraries, for instance their inability to cover the whole space in atmospheric parameters, and in particular abundance patterns that differ from that of the observed stars (mainly from the solar neighbourhood, and in some few cases from the Magellanic Clouds). Therefore, population models based solely on empirical libraries cannot reproduce the integrated spectra of systems that have undergone star formation histories different than the Solar Neighbourhood.
With so many different choices for the stellar library, the stellar population modeller might feel lost about which library should be used. It is certain that each of these libraries have its own strengths and weaknesses, but identifying them is not always trivial. We propose in this work to make a detailed comparison between some of the major synthetic stellar libraries available, comparing them against empirical libraries.
This paper is organised as follows: in §2 we present an overview of theoretical libraries. In §3 the model predictions of three sets of model atmospheres (Castelli & Kurucz, 2003; Gustafsson et al., 2003; Brott & Hauschildt, 2005) for broad-band colours are compared to the empirical UBVRIJHK relation from Worthey & Lee (2007). In §4 we compare model spectral indices predicted by three recent high-resolution libraries (Coelho et al., 2005; Martins et al., 2005; Munari et al., 2005) to indices measured in the empirical libraries by Valdes et al. (2004); Sánchez-Blázquez et al. (2006); Prugniel & Soubiran (2001).
For the purpose of the present work, we focus our comparisons on the solar metallicity regime, where the completeness of the empirical libraries is higher, as well as the accuracy of the stellar atmospheric parameters. Our conclusions and discussions are presented in §5.
2 Overview of the Theoretical Libraries
The nomenclature used by atmosphere and synthetic spectra modellers are sometimes confusing for the stellar population models users.
By model atmosphere we mean the run of temperature, gas, electron and radiation pressure, convective velocity and flux, and more generally, of all relevant quantities as a function of some depth variable (geometrical, or optical depth at some special frequency, or column mass). The flux distribution or synthetic spectra is the emergent flux predicted by a model atmosphere, and is required for comparison with observations.
It is convenient from the computational point of view to split the calculation of a synthetic spectra in two major steps: the calculation of the model atmosphere, commonly adopting Opacity Distribution Function technique (ODF, Strom & Kurucz, 1966) and the calculation of the emergent flux with a spectral synthesis code.
Alternatively, model atmosphere codes that use an Opacity Sampling (OS) method to account for the line absorption (e.g. Johnson & Krupp, 1976) can directly produce as output a well sampled flux distribution. The OS technique is more time consuming from the computational point of view then the ODF technique, but allows for a much larger flexibility in modelling. For example, peculiar chemical compositions can be easily consideredthat’.
The majority of model atmospheres available are 1D and hydrostatic, assume LTE and treat convection with the mixing length theory. The mixing length theory was introduced in ATLAS6 code by Kurucz (1979), and is a phenomenological approach to convection in which it is assumed that the convective energy is transported by eddy “bubbles” of just one size. t requires an adjustable parameter , which represents the ratio between the characteristic length (distance travelled by an element of fluid before its dissolution) and the scale height of the local pressure (Hp). The parameter has to be set at different values to fit different types of observations (Steffen & Ludwig, 1999), and no single value works well in all classes. An alternative convective model is Full Spectrum Turbulence, introduced by Canuto & Mazzitelli (1991) and adopted, for example, by NeMo grid of atmospheres (Heiter et al., 2002).
Throughout this paper we further distinguish a flux distribution from a synthetic spectrum. The flux distribution is the spectral energy distribution predicted directly by a model atmosphere, and is commonly available together with the model atmospheres. This is the case, for example, of the synthetic libraries by Castelli & Kurucz (2003), Brott & Hauschildt (2005) and Gustafsson et al. (2003).
By synthetic spectrum we mean the flux calculated by a line profile synthesis code, using as input a model atmosphere and a refined atomic and molecular line list, that can be at some extend different from the line list adopted in the model atmosphere computation. It can also adopt different chemical compositions than the model atmosphere in order to account for small variations in the abundance pattern (as long as the difference is not enough to produce important changes in the structure of the atmosphere). This is the method commonly used in high resolution stellar spectroscopy studies, and it is the case of the libraries from Coelho et al. (2005), Martins et al. (2005) and Munari et al. (2005). A synthetic spectrum is usually computed at a higher resolution than a model atmosphere flux distribution, given that it aims at resolving individual line profiles.
Additionally, a theoretical library that is intended to produce accurate high resolution line profiles is not generally a library that also predicts good spectrophotometry. That happens because usually only the lower lying energy levels of atoms have been determined in laboratory. If only those transitions are taken into account in a model atmosphere, the line blanketing would be severely incomplete. To avoid this deficiency and to improve both the temperature structure of the model atmospheres and the spectrophotometric flux distributions, the computation requires accounting for lines where one or both energy levels have to be predicted from quantum mechanical calculations. These so-called “predicted lines” (hereafter PLs, Kurucz, 1992) are an essential contribution to the total line blanketing in model atmospheres and flux distribution computations. But as the theoretical predictions are accurate to only a few percent, wavelengths and computed intensities for these lines may be largely uncertain. As a consequence the PLs may not correspond in position and intensity to the observable counterparts (Bell et al., 1994; Castelli & Kurucz, 2004a), “polluting” the high resolution synthetic spectrum. Therefore, synthetic libraries that are aimed at high resolution studies do not include the PLs, and thus they provide less accurate spectrophotometric predictions when compared to the flux distributions libraries.
For this reason we divided the comparisons of the present paper in two different sections. Section 3 studies the flux distributions given by some model atmosphere grids in order to assess the ability of those models in predicting broad-band colours. In Section 4 we change our focus to libraries that aim at high resolution studies, testing their ability to reproduce higher resolution spectral features. The grids evaluated in the present work are briefly described below.
2.1 Model atmosphere flux distributions
Amongst several model atmosphere grids available in literature (e.g. Kurucz, 1993; Hauschildt et al., 1996; Pauldrach et al., 2001; Heiter et al., 2002; Lanz & Hubeny, 2003b), we selected three grids that cover a large parameter space in effective temperatures Teff and superficial gravities log g: Castelli & Kurucz (2003, hereafter ATLAS9), Gustafsson et al. (2003, hereafter MARCS) and Brott & Hauschildt (2005, hereafter PHOENIX).
Based on Kurucz (1993) codes, the ATLAS9 model atmospheres follow the classical approximations of steady-state, homogeneous, LTE, plane-parallel layers that extend vertically through the region where the lines are formed. In its more recent version (Castelli & Kurucz, 2003)111http://wwwuser.oat.ts.astro.it/castelli/grids.html, is assumed to be 1.25 to fit the energy distribution from the centre of the Sun. All models are computed with the convection option switched on and with the overshooting option switched off. The convective flux decreases with increasing Teff and it naturally disappears for Teff 9000K. The models are available in the range 3500K Teff 50000K.
Plane-parallel LTE models will fail wherever sphericity (specially important for giant stars) and non-LTE effects (for very hot stars) are evident. Two models that take sphericity into account are PHOENIX and MARCS.
PHOENIX (Hauschildt et al., 1996) is a multi-purpose stellar model atmosphere code for plane-parallel and spherical models. The original versions of PHOENIX were developed for the modelling of novae and supernovae ejecta (Hauschildt et al., 1999, and references therein). The most recent grid is presented in Brott & Hauschildt (2005)222ftp://ftp.hs.uni-hamburg.de/pub/outgoing/phoenix/GAIA. The equilibrium of Phoenix is solved simultaneously for 40 elements, with usually two to six ionisation stages per element and 600 relevant molecular species for oxygen-rich ideal gas compositions. The chemistry has been gradually updated with additional molecular species since the original code. The convective mixing is treated according to the mixing-length theory, assuming = 2.0. Both atomic and molecular lines are treated with direct opacity sampling method. PHOENIX models cover the range 2000K Teff 10000K.
MARCS models have undergone several improvements since the original code by Gustafsson et al. (1975), the most important ones being the replacement of the ODF technique by OS technique, the possibility to use a spherically symmetric geometry for extended objects, and major improvements of the line and continuous opacities (Plez, 1992). The common assumptions of spherical or plane-parallel stratification in homogeneous stationary layers, hydrostatic equilibrium and LTE are made. Energy conservation is required for radiative and convective flux, where the energy transport due to convection is treated through the local mixing-length theory by Henyey et al. (1965). The mixing-length l is chosen as 1.5Hp, which is a reasonable quantity to simulate the temperature structure beneath the photosphere (Nordlund & Dravins, 1990). The most recent version of the MARCS grids is presented in Gustafsson et al. (2003)333http://marcs.astro.uu.se/. The models cover 4000 Teff 8000K and adopt plane-parallel geometry for the dwarfs (log g 3.0) and spherical geometry for the giants (log g 3.5; both geometries are available for log g values of 3.0 and 3.5).
The three sets of models adopt a micro-turbulent velocity of 2 km s-1 and are computed for 1 solar mass.
2.2 High resolution synthetic spectral libraries
Amongst the higher resolution synthetic libraries, we selected three of the most recent ones which are publicly available, each of them with an outstanding improvement compared to previous ones. Munari et al. (2005, hereafter Munari)444http://archives.pd.astro.it/2500-10500/ has an impressive coverage of the HR diagram. Their models are based on Kurucz (1993) codes and ATLAS9 grid, covering 2500 10500 in wavelength range at a maximum resolution of R=20000. They range from 3500 K to 47500 K in Teff, with log g varying between 0.0 and 5.0 dex, for different values of metallicity, -enhancement, rotational velocity and micro-turbulent velocity.
The library by Coelho et al. (2005, hereafter Coelho)555http://www.mpa-garching.mpg.de/PUBLICATIONS/DATA/SYNTHSTELLIB/synthetic_stellar_spectra.html, also based on ATLAS9 model atmospheres, had a special care for low temperature stars, employing a detailed and calibrated line list that has been improved along the years (see the original paper for a list of references). Their models cover from 3000 to 1.8 spanning from 3500 K to 7000 K, with log g varying between 0.0 and 5.0 dex, also covering different metallicities and -enhancement.
Martins et al. (2005, hereafter Martins)666http://www.astro.iag.usp.br/lucimara/library.htm searched the literature for the best available codes for each range of temperatures and used them to build the models. They used Hubeny (1988), Hubeny & Lanz (1995), Lanz & Hubeny (2003a) model atmospheres considering non-LTE for hot stars, ATLAS9 models for intermediate temperature stars and PHOENIX line-blanketed models for very cool stars. The library covers from 3000 to 7000 , with temperatures ranging from 3000K to 55000K and log g from -0.5 to 5.5 dex, for 4 different metallicities (but no -enhancement).
3 Evaluating the Flux Distributions: Broad band colours
A convenient way of comparing the flux distributions given by the model grids with observations is through broad-band colours, which are likely to be the first observables expected to be predicted by spectral stellar population models.
In order to do this comparison, we selected pairs of Teff and log g that are representative of an isochrone of a young and an old population (10 Myrs and 10 Gyrs). The pairs were selected to uniformly cover Teff, respecting the spacing of each set of models (ATLAS9 and MARCS have steps of 250K, and PHOENIX has steps of 200K). The isochrones adopted are the ones by Girardi et al. (2002), for solar metallicity composition. The transformation to observed colours were done adopting the UBVRIJHK empirical calibration by Worthey & Lee (2007, hereafter WL07) 777Colour-temperature table and interpolation program available at http://astro.wsu.edu/models/. In that work, the authors used stars with measured photometry and known metallicity [Fe/H] to generate colour-colour relations that include the abundance dependence. They further added colour-temperature relations until the whole parameter range was covered, taking medians in regions where more than one relation applied. The colourTeff relations were obtained from several sources in literature, mainly from empirical work, but also from theoretical work. At both ends of the Teff range, the relations were taken purely from empirical sources; in the middle range, the theoretical relations by VandenBerg & Clem (2003) for V-I were added, and behaved well compared to empirical ones. Any other theoretical relation employed was used with a lesser weight (G. Worthey, priv. comm. See also Figures 7 and 8 in WL07). Therefore, we expect the relations by WL07 to be a close match to observations, and that the theoretical relations, which could bias our comparisons, do not have an important weight.
The magnitudes predicted by ATLAS9, MARCS and PHOENIX grids were measured using the IRAF task sbands, adopting the filter transmission curves of the photometric systems adopted in WL07. Zero point corrections were applied to the model magnitudes using the Vega model by Castelli & Kurucz (1994)888Available at http://wwwuser.oat.ts.astro.it/castelli/vega.html, and adopting Vega magnitudes : UJohnson = 0.02, BJohnson = 0.03, VJohnson = 0.03, R, I, J, H, K.
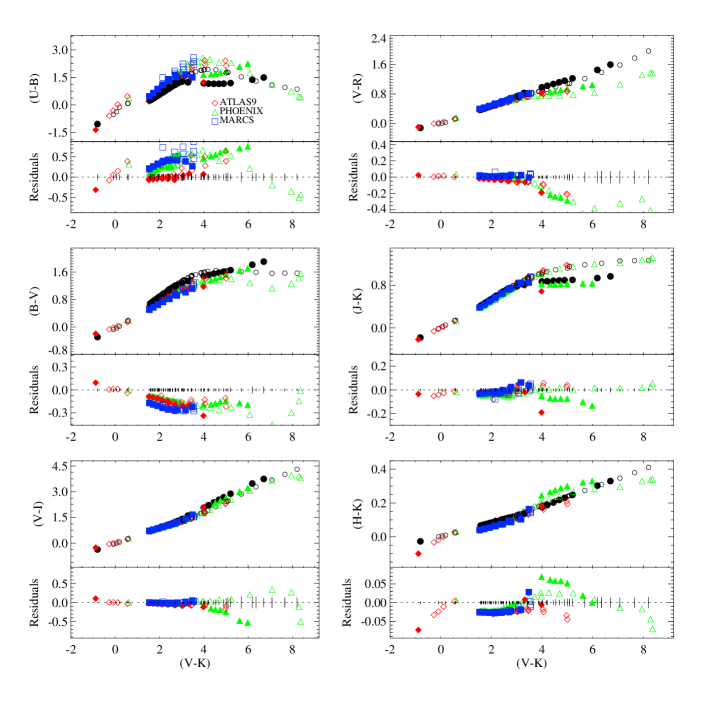
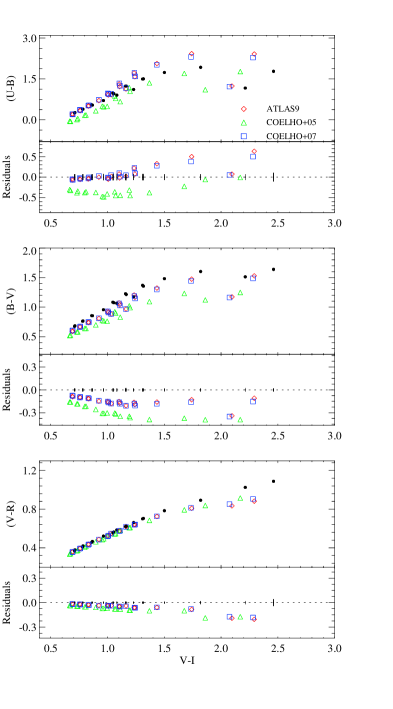
The comparison between the empirical relation and the model predictions are given in Figures 1 and 2 for the 10 Myrs and 10 Gyrs isochrones respectively. The empirical relation is presented as black circles. ATLAS9 predictions are given in red diamonds, blue squares are predictions for MARCS models, and green triangles for PHOENIX. Filled and open symbols represent dwarfs (log g 3.0) and giant stars (log g 3.0), respectively.
The results are presented in colour-colour relations where on the axis is shown the (V-K) colour, which is a good tracer of Teff (higher values of Teff correspond to lower values of V-K). The six panels in each figure show different colours in the axis. The residuals (model minus empirical) between the model colours and the WL07 calibration for each Teff, log g pair is shown below each colour-colour panel, where the error bars indicate the uncertainties of the WL07 calibration.
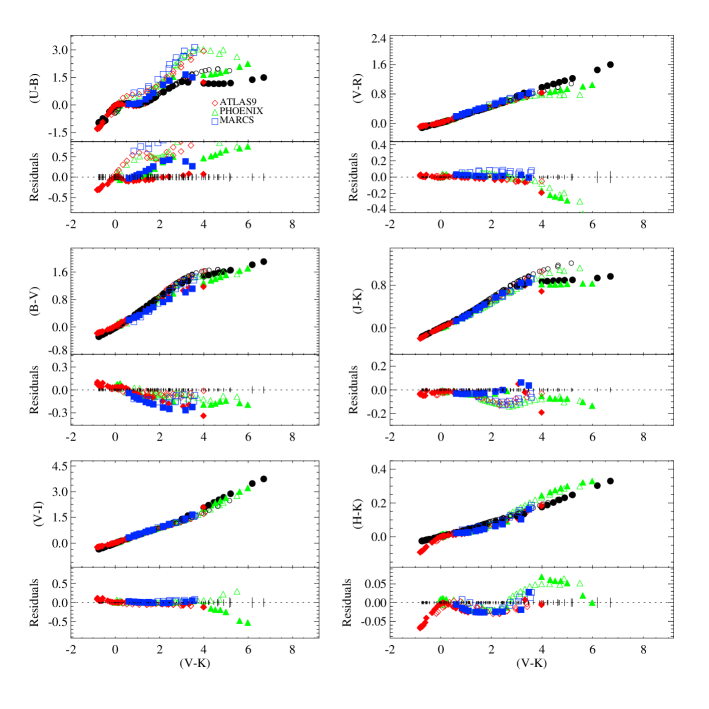
For stars 4000 K Teff 8000 K, which is the interval that is common to all sets of models, we present in Tables 1 and 2 the average absolute differences between model and empirical relations, for the 10 Gyrs and 10 Myrs populations respectively.
It can be seen from Figures 1 and 2 that the three set of models show a similar behaviour among themselves for a large range in Teff (V-K), and are a good reproduction of the empirical relation for the colours V-I, V-R and J-K. The residuals are larger for cooler stars (V-K 3), for all colours. There is a tendency in all models to under-predict the B-V and H-K colours. The colour where the models differ more strongly is U-B: in the case of Figure 2 (10 Gyrs isochrone), we note that in the range 1 V-K 3 (which mainly represents the turn-off stars) ATLAS9 models reproduce considerably better the observations than either PHOENIX or MARCS. The situation is more complex for the same colour in the young population (Figure 1) and all residuals are larger, specially for the giants. In the case of the dwarfs, ATLAS9 is still the set of models that best reproduces the empirical relation. The differences are typically smaller for the visual colours, and for V-I and V-R colours ATLAS9 presents on average higher residuals than MARCS or PHOENIX, likely due to the different implementations of molecular opacities. For the near-infrared colours, the behaviour is quite similar for the three sets of models.
The reason for the large difference in the U-B colour is unclear to the present authors. Differences in the implementation of both line blanketing and continuum opacities, and also differences in calibration of the convection treatment might be playing a role. The effect of both line blanketing and continuum opacities in the near-UV and UV fluxes is a long standing (and sometimes confusing) problem. Each set of models has its particular implementation, and we refer the reader to Houdashelt et al. (2000); Allende Prieto & Lambert (2000); Peterson et al. (2001); Allende Prieto et al. (2003); Castelli & Kurucz (2004b); García-Gil et al. (2005) and references therein for appropriate discussions on the subject. The effect of the convection treatment on broad-band colours have been discussed, for example, in Heiter et al. (2002), and indeed we note that the three sets of models present different values of the mixing length parameter . However, Kučinskas et al. (2005) have shown that the effect of different is not significant, and important effects appear only when more realistic 3D computations take place. Nevertheless, they focused their analysis in late-type giants, and therefore it remains an open question if different could explain the differences we see here for the parameters typical of turn-off stars.
Concerning the cooler stars, usually around V-K 3 (Teff 4250K) the models start to deviate from the empirical relation. It is interesting to see that the model predictions are not strikingly different among the sets of models analysed here (at least for Teff 3500K), even though ATLAS9 models are computed in plane-parallel geometry and PHOENIX models in spherical geometry (MARCS models present both geometries). Kučinskas et al. (2005) present a very detailed analysis of broad-band colours for late-type giants, and test the effect of several model parameters on the broad-band colours predictions (namely molecular opacities, micro-turbulent velocities, stellar mass and treatment of convection). Those authors note that it is possible that spherical models may not be sufficient, and additional effects as convection, variability and mass loss, become increasingly important for cooler stars.
| Colour | ATLAS9 | MARCS | PHOENIX | Mean error |
|---|---|---|---|---|
| UB | 0.370 | 0.695 | 0.611 | 0.073 |
| BV | 0.070 | 0.145 | 0.066 | 0.020 |
| VI | 0.041 | 0.029 | 0.010 | 0.015 |
| VR | 0.022 | 0.045 | 0.026 | 0.012 |
| JK | 0.049 | 0.056 | 0.079 | 0.013 |
| HK | 0.018 | 0.016 | 0.019 | 0.004 |
| Colour | ATLAS | MARCS | PHOENIX | Mean error |
|---|---|---|---|---|
| UB | 0.105 | 0.440 | 0.309 | 0.073 |
| BV | 0.146 | 0.235 | 0.126 | 0.020 |
| VI | 0.048 | 0.015 | 0.009 | 0.015 |
| VR | 0.038 | 0.017 | 0.016 | 0.012 |
| JK | 0.023 | 0.027 | 0.034 | 0.013 |
| HK | 0.024 | 0.022 | 0.018 | 0.004 |
4 Evaluating the high resolution features: Spectral indices
A convenient way to evaluate the theoretical spectra is to measure widely used spectral indices and compare them with the observed values. This approach will not evaluate the quality of the model spectrum at its full wavelength coverage, but allows a presentation of the results in a scale that is familiar to the user of stellar population models.
We compared Coelho, Martins and Munari libraries with three of the most complete empirical libraries available: Indo-US, MILES and Elodie.
4.1 Overview of the Empirical Libraries
The first empirical stellar library that provided flux calibrated spectra was presented in Jones (1998). With moderately high resolution (1.8 ), this library was used by Vazdekis (1999) to produce for the first time spectral stellar population models at high resolution. However, Jones library is limited to two narrow wavelength regions (3820-4500 and 4780-5460 ), and it’s sparse in dwarfs hotter than about 7000 K and metal-poor giants.
STELIB999http://www.ast.obs-mip.fr/users/leborgne/stelib/index.html (Le Borgne et al., 2003) represents a substantial improvement over previous libraries. It consists of 249 stellar spectra in the range of 3200 to 9500 , with an spectral resolution of about 3 (R=2000). This is the base library for the widely used Bruzual & Charlot (2003) stellar population models.
Following this work, Valdes et al. (2004) published Indo-US 101010http://www.noao.edu/cflib, a library with resolution down to FWHM 1 and a good coverage of the colour magnitude diagram. Indo-US has a much higher number of stars (1273), with spectra ranging from 3460 to 9464 . They cover a fair range in atmospheric parameters. The main concern on this library regards its spectrophotometry, which was obtained by fitting each observation to a standard spectral energy distribution with a close match in spectral type, using the compilation of Pickles (1998).
Prugniel & Soubiran (2001) published the ELODIE Library111111http: //www.obs.u-bordeaux1.fr/m2a/soubiran/elodie_library.html, which has been updated since then. In its current version (Elodie.3) there are 1388 starts, in the wavelength range 4000 to 6800 . Although it has a more limited wavelength coverage with respect to the others, it has a very high spectral resolution (R=10000 for flux calibrated spectra and R=42000 for flux normalised to the pseudo-continuum). But the flux calibration of this library might be compromised by the use of an echelle spectrograph.
Another library that became available recently is MILES121212http://www.ucm.es/info/Astrof/miles/miles.html (Sánchez-Blázquez et al., 2006; Cenarro et al., 2007). The spectra ranges from 3525 to 7500 , at a 2.3 (FWHM) resolution. This library, with 985 stars, was carefully created trying to fill the major gaps that existed in other empirical libraries.
The Next Generation Stellar Library (NGST, Gregg et al. 2004) is yet another library soon to be publicly available, which is an UV/optical (from 1660 to 10200 ) stellar spectral atlas using STIS-HST (PID 9786). The advantage of this library is that, being obtained with STIS at Hubble Space Telescope, it presents an unprecedented internally consistent flux calibration across all wavelengths.
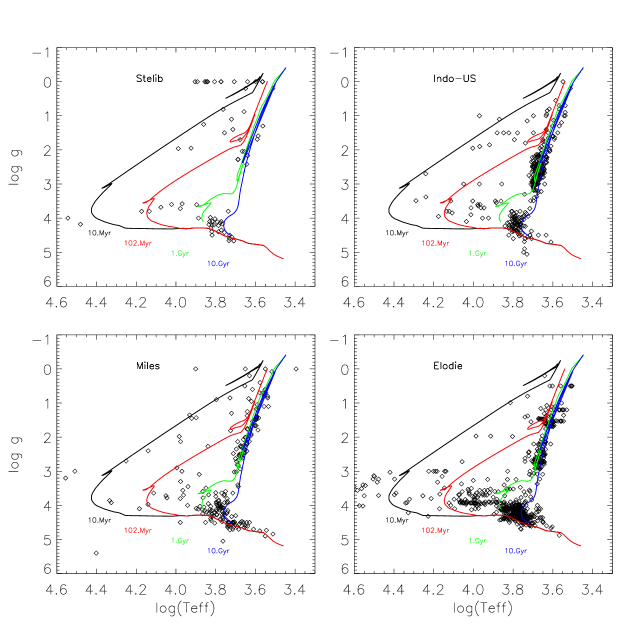
Figure 3 shows the coverage in temperature and gravity of four empirical libraries (STELIB, Indo-US, MILES and ELODIE), overplotted on isochrones from Girardi et al. (2002) for ages 10 Myrs, 100 Myrs, 1 Gyrs and 10 Gyrs. All isochrones are for solar metallicity, which is the regime where the empirical libraries are more complete. The stars plotted are the ones with metallicity in the range -0.1 [Fe/H] 0.1. It is clear that libraries have been improving in terms of parameter coverage, but this is a hard task and some holes still exist. Hot stars are missing in most of the libraries, being really sparse towards O and B stars. Libraries tend to have the majority of stars for temperatures between 5000 K and 7000 K and there is a sudden drop for lower temperatures, specially below 4000 K. MILES has the best coverage for lower temperatures, while ELODIE is the most complete in the high temperature end. STELIB has only one O star, and only one dwarf below 4000K. Indo-US has no stars with Teff 27000K, and no dwarf below 4000K.
4.2 Spectral indices comparison
A total of thirty-five spectral indices were measured in the spectra of the three high resolution synthetic libraries to be studied (Coelho, Martins and Munari), and on three of the empirical libraries (Indo-US, ELODIE and MILES). We selected all the Lick/IDS indices as defined by Worthey et al. (1994) and Worthey & Ottaviani (1997). We extended the wavelength coverage adding the index D4000 (Balogh et al., 1999), some indices defined in Serven et al. (2005) and the near infrared indices by Diaz et al. (1989). The indices cover the wavelength region 3500 to 8700 and are summarised in the Appendix (Table A1). All the indices except D4000 are defined by a central bandpass bracketed by two pseudo-continua bandpasses, which are used to draw a straight line to determine the continuum level at the feature. Atomic features are expressed in angstroms and molecular features in magnitudes. D4000 is defined using 100 continuum bandpasses to measure the break (3850 - 3950 and 4000 - 4100 ).
We compared each synthetic library to each empirical library. For each empirical library, we selected all stars with metallicity in the range -0.1 [Fe/H] 0.1. For each star, the closest model in Teff and log g ([Fe/H] = 0.0) was selected in each of the synthetic libraries. The closest model was chosen based on the smaller distance (d) to the Teff log g plane, defined in equation 1, where Teff and log g are parameters of the models, and Tobs and (log g)obs are parameters of the empirical libraries.
| (1) |
The typical parameter spacing of the models (250K in Teff and 0.5 dex in log g) is of the same order of the accuracy of the atmospheric parameters in the empirical libraries. Therefore, we believe the closest model is a reasonable approach. The theoretical libraries were degraded to the resolution of each empirical library prior to the measurements of the indices. The exception was the ELODIE library, whose superior resolution could only be matched by Coelho library. In this case the theoretical libraries and ELODIE were degraded to a common resolution of FWHM = 0.3.
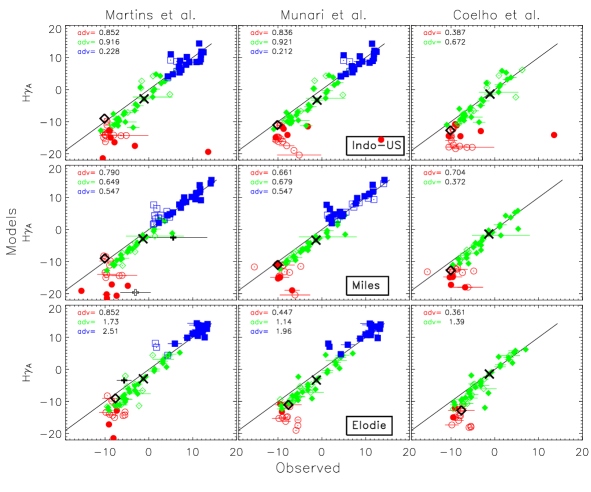
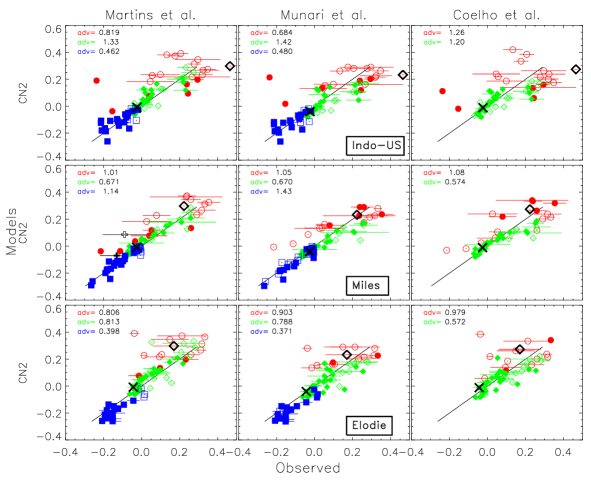
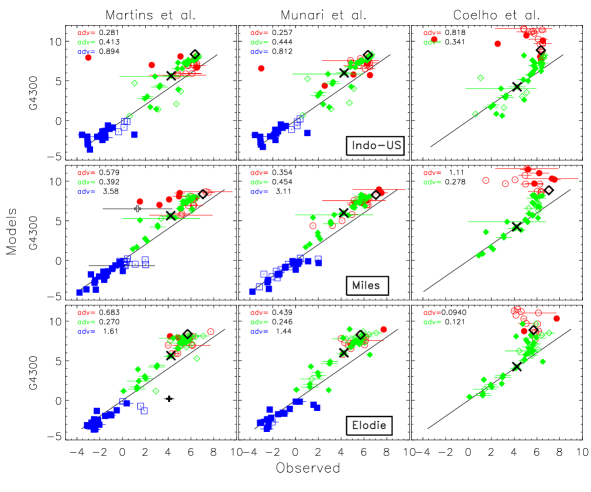
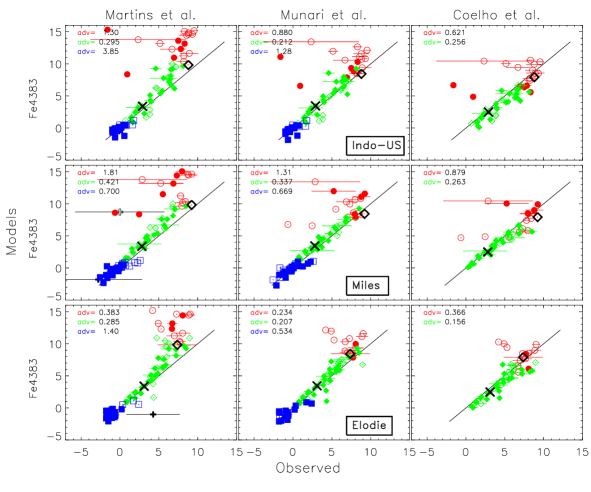
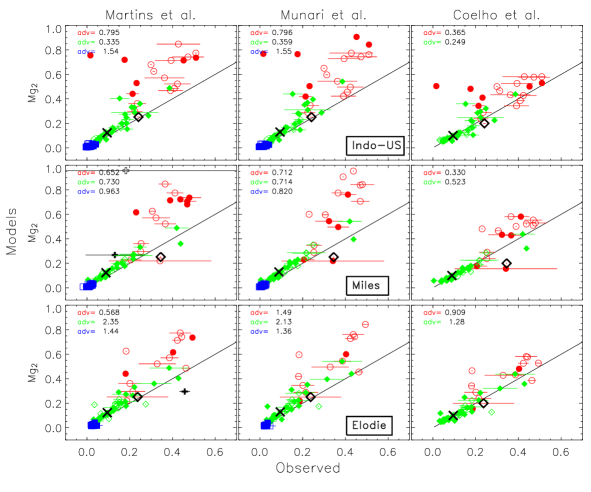
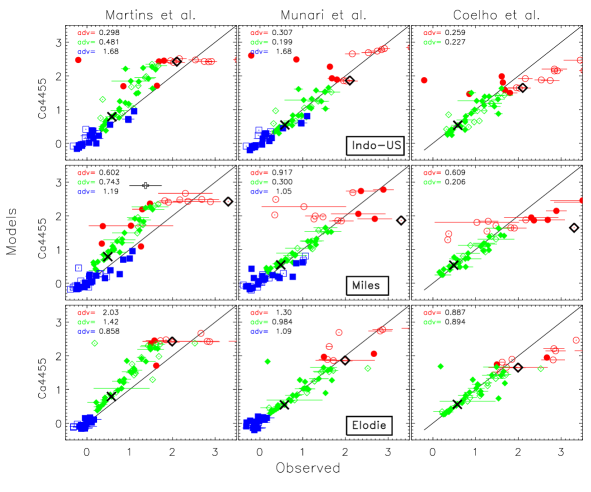
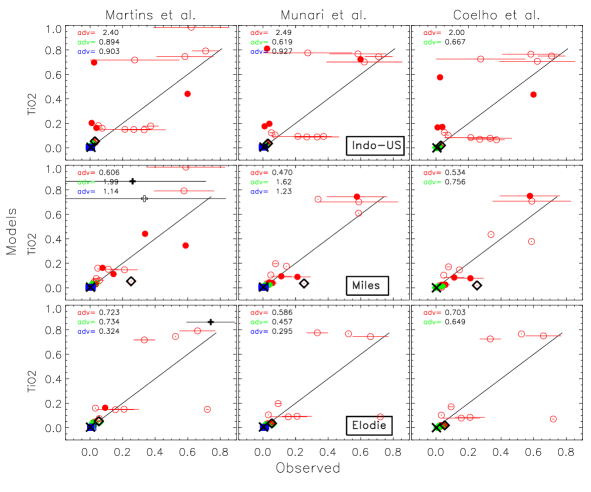
Figures for all the comparisons are presented in the Appendix (on-line material). Figures 4 to 10 show the results for some of the indices. The data points on the figures are the median values for each Teff and log g bin in the empirical libraries, and the error bars are the correspondent one sigma dispersion of the empirical measurements for that parameter bin. A point with no error bar implies that there was only one star for that Teff and log g bin. We colour coded the stars in three Teff intervals: blue squares are stars with Teff 7000K, green diamonds are stars with 4500K Teff 7000K, and red asterisks are stars with Teff 4500K. The black crosses are stars with Teff 3500 K, but they are really rare. We also separated them by gravity: dwarf stars (log g 3.0) are represented by filled symbols and giant stars (log g 3.0) are represented by open symbols. The black line in each plot shows the one to one relation. The thick black symbols indicate the location of a Sun-like dwarf (cross; Teff = 5750K and log g = 4.5), and a typical K1 giant (diamond; Teff = 4250K and log g = 1.5). The K1 giant have all parameters but metallicity close to the star Arcturus. We show the position of these particular stars on the plots because line lists are usually calibrated based on their high resolution spectra. Also shown in each plot is the adev value for each temperature range, a statistical measurement of how much each model is representing the stars in that range. takes into account the distance of each theoretical point from the one-to-one line in the index plots, and is defined as:
| (2) |
where N is the number of stars, It is the measure of the index on the theoretical library and Ie is the measure of the index on the empirical library.
First thing to notice in these plots is that the error bars are non-negligible, specially for the low temperature stars. This is a consequence of the large uncertainties in the atmospheric parameters of these stars. The determination of those parameters in cool stars is known to be a real challenge. For the high temperature stars it is clear that the spread between each point is very small for most of the indices. This is somewhat expected, since there are fewer metallic lines as you go up in temperature, and therefore many of these indices will give essentially no information in this case.
We organised the analysis grouping the results in four categories, related to the chemical species that dominate the index. It is worth remember that no index is sensible to only one element (see e.g. tables at Serven et al., 2005), but we attempted to categorise the indices by its main element.
Balmer lines: Include the indices H, H and H. In general the hydrogen indices are well reproduced by all models down to 4500K. For the very low temperature stars, models start to deviate from observational libraries, clearly subestimating the indices, as shown in Figure 4 for H. It is known that Hydrogen lines computed in LTE match well the wings, but cannot reproduce the core of the lines. Fine tuned micro turbulence velocities or mixing length to pressure scale height ratio /Hp were suggested in literature to improve the match in the solar spectrum (e.g. Fuhrmann et al., 1993; van’t Veer-Menneret & Megessier, 1996), but the same parameters would not necessarily improve the results for other spectral types. A realistic match would require NLTE computations of H lines, only available for very hot stars. Besides, the bottom of the hydrogen lines form in the chromosphere, not included in the model atmospheres grids. Another point to note is that although theses indices are aimed at measuring H lines, in low temperature stars the actual hydrogen lines are considerably weak, and the metallic lines can be dominating the index. In this case, it is not clear if the main reason why the models are failing in reproducing the observed values is because of the non-satisfactory line core modelling, or because the dominance of uncalibrated metallic lines.
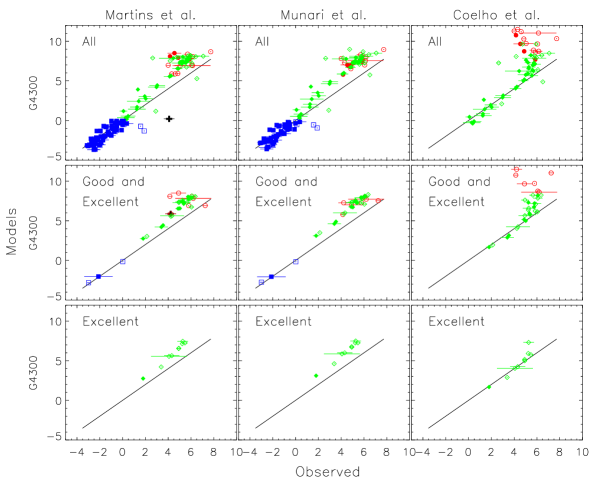
C and N indices: Include the indices CNO3862, CN1, CN2 and G4300. According to Tripicco & Bell (1995) calculations, the indices Ca4227 and Fe4668 are also highly sensitive to Carbon abundance variations, and therefore these two indices could be possibly included in this group. ¿From these indices, the sub-sample that is sensitive to both C and N abundances (CNO3862, CN1, CN2) show significant larger error bars, but the overall behaviour seem to be well matched by the models. Figure 5, that shows the CN2 index, illustrates this effect. On the other hand, indices that are mainly sensitive to C abundance variations (G4300, Ca4227 and Fe4668) systematically deviate from the one to one line for stars cooler than Teff = 4500K. Figure 6 shows the G4300 index, which measures the G-band of CH at 4300. One possible reason for this effect is that the C and N abundances relative to Fe were assumed to be solar for all synthetic stars, but it is well known that the CNO-cycle lowers the C abundance and enhances the N abundance in giants (e.g. Iben, 1967; Charbonnel, 1994). The same effect on the indices CN1 and CN2 would not be so clearly seen if the variations of C and N somewhat compensate each other. Nevertheless, we could not clearly attribute all the differences in these indices to the un-modelled CNO mixing. If the modelling of the CNO cycle was to be the only or major problem affecting the cool giants, we would expect the dwarfs (filled symbols; see e.g. Figure 6) to be a closer match to the observations than the giants (open symbols). This is not the case, both presenting similar patterns. Interestingly, for temperatures between 4500K and 7000K, Coelho models reproduces considerably better the observations, while the cool end deviates more strongly than the other synthetic libraries. This is probably because the CH lines adopted by Coelho models were computed with LIFBASE code (Luque & Crosley, 1999) while Martins and Munari models adopt Kurucz (1993) molecular lines. This is a first indicative of how working on the line lists might impact the model results in significant ways.
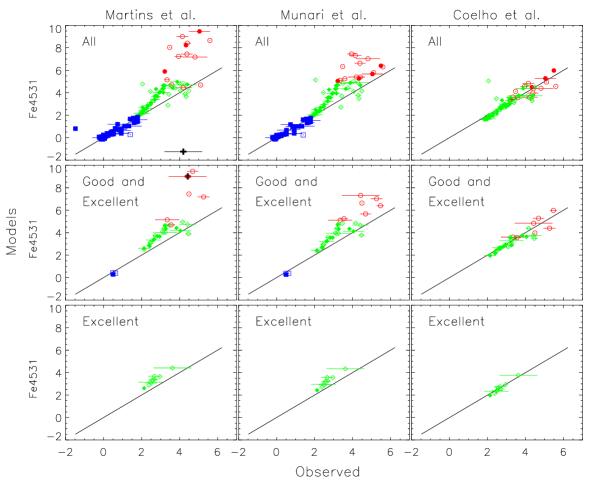
Iron peak elements: Many of the iron indices are good examples suggesting that working on the line lists might improve the model results significantly. Figure 7 shows the behaviour of the index Fe4383, where this effect is evident. Martins and Munari models have similar line lists, modified from the same Kurucz (1993) original work, while Coelho models employed its independent line list, based on high resolution stellar spectroscopy studies. The effect of the different line lists is clearly seen.
elements: Include all the indices sensitive to Mg, Ca, Ti and O. In this case there is not a general pattern. Figure 8 shows the Mg2 index where the line list from Coelho reproduces significantly better the observed values, specially in the low temperature regime. But it is interesting to point out that for stars cooler than Teff 4250K, this index is heavily contaminated by TiO molecular features (see Figure 13 in Coelho et al., 2005). The Calcium and TiO indices, on the other side, are examples of how things can be complex. Figure 9 shows the index Ca4455. Coelho models tend to predict slightly lower values than the observed. Munari models seem to show the same trend, to a lower level. At first order we could conclude that both models are under-predicting this index, but Bensby et al. (2005) studied F and G dwarfs from the thin and thick disc of our galaxy and found that the [Ca/Fe] tend to be slightly super-solar for stars with [Fe/H] solar. In the likely case that the stars in the empirical libraries show a similar behaviour than the one found by Bensby et al. (2005), we should not expect the models, calculated with solar mixture ([Ca/Fe]=0), to actually match the observations. In this case, the behaviour of both Coelho and Munari models are consistent with the observations. Martins models show a more complex behaviour: intermediate temperature stars, which were computed with SPECTRUM synthesis code and line lists and ATLAS9 models, are overestimated; low temperature stars, calculated with PHOENIX models and line lists, are underestimated. Figure 10 shows the TiO2 index. This index has no meaning for stars with temperatures higher than 4500K, where there is no TiO in the spectrum to be measured. For lower temperature stars the values raises rapidly, being extremely sensitive to temperature. This implies that uncertainties in the Teff adopted for stars in the empirical libraries (usually considerably higher for low temperature stars) make the comparison with models hardly reliable. Given the large uncertainties, models are not failing completely to reproduce this index.
4.3 Dependence on the atmospheric parameters
It is worth to keep in mind that errors on the empirical libraries, the most important one being uncertainties in the atmospheric parameters, hamper the comparison with the models.
ELODIE library is the only of the empirical libraries that provides, for each star, a flag that indicates the accuracy of each atmospheric parameter. In order to evaluate how much the accuracy might affect our comparisons, Figures 11 and 12 show the same comparisons as before for the indices G4300 and Fe4531, but filtering the observed stars by the quality flag of the atmospheric parameters. On the first line of the figures all stars are plotted. On the second line, only stars with good and excellent flags for the atmospheric parameters. On the third line, only the ones with excellent determination. It is clearly noticeable how much the agreement between models and observations can change, based only on stars with very good parameter determinations. The drawback, on the other hand, is that this filter limits drastically the number of points.
4.4 Dependence on the flux calibration
A second issue that can complicate the comparison between model and observations are related to flux calibrations uncertainties. One of the advantages of using spectral indices is that they were designed to be, as much as possible, insensitive to flux calibration issues. That implies that when using these indices to study the properties of stellar populations, the continuum shape is not used to extract information from the spectra. This is particularly useful when it is not possible to accurately flux calibrate the observations.
In order to test how sensitive to flux calibration issues are the indices studied here, we employed a modified version of Coelho library. As explained in §2, a library focused on spectroscopic use is not suitable to predict broad-band colours because it does not generally include the full line blanketing. As the libraries stand now, our note to the stellar population modeller which might be interested in using any of the synthetic libraries currently available is that one has to find a compromise between a library which is good for spectrophotometric predictions or one which is good for spectroscopic studies. Until the accuracy of the predicted energy levels lines is significantly improved (see e.g. Kurucz, 2006), the only way of achieving reasonable predictions for both broad-band colours and high resolution indices is by correcting the pseudo-continuum of current high resolution libraries to better match observed colours. In order to use the high resolution library to build stellar population models, Coelho et al. (2007) applies a correction to the original library presented in Coelho et al. (2005) in order to compensate for the mentioned missing line opacity. In a few words, this correction was done by comparing each star in Coelho library to the correspondent flux distributions by ATLAS9 grid. Smooth corrections to the continuum shape were applied to the stars in Coelho library in order to better match the continuum shape of its correspondent flux distribution by ATLAS9. Therefore, the modified Coelho library kept the high resolution features of the original library, but presents a flux distribution which is closer to that predicted when including all blanketing (ATLAS9).
The effect of this correction is shown in Figure 13, in a similar fashion of the broad-band colours figures at §3. ATLAS9 flux distributions are shown as red diamonds, Coelho original library stars are shown as green triangles, and the blue squares are the flux corrected stars (the modified Coelho library by Coelho et al. 2007).The effect of the missing line opacity is clear, specially in the blue part of the spectrum.
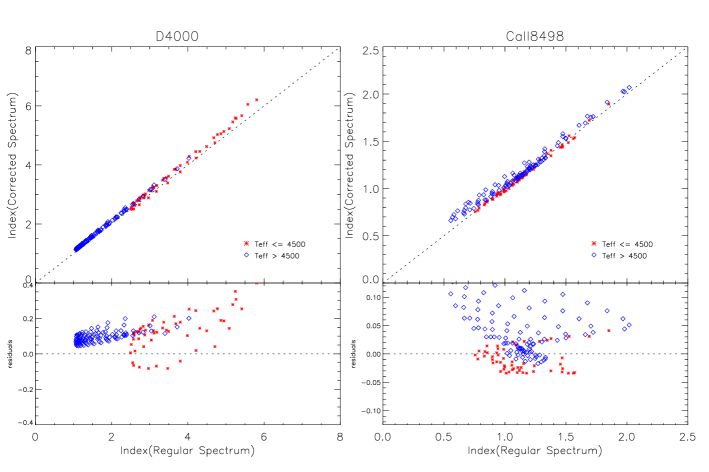
The spectral indices were then measured in the modified Coelho library and compared to the original measurements. These comparisons can show how smooth changes in the stellar pseudo-continuum can affect the measurement of the indices used in the present work. As expected, for most of the indices the differences between the two measurements are smaller than 3. Among the classical Lick indices, only Ca4455 and Mg1 are slightly more sensitive ( 5).
The notable exceptions are the indices D4000 and the three Ca indices in the near infrared, that showed a considerable sensitivity to the modifications of the continuum shape (reaching above 10 in the most extreme cases). In Figure 14 we show the comparisons between the indices calculated with the original library ( axis) and the flux corrected one ( axis), and the residuals in the bottom panels. This high sensitivity of D4000 index to flux calibrations issues has also been noticed by G. Bruzual, V. Wild & S. Charlot (priv. comm.)
4.5 The profile of the H lines in high temperature stars
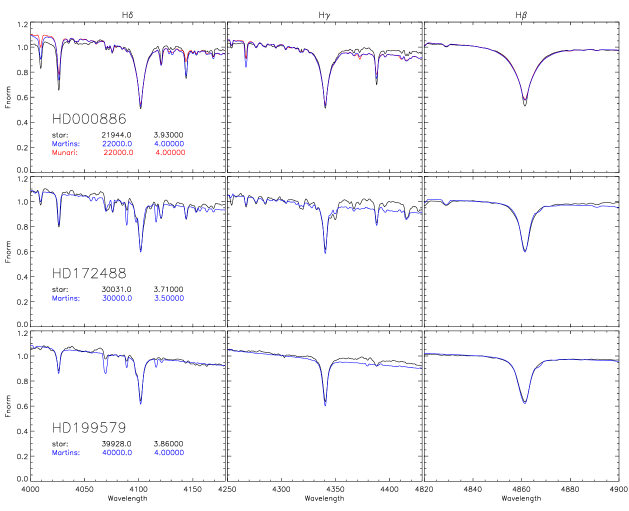
Balmer lines play a crucial role in the quantitative spectral analysis of hot stars. The Stark broadened wings depend on the photospheric electron density and, consequently, the stellar gravity log g. The line cores on the other hand are more sensitive to the effective temperature Teff. Thus, the complete Balmer line profiles contain information about both fundamental atmospheric parameters, Teff and log g. The effects of NLTE were demonstrated to be of drastic importance since the pioneering work of Auer & Mihalas (1972), and have to be considered in order to reproduce these lines. Martins et al. (2005) already showed that this effect becomes more important with increasing Teff, making a real difference for O and early B stars.
Figure 15 shows a comparison between three hot stars from the ELODIE library (which is more complete for hot stars) and the theoretical libraries from Martins and Munari (Coelho library stops at 7000K). The hot stars in Munari library are also limited to log g equal to 4.5 or 5.0, while in the empirical libraries the hotter stars have 3.5 log g 4.0. The top line of the figure shows three Balmer lines for a star with Teff 21000K. In this case, both models are LTE. On the H profile this might be the reason for not reproducing the very bottom of the line. The middle and bottom lines show two hotter stars (spectral type O), only represented in Martins library. For this temperature range Martins library consider NLTE computations, and all Balmer profiles are very well reproduced.
4.6 Summary
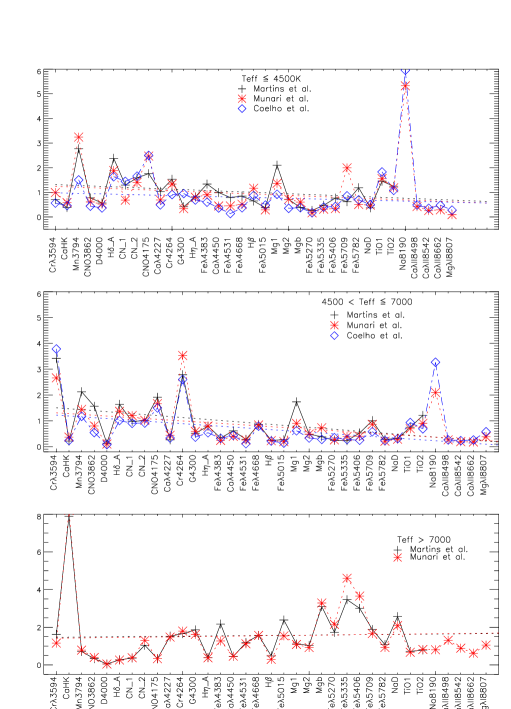
The overall performance of the high resolution synthetic libraries is summarised in Figure 16. This figure shows the variation of for each theoretical library, split in the three Teff intervals. We did not considered observed stars that were significantly deviating from the other stars with similar Teff and log g. For each theoretical library and each index, the shown is the average of the values obtained by the comparison to the three empirical libraries (the results for each of the empirical libraries are given in the Appendix).
The indices are shown on the axis, in order of increasing wavelength. The dotted lines are linear fits of the values for each of the synthetic libraries (this fit does not take into account the near-IR indexes, since the only empirical library that covers this region is Indo-US). Although this figure cannot be seen as a precise measure of the quality of the models, it can highlight interesting patterns.
First, all models are systematically deviating more in the blue part of the spectrum, where the blending of lines is considerably larger. To improve the quality of the line list, specially in the blue region and further in the UV is the aim of the HST Treasury Program 9455 by Ruth Peterson (see e.g. Peterson et al., 2001, 2003), and we confirm here that this is clearly the part of the spectrum that needs more work.
Second, Coelho library is the one that has the best average performance. This is likely a consequence of their line list, which was calibrated along the years in several high resolution stellar studies (e.g. Erdelyi-Mendes & Barbuy, 1989; Castilho et al., 1999; Meléndez et al., 2003). For stars hotter than 7000K Martins and Munari have similar results, but again, these indices are very weak and provide almost no information on this hot stars. A visual comparison of the Balmer lines profiles shows, nevertheless, that above Teff 30000K, NLTE modelling is crucial.
The values of are tabulated in the Tables in the Appendix.
5 Conclusions
With this work we aimed at pointing strengths and weaknesses of current theoretical stellar libraries, focusing on the observable values that are mostly used in stellar population models.
We divided our comparisons in two parts. In the first part, presented in §3, we measured broad-band colours predicted by three of the most used model atmospheres grids currently available: Castelli & Kurucz (2003), Gustafsson et al. (2003) and Brott & Hauschildt (2005). We compared the model predictions with the recent empirical colour-temperature relation by Worthey & Lee (2007), for the stars that are representative of a young and a old simple stellar population. The empirical relation is fairly well reproduced by the models for the colours V-I, V-R and J-H. All models are a little too blue in the B-V and H-K plane. The biggest differences among the models, and also where they most deviate from the empirical relation, is seen in the U-B colour. ATLAS9 is the model grid that best represents the empirical relation (although a considerable improvement is still required), but presents slightly higher residuals in the visual bands. All colours of the cooler stars (Teff 4500K) also need improvements
The second part of our comparisons, presented in §4, focus on the high resolution synthetic libraries that are aimed at spectroscopic studies. We measured thirty five spectral indices defined in the literature on three recent high resolution synthetic libraries: Coelho et al. (2005), Martins et al. (2005) and Munari et al. (2005). We compared the model indices with the observed measurements given by three high quality empirical libraries by Valdes et al. (2004), Sánchez-Blázquez et al. (2006) and Prugniel & Soubiran (2001). Our first result is that it is not trivial to compare model and empirical libraries because errors in the atmospheric parameters of the observed stars, and the particular abundance pattern of the solar neighbourhood might mislead into wrong conclusions about the accuracy of the models. Overall, we found that models are systematically worse in the same two regions that (not surprisingly) need improvement in the model atmospheres grids: the very cool stars and the blue region of the spectra. In the very low temperature regime molecular and metallic lines dominate the spectra and models are clearly struggling to reproduce them. A special care in the blue part of the spectrum is needed. It is worth highlighting the effect of different choices of atomic and molecular line lists. The library by Coelho et al. (2005) employs a line list that have been refined along the years in high resolution stellar spectroscopic studies, and the effect is seen in its better average performance, specially in the indices of iron peak elements. The indices are hardly useful for evaluating hot stars. Only Martins et al. (2005) and Munari et al. (2005) libraries provide stars at the temperatures required for the modelling of young populations, and even then, Munari et al. (2005) is limited to log g 4.5, which were not present in the empirical libraries. A visual comparison of the Balmer lines profiles shows, as in previous studies, that NLTE modelling (as in Martins et al., 2005) is required for the good reproduction of the Balmer line profiles of very hot stars. More tests are needed in this sense, since these hot stars can have very different rotational velocities which might affect the line profiles. Comparing models with slow rotation stars (which would not smooth the line profiles) would be the best way to test how much models are indeed able to reproduce these lines.
As suggestions to the next generation of theoretical stellar libraries, we think that concerning the model atmospheres grids and flux distributions, a better reproduction of the blue flux (particularly important in the studies of young populations or any population at high redshift), and of the cool giants (that dominates the integrated spectra of old populations) are still required. It is unclear to the present authors (none of us being a stellar atmosphere modeller) if this is to be achieved by more sophisticated physics modelling (3D computations, NLTE, non-spherical effects, etc.), or improvements in the molecular, atomic and continuum opacities, or yet by adjusting model parameters (like mass, mixing-length parameter and micro-turbulent velocities) as a function of spectral type. Concerning the high resolution libraries, we believe that significant improvement can still be made by fine tuning the atomic and molecular line lists, through their calibration against high resolution stellar spectra whose atmospheric parameters Teff, log g and detailed abundance ratios are known very accurately.
Acknowledgements: PC is grateful to Guy Worthey for explaining many of the subtleties concerning the photometric systems and the colour relations, and to Friedrich Kupka for the several and clarifying discussions about model atmospheres. LM thanks FAPESP through process 05/51101-5 for financial support. We also thank the suggestions made by the anonymous referee which helped improve this manuscript.
References
- Allard & Hauschildt (1995) Allard F., Hauschildt P. H., 1995, ApJ, 445, 433
- Allende Prieto et al. (2003) Allende Prieto C., Hubeny I., Lambert D. L., 2003, ApJ, 591, 1192
- Allende Prieto & Lambert (2000) Allende Prieto C., Lambert D. L., 2000, AJ, 119, 2445
- Auer & Mihalas (1972) Auer L.H., Mihalas D., 1972, ApJS, 24, 193
- Balogh et al. (1999) Balogh M. L., Morris S. L., Yee H. K. C., Carlberg R. G., Ellingson E., 1999, ApJ, 527, 54
- Barbuy et al. (2003) Barbuy B., Perrin M.-N., Katz D., Coelho P., Cayrel R., Spite M., Van’t Veer-Menneret C., 2003, A&A, 404, 661
- Bell et al. (1994) Bell R. A., Paltoglou G., Tripicco M. J., 1994, MNRAS, 268, 771
- Bensby et al. (2005) Bensby T., Feltzing S., Lundström I., Ilyin I., 2005, A&A, 433, 185
- Bertone (2006) Bertone E., 2006, Mem. S. A. It. Suppl., 8
- Bertone et al. (2003) Bertone E., Buzzoni A., Rodríguez-Merino L. H., Chávez M., 2003, in Piskunov N., Weiss W. W., Gray D. F., eds, IAU Symposium New Insights in High-Resolution Spectroscopy: a Wide Theoretical Library of R=500000 Stellar Spectra. pp 1P
- Bessell et al. (1991) Bessell M. S., Brett J. M., Scholz M., Wood P. R., 1991, A&AS, 89, 335
- Bessell et al. (1989) Bessell M. S., Brett J. M., Wood P. R., Scholz M., 1989, A&AS, 77, 1
- Brott & Hauschildt (2005) Brott I., Hauschildt P. H., 2005, in Turon C., O’Flaherty K. S., Perryman M. A. C., eds, ESA SP-576: The Three-Dimensional Universe with Gaia A PHOENIX Model Atmosphere Grid for Gaia. p. 565
- Bruzual & Charlot (2003) Bruzual G., Charlot S., 2003, MNRAS, 344, 1000
- Buzzoni (2002) Buzzoni A., 2002, AJ, 123, 1188
- Canuto & Mazzitelli (1991) Canuto V. M., Mazzitelli I., 1991, ApJ, 370, 295
- Castelli & Kurucz (1994) Castelli F., Kurucz R. L., 1994, A&A, 281, 817
- Castelli & Kurucz (2003) Castelli F., Kurucz R. L., 2003, in Modelling of Stellar Atmospheres No. 210 in IAU Symp, New grids of atlas9 model atmospheres. IAU by the Astronomical Society of the Pacific, p. A20
- Castelli & Kurucz (2004a) Castelli F., Kurucz R. L., 2004a, A&A, 419, 725
- Castelli & Kurucz (2004b) Castelli F., Kurucz R. L., 2004b, A&A, 419, 725
- Castilho et al. (1999) Castilho B. V., Spite F., Barbuy B., Spite M., de Medeiros J. R., Gregorio-Hetem J., 1999, A&A, 345, 249
- Cenarro et al. (2007) Cenarro A. J., Peletier R. F., Sánchez-Blázquez P., Selam S. O., Toloba E., Cardiel N., Falcón-Barroso J., Gorgas J., Jiménez-Vicente J., Vazdekis A., 2007, MNRAS, 374, 664
- Cerviño & Mas-Hesse (1994) Cerviño M., Mas-Hesse J. M., 1994, A&A, 284, 749
- Charbonnel (1994) Charbonnel C., 1994, A&A, 282, 811
- Chavez et al. (1997) Chavez M., Malagnini M. L., Morossi C., 1997, A&AS, 126, 267
- Coelho et al. (2005) Coelho P., Barbuy B., Melendez J., Schiavon R., Castilho B., 2005, A&A, 443, 735
- Coelho et al. (2007) Coelho P., Bruzual G., Charlot S., Weiss A., Barbuy B., Ferguson J., 2007, submitted to MNRAS.
- Delgado et al. (2005) Delgado R. M. G., Cerviño M., Martins L. P., Leitherer C., Hauschildt P. H., 2005, MNRAS, 357, 945
- Diaz et al. (1989) Diaz A. I., Terlevich E., Terlevich R., 1989, MNRAS, 239, 325
- Erdelyi-Mendes & Barbuy (1989) Erdelyi-Mendes M., Barbuy B., 1989, A&AS, 80, 229
- Fioc & Rocca-Volmerange (1997) Fioc M., Rocca-Volmerange B., 1997, A&A, 326, 950
- Fluks et al. (1994) Fluks M. A., Plez B., The P. S., de Winter D., Westerlund B. E., Steenman H. C., 1994, A&AS, 105, 311
- Frémaux et al. (2006) Frémaux J., Kupka F., Boisson C., Joly M., Tsymbal V., 2006, A&A, 449, 109
- Fuhrmann et al. (1993) Fuhrmann K., Axer M., Gehren T., 1993, A&A, 271, 451
- García-Gil et al. (2005) García-Gil A., García López R. J., Allende Prieto C., Hubeny I., 2005, ApJ, 623, 460
- Girardi et al. (2002) Girardi L., Bertelli G., Bressan A., Chiosi C., Groenewegen M. A. T., Marigo P., Salasnich B., Weiss A., 2002, A&A, 391, 195
- Girardi et al. (2000) Girardi L., Bressan A., Bertelli G., Chiosi C., 2000, A&AS, 141, 371
- Gregg et al. (2004) Gregg M. D., Silva D., Rayner J., Valdes F., Worthey G., Pickles A., Rose J. A., Vacca W., Carney B., 2004, in Bulletin of the American Astronomical Society The HST/STIS Next Generation Spectral Library. pp 1496
- Gustafsson et al. (1975) Gustafsson B., Bell R. A., Eriksson K., Nordlund A., 1975, A&A, 42, 407
- Gustafsson et al. (2003) Gustafsson B., Edvardsson B., Eriksson K., Jørgensen U. G., Mizuno-Wiedner M., Plez B., 2003, in Piskunov N., Weiss W. W., Gray D. F., eds, IAU Symposium A New MARCS Grid. pp 4P
- Hauschildt et al. (1999) Hauschildt P. H., Allard F., Baron E., 1999, ApJ, 512, 377
- Hauschildt et al. (1996) Hauschildt P. H., Baron E., Starrfield S., Allard F., 1996, ApJ, 462, 386
- Heiter et al. (2002) Heiter U., Kupka F., van’t Veer-Menneret C., Barban C., Weiss W. W., Goupil M.-J., Schmidt W., Katz D., Garrido R., 2002, A&A, 392, 619
- Henyey et al. (1965) Henyey L., Vardya M. S., Bodenheimer P., 1965, ApJ, 142, 841
- Houdashelt et al. (2000) Houdashelt M. L., Bell R. A., Sweigart A. V., 2000, AJ, 119, 1448
- Hubeny (1988) Hubeny I., 1988, Computer Physics Communications, 52, 103
- Hubeny & Lanz (1995) Hubeny I., Lanz T., 1995, ApJ, 439, 875
- Iben (1967) Iben I. J., 1967, ARA&A, 5, 571
- Jehin et al. (2005) Jehin E., Bagnulo S., Melo C., Ledoux C., Cabanac R., 2005, in Hill V., François P., Primas F., eds, IAU Symposium The UVES Paranal Observatory Project: a public library of high resolution stellar spectra. pp 261–262
- Jimenez et al. (2004) Jimenez R., MacDonald J., Dunlop J. S., Padoan P., Peacock J. A., 2004, MNRAS, 349, 240
- Johnson & Krupp (1976) Johnson H. R., Krupp B. M., 1976, ApJ, 206, 201
- Jones (1998) Jones L. A., 1998, PhD thesis, Univ. of North Carolina, Chapel Hill
- Kurucz (1993) Kurucz R., 1993, ATLAS9 Stellar Atmosphere Programs and 2 km/s grid. Kurucz CD-ROM No. 13. Cambridge, Mass.: Smithsonian Astrophysical Observatory, 1993., 13
- Kurucz (1979) Kurucz R. L., 1979, ApJS, 40, 1
- Kurucz (1992) Kurucz R. L., 1992, Revista Mexicana de Astronomia y Astrofisica, vol. 23, 23, 45
- Kurucz (2006) Kurucz R. L., 2006, in Stee P., ed., EAS Publications Series Including all the Lines. pp 129–155
- Kučinskas et al. (2005) Kučinskas A., Hauschildt P. H., Ludwig H.-G., Brott I., Vansevičius V., Lindegren L., Tanabé T., Allard F., 2005, A&A, 442, 281
- Lanz & Hubeny (2003a) Lanz T., Hubeny I., 2003a, ApJS, 146, 417
- Lanz & Hubeny (2003b) Lanz T., Hubeny I., 2003b, ApJS, 146, 417
- Le Borgne et al. (2004) Le Borgne D., Rocca-Volmerange B., Prugniel P., Lançon A., Fioc M., Soubiran C., 2004, A&A, 425, 881
- Le Borgne et al. (2003) Le Borgne J.-F., Bruzual G., Pelló R., Lançon A., Rocca-Volmerange B., Sanahuja B., Schaerer D., Soubiran C., Vílchez-Gómez R., 2003, A&A, 402, 433
- Leitherer et al. (1999) Leitherer C., Schaerer D., Goldader J. D., Delgado R. M. G., Robert C., Kune D. F., de Mello D. F., Devost D., Heckman T. M., 1999, ApJS, 123, 3
- Lejeune et al. (1997) Lejeune T., Cuisinier F., Buser R., 1997, A&AS, 125, 229
- Lejeune et al. (1998) Lejeune T., Cuisinier F., Buser R., 1998, A&AS, 130, 65
- Luque & Crosley (1999) Luque J., Crosley D. R., 1999, SRI International Report MP, 99, 009
- Malagnini et al. (2005) Malagnini M. L., Franchini M., Morossi C., di Marcantonio P., 2005, in Turon C., O’Flaherty K. S., Perryman M. A. C., eds, ESA SP-576: The Three-Dimensional Universe with Gaia alpha-Enhancement in Thin and Thick Disc Stars: An Atlas of Synthetic Spectra. pp 595
- Maraston (2005) Maraston C., 2005, MNRAS, 362, 799
- Martins et al. (2005) Martins L. P., Delgado R. M. G., Leitherer C., Cerviño M., Hauschildt P., 2005, MNRAS, 358, 49
- Meléndez et al. (2003) Meléndez J., Barbuy B., Bica E., Zoccali M., Ortolani S., Renzini A., Hill V., 2003, A&A, 411, 417
- Munari et al. (2005) Munari U., Sordo R., Castelli F., Zwitter T., 2005, A&A, 442, 1127
- Murphy & Meiksin (2004) Murphy T., Meiksin A., 2004, MNRAS, 351, 1430
- Nordlund & Dravins (1990) Nordlund A., Dravins D., 1990, A&A, 228, 155
- Pauldrach et al. (2001) Pauldrach A. W. A., Hoffmann T. L., Lennon M., 2001, A&A, 375, 161
- Peterson et al. (2003) Peterson R. C., Carney B. W., Dorman B., Green E. M., Landsman W., Liebert J., O’Connell R. W., Rood R. T., 2003, ApJ, 588, 299
- Peterson et al. (2001) Peterson R. C., Dorman B., Rood R. T., 2001, ApJ, 559, 372
- Pickles (1998) Pickles A. J., 1998, PASP, 110, 863
- Plez (1992) Plez B., 1992, A&AS, 94, 527
- Prugniel & Soubiran (2001) Prugniel P., Soubiran C., 2001, A&A, 369, 1048
- Rodríguez-Merino et al. (2005) Rodríguez-Merino L. H., Chavez M., Bertone E., Buzzoni A., 2005, ApJ, 626, 411
- Sánchez-Blázquez et al. (2006) Sánchez-Blázquez P., Peletier R. F., Jiménez-Vicente J., Cardiel N., Cenarro A. J., Falcón-Barroso J., Gorgas J., Selam S., Vazdekis A., 2006, MNRAS, 371, 703
- Schiavon (2006) Schiavon R., 2006, Accurate models for single stellar populations, submitted to ApJS
- Serven et al. (2005) Serven J., Worthey G., Briley M. M., 2005, ApJ, 627, 754
- Steffen & Ludwig (1999) Steffen M., Ludwig H.-G., 1999, in Gimenez A., Guinan E. F., Montesinos B., eds, ASP Conf. Ser. 173: Stellar Structure: Theory and Test of Connective Energy Transport Balmer Line Formation in Convective Stellar Atmospheres. pp 217
- Strom & Kurucz (1966) Strom S. E., Kurucz R., 1966, AJ, 71, 181
- Tripicco & Bell (1995) Tripicco M. J., Bell R. A., 1995, AJ, 110, 3035
- Valdes et al. (2004) Valdes F., Gupta R., Rose J., Singh H., Bell D., 2004, ApJS, 152, 251
- van’t Veer-Menneret & Megessier (1996) van’t Veer-Menneret C., Megessier C., 1996, A&A, 309, 879
- Vazdekis (1999) Vazdekis A., 1999, ApJ, 513, 224
- Westera et al. (2002) Westera P., Lejeune T., Buser R., Cuisinier F., Bruzual G., 2002, A&A, 381, 524
- Worthey et al. (1994) Worthey G., Faber S. M., Gonzalez J. J., Burstein D., 1994, ApJS, 94, 687
- Worthey & Lee (2007) Worthey G., Lee H. ., 2007, submitted to ApJ
- Worthey & Ottaviani (1997) Worthey G., Ottaviani D. L., 1997, ApJS, 111, 377
- Zwitter et al. (2004) Zwitter T., Castelli F., Munari U., 2004, A&A, 417, 1055