A unified model for AGN feedback in cosmological simulations of structure formation
Abstract
We discuss a numerical model for black hole growth and its associated feedback processes that for the first time allows cosmological simulations of structure formation to self-consistently follow the build up of the cosmic population of galaxies and active galactic nuclei. Our model assumes that seed black holes are present at early cosmic epochs at the centres of forming halos. We then track their growth from gas accretion and mergers with other black holes in the course of cosmic time. For black holes that are active, we distinguish between two distinct modes of feedback, depending on the black hole accretion rate itself. Black holes that accrete at high rates are assumed to be in a ‘quasar regime’, where we model their feedback by thermally coupling a small fraction of their bolometric luminosity to the surrounding gas. The quasar activity requires high densities of relatively cold gas around the black hole, as it is achieved through large-scale inflows triggered by galaxy mergers. For black holes with low accretion rates, we conjecture that most of their feedback occurs in mechanical form, where AGN-driven bubbles are injected into a gaseous environment. This regime of activity, which is subdominant in terms of total black hole mass growth, can be identified with radio galaxies in clusters of galaxies, and can suppress cluster cooling flows without the requirement of a triggering by mergers. Using our new model, we carry out TreeSPH cosmological simulations on the scales of individual galaxies to those of massive galaxy clusters, both for isolated systems and for cosmological boxes. We demonstrate that our model produces results for the black hole and stellar mass densities in broad agreement with observational constraints. We find that the black holes significantly influence the evolution of their host galaxies, changing their star formation history, their amount of cold gas, and their colours. Also, the properties of intracluster gas are affected strongly by the presence of massive black holes in the cores of galaxy clusters, leading to shallower metallicity and entropy profiles, and to a suppression of strong cooling flows. Our results support the notion that active galactic nuclei are a key ingredient in cosmological structure formation. They lead to a self-regulated growth of black holes and bring the simulated properties of their host galaxies into much better agreement with observations.
keywords:
methods: numerical – black hole physics – galaxies: formation – galaxies: clusters: general – cosmology: theory1 Introduction
It is now widely believed that most if not all galaxies with a spheroidal component harbour a supermassive black hole (BH) in their centres. Interestingly, the masses of these central BHs are found to be tightly linked with the stellar properties of their host galaxies, as expressed, e.g., in the correlation of bulge velocity dispersion with BH mass (Ferrarese & Merritt, 2000; Gebhardt et al., 2000; Tremaine et al., 2002), or in the relation of bulge stellar mass (Kormendy & Richstone, 1995; Magorrian et al., 1998; Marconi & Hunt, 2003; Häring & Rix, 2004) with BH mass. The existence of these relationships indicates that the formation and evolution of galaxies is fundamentally influenced by the presence of BHs, and vice versa. We thus also expect that the environment and the cosmological evolution of galaxies will affect the way BHs grow.
In fact, there is a plethora of observational and theoretical studies that suggest that several different channels for interaction of BHs with their surroundings exist. At high redshift, mergers of gas-rich galaxies occur frequently and funnel copious amounts of cold gas towards the central regions of galaxies, such that the embedded BHs can reach high gas accretion rates. The radiation energy associated with the accretion can support the enormous luminosities of powerful quasars. Theoretically it has been hypothesized (Silk & Rees, 1998; Fabian & Iwasawa, 1999; King, 2003) that quasars produce high velocity winds, which are expected to affect the properties of the host galaxy. The presence of quasar induced outflows has been observationally confirmed in a number of cases (e.g. Chartas et al., 2003; Crenshaw et al., 2003; Pounds et al., 2003), and has first been demonstrated in simulations of merging galaxy pairs by Di Matteo et al. (2005). Several numerical studies dealing with BH microphysics (e.g. Proga, 2003; McKinney, 2006) also predict existence of quasar outflows. Moreover, it appears that tidally disrupted galaxies are preferentially associated with AGN activity (for a review see Barnes & Hernquist, 1992). Quasar activity hence appears to be directly linked to mergers of galaxies, and should represent the dominant mode of mass growth in the BH population.
Indeed, using semi-analytic models of galaxy formation, Kauffmann & Haehnelt (2000) have demonstrated that BH growth associated with mergers in CDM models can reproduce many properties of the observed quasar population as well as the inferred BH mass density today (see also Volonteri et al., 2003). Based on the detailed hydrodynamical simulations of BH growth in galaxy mergers (Di Matteo et al., 2005; Springel et al., 2005a; Robertson et al., 2006a, b; Cox et al., 2006a, b) that have recently become available, Hopkins et al. (2005, 2006a, 2006c) have proposed a comprehensive picture of a unified, merger-driven model for the origin of quasars and their relation to spheroid formation, which also implies the existence of a ‘black hole fundamental plane’ (Hopkins et al., 2007a). Also, rapid merging of the gas-rich progenitor systems of rare, massive galaxy clusters has been shown (Li et al., 2006) to be a viable formation path for supermassive BHs that are as massive at as those seen in luminous high-redshift SDSS quasars (Fan et al., 2001).
However, there also appears to exist another channel of BH interaction with host galaxies, which is neither related to powerful quasar activity nor associated with galaxy mergers. Evidence for this interaction can be seen in a number of local elliptical galaxies and central cluster galaxies, which contain X-ray cavities filled with relativistic plasma (Bîrzan et al., 2004; McNamara et al., 2005; Forman et al., 2006; Fabian et al., 2006) while harbouring seemingly “dormant” BHs. These X–ray depressions, often referred to as ‘bubbles’, are thought to be inflated by relativistic jets launched from the central BH. Even though the radiative output from the central BH is not significant, the associated mechanical luminosity can be very important in these systems. There has been considerable effort from the theoretical point of view (e.g. Binney & Tabor, 1995; Churazov et al., 2001, 2002; Quilis et al., 2001; Ruszkowski & Begelman, 2002; Dalla Vecchia et al., 2004; Kawata & Gibson, 2005; Sijacki & Springel, 2006; Thacker et al., 2006; Okamoto et al., 2007) to understand the relevance of this mode of AGN feedback, which is widely considered to be leading candidate for resolving the cooling flow problem in groups and clusters of galaxies.
Given the complex physics of AGN-galaxy interactions, is it possible to construct a simple unified model that accounts for the different modes of BH feedback in a cosmological framework? First attempts in this direction have already been made (Churazov et al., 2005; Croton et al., 2006; Merloni & Heinz, 2006), motivated by the observational findings of X-ray binaries (Fender et al., 1999; Gallo et al., 2003). In particular, it has been shown that X–ray binaries switch between two states: in the so-called “low/hard” state, a steady radio jet is present and the hard X–ray spectrum is observed, while in the “high/soft” state, the jet vanishes and the X–ray spectrum shows a soft, thermal component. The transition between these two states is regulated by the accretion rate onto the BH itself, where the threshold value is of the order of . The “high/soft” state can be explained by the standard, optically thick and geometrically thin accretion disc (Shakura & Sunyaev, 1973), with BH accretion occurring at high rates and in a radiatively efficient mode. The “low/hard” state on the other hand corresponds to optically thin, geometrically thick, and radiatively inefficient accretion, as described by the theoretical ADAF and ADIOS solutions (Narayan & Yi, 1994; Blandford & Begelman, 1999).
The above suggests a rather simple, yet attractive scenario for distinguishing between different modes of BH feedback in models for the cosmological evolution of active galactic nuclei (AGN): We shall assume that for high accretion rates, a ‘quasar-like’ feedback occurs, while for states of low accretion, mechanical bubble feedback applies. It is clear that the simplicity of this model will not allow it to explain all kinds of AGN feedback phenomena, e.g. powerful radio galaxies that accrete at very high rates, as found in some proto-cluster environments, are not well represented in this simple scheme. Moreover, even though the physics of X-ray binaries is expected to be quite similar to the one of AGN (Heinz et al., 2005), an analogous transition between “high/soft” and “low/hard” states in AGN is observationally still not well established, although there are some encouraging observational findings (Maccarone et al., 2003; Körding et al., 2006) in this direction.
With these caveats in mind, we explore in this study a new ‘two-mode’ AGN feedback scenario in fully self-consistent cosmological simulations of structure formation. This complements and extends our study of cosmological simulations with quasar feedback in Di Matteo et al. (2007), where we did not account for the “radio” mode. Within our numerical model we represent BHs with collisionless “sink” particles and we adopt subresolution methods to compute their gas accretion rate, estimated from a Bondi prescription. Also, we allow BHs to grow via mergers with other BHs that happen to be in their vicinity and that have sufficiently low relative speeds. We assume that BH feedback is composed of two modes, as motived above, and we track their growth and feedback with cosmic time. We consider a vast range of objects harbouring BHs, from galaxies with stellar mass to massive galaxy clusters with total mass . Even though our BH growth model is rather simple and crude due to the inevitable numerical limitations, it represents the first attempt to include AGN feedback effects in cosmological simulations of structure formation. As we shall see, this approach produces significant improvements in the properties of simulated galaxies.
The outline of this paper is as follows. In Section 2, we describe our numerical method for incorporating the BH growth and feedback in cosmological hydrodynamical simulations. In Section 3, we test our model in simulations of isolated galaxy clusters, and explore the numerical parameter space. We then discuss cosmological simulations of galaxy cluster formation and evolution, subject to AGN feedback, in Section 4, while in Section 5 we consider cosmological simulations of homogeneously sampled periodic boxes. Finally, we summarize and discuss our results in Section 7.
2 Methodology
We use a novel version of the parallel TreeSPH-code GADGET-2 (Springel, 2005; Springel et al., 2001b) in this study, which employs an entropy-conserving formulation of smoothed particles hydrodynamics (Springel & Hernquist, 2002). Besides following gravitational and non-radiative hydrodynamical processes, the code includes a treatment of radiative cooling for a primordial mixture of hydrogen and helium, and heating by a spatially uniform, time-dependent UV background (as in Katz et al., 1996). Star formation and associated supernovae feedback processes are calculated in terms of a subresolution multiphase model for the ISM (Springel & Hernquist, 2003a). We use a simple prescription for metal enrichment, and optionally incorporate galactic winds powered by supernovae, as implemented by Springel & Hernquist (2003a). Furthermore, we follow the growth and feedback of BHs based on a new model that combines the prescriptions outlined in Springel et al. (2005b) and Sijacki & Springel (2006).
In the following, we briefly summarize the main features of the BH model relevant for this study (see Springel et al., 2005b, for further details), focusing on extensions that permit us to follow BH growth and feedback in a cosmological simulation of structure formation (see also Di Matteo et al., 2007). We then discuss a new BH feedback prescription at low accretion rates, based on a ‘bubble’ heating scenario for representing AGN heating in the radiatively inefficient regime of accretion.
2.1 Black hole formation and growth
The BHs in the code are represented by collisionless sink particles, which may accrete gas from their surroundings based on a prescribed estimate for the accretion rate. Two BH particles are also allowed to merge if they fall within their local SPH smoothing lengths and if their relative velocities are smaller than the local sound speed.
In our cosmological simulations of structure formation, we assume that low-mass seed BHs are produced sufficiently frequently such that any halo above a certain threshold-mass contains one such BH at its centre. Whether these seed BHs originate in exploding pop-III stars, in the collapse of star clusters, or are of primordial origin is not important for our analysis, but there needs to be a process that produces initial seed BHs which can then grow to the masses of supermassive BHs by gas accretion in the course of our simulations. For definiteness, in most of our simulations we adopt a seed BH mass of and endow all halos with a mass larger than with a seed if they do not contain any BH already. We identify halos without BHs on the fly during a simulation by frequently calling a fast, parallel friends-of-friends algorithm that is built into our simulation code.
State-of-the-art cosmological simulations of structure formation reach mass resolutions that are at best of order of our initial BH seed mass, while the resolution typically reached is still considerably coarser than that. This would mean that the initial growth of the BH mass could be significantly affected by numerical discreteness effects if the sink particle can only swallow full gas particles, as is the case in our scheme. In order to avoid that the BH growth and the accretion rate estimate is strongly affected by this numerical discreteness limitation, we treat the BH mass as an internal degree of freedom of the sink particle. In the beginning, may differ from the dynamical mass of the sink particle itself. The variable is integrated smoothly in time based on the estimated accretion rate onto the BH, while increases in discrete steps when the sink particle swallows a neighbouring gas particle. The latter process is modelled stochastically such that tracks in the mean, with small oscillations around it. With this prescription for the BH mass, we can follow the early growth of BHs accurately in a sub-resolution fashion even when their mass may be smaller than the mass resolution of the simulation, while at late times (or in the limit of very good mass resolution) the two mass variables coincide. Of course, in the event of a merger of two BH sink particles, both and are added together.
Following Di Matteo et al. (2005), we estimate the accretion rate onto a BH particle according to the Bondi-Hoyle-Lyttleton formula (Hoyle & Lyttleton, 1939; Bondi & Hoyle, 1944; Bondi, 1952)
| (1) |
where is a dimensionless parameter, is the density, the sound speed of the gas, and is the velocity of the BH relative to the gas. We account for the possibility that the BH accretion has an upper limit given by the Eddington rate
| (2) |
where is the proton mass, is the Thompson cross-section and is the radiative efficiency, that we assume to be 0.1, which is the mean value for the radiatively efficient Shakura & Sunyaev (1973) accretion onto a Schwarzschild BH. In some of our numerical models we specifically explore the imprints of the imposed Eddington limit on the BH properties.
2.2 Black hole feedback
In the model of Springel et al. (2005b), it is assumed that a fixed fraction of the BH bolometric luminosity couples thermally to the local gas, independent of the accretion rate and environment. In our model we extend this BH feedback prescription in order to obtain a physically refined model for AGN heating both at high and at low accretion rates. We are motivated by the growing theoretical and observational evidence (Fender et al., 1999; Gallo et al., 2003; Churazov et al., 2005; Heinz et al., 2005; Croton et al., 2006) that AGN feedback is composed of two modes, analogous to states of X-ray binaries. Specifically, at high redshifts and for high accretion rates we assume that the bulk of AGN heating is originating in the luminous quasar activity. In this regime, BHs accrete efficiently and power luminous quasars where only a very small fraction of their bolometric luminosity couples thermally to the gas. On the other hand, at lower redshifts and for BHs accreting at much lower rates than their Eddington limits, AGN heating proceeds via radiatively inefficient feedback in a mostly mechanical form.
To model the transition between these two accretion and feedback modes, we introduce a threshold for the BH accretion rate (BHAR) in Eddington units, above which ‘quasar heating’ is operating, and below which we deal with “radio” mode feedback, which we model by injecting bubbles into the host galaxy/cluster. Typically, we adopt a value of for , and we impose no other criterion to distinguish between the two modes of feedback.
For BHAR that are higher than , we parameterize the feedback as in Springel et al. (2005b), i.e. a small fraction of the bolometric luminosity is coupled thermally and isotropically to the surrounding gas particles, with an amount given by
| (3) |
Here gives the efficiency of thermal coupling. The value of adopted here brings the simulated relation obtained for remnants of isolated galaxy mergers in agreement with observations, as shown by Di Matteo et al. (2005).
Below we assume that the accretion periodically produces an AGN jet which inflates hot bubbles in the surrounding gas. We clearly lack the numerical resolution for self-consistent ab initio simulations of the detailed physics of BH accretion and the involved relativistic MHD that is responsible for the actual jet creation. However, we can nevertheless try to represent the relevant heating mechanism by directly injecting the energy contained in the AGN-inflated bubbles into the ICM. To this end we need to link the bubble properties, like radius, duty cycle and energy content, directly with the BH physics.
| [] | [] | [] | [] | ||
|---|---|---|---|---|---|
| 444 | 8.0 | 2.0 | |||
| 957 | 6.5 | 5.0 | |||
| 2063 | 5.0 | 10.0 | |||
| 2063 | 5.0 | 6.5 |
Up to now there is no compelling theory that can satisfactorily explain AGN jet formation, bubble inflation by the jet, and the duty cycle of jet activity. On the other hand, a growing body of observational evidence (e.g. Bîrzan et al., 2004; McNamara et al., 2005; Forman et al., 2006; Dunn & Fabian, 2006; Fabian et al., 2006) shows that AGN-driven bubbles are present in many systems, at different redshifts and over a range of masses, which constrains the duty cycle to be of the order of years. However, it is still not clear whether and how AGN activity can be influenced by properties of the host galaxy like its mass, dynamical state, or central gas cooling rate. In light of this uncertainty we propose a simple model for radio feedback where we assume that an AGN-driven bubble will be created if a BH has increased its mass by a certain fraction . Note that with this choice we do not constrain the possible duty cycle of the jet itself. We only conjecture that whenever the BH increases its mass by , the thermodynamical state of the surrounding gas will be affected by the BH activity, and that this can be represented in the form of the bubbles.
Thus, we relate the energy content of a bubble to the BH properties as
| (4) |
where is the efficiency of mechanical heating by the bubbles. Moreover, we link the bubble radius both to and to the density of the surrounding ICM, in the following way
| (5) |
where , , and are normalization constants for the bubble radius, energy content and ambient density, respectively. The scaling of the bubble radius is motivated by the solutions for the radio cocoon expansion in a spherically symmetric case (Scheuer, 1974; Begelman & Cioffi, 1989; Heinz et al., 1998). With this parameterization for , we mimic a scenario in which a more powerful jet will inflate bigger radio lobes, and where a higher ICM density will confine the size of the buoyant bubbles more. Finally, the spatial injection of the bubbles is random within a sphere with radius twice the bubble radius and centred on the BH particle in consideration.
3 Self-regulated bubble feedback in isolated halo simulations
We have first carried out a number of simulations of isolated galaxy clusters in order to test our BH feedback model and to explore its parameter space. These simulations consist of a static NFW dark matter halo (Navarro et al., 1996, 1997) with a gas component initially in hydrostatic equilibrium. The initial gas density profile has a similar form as the dark matter, but with a slightly softened core, as explained in more detail in Sijacki & Springel (2006). We construct initial conditions for halos with a range of masses (see Table 1 for the details of the numerical setup) and evolve them non-radiatively for a time to damp out possible initial transients. Then, we “switch on” radiative gas cooling and star formation, and also introduce a seed BH particle in the halo centre. In the following subsections, we describe the results for the subsequent growth of the BHs.
3.1 Exploring the parameter space
In this section, we analyse the sensitivity of our model and of the resulting BH and host halo properties with respect to the parameter choices we have adopted. We begin by considering an isolated halo of mass , comparing simulations with and without BHs. For these numerical tests, we only consider AGN feedback in the form of bubbles, while in all full cosmological simulations we will include both modes of AGN feedback introduced in Section 2.2.
First, we vary the threshold for bubble triggering in terms of accreted mass, , from to , which will affect both the number of bubble events and their mean energy. The other two free parameters in the BH feedback model, and the normalization value for , are kept fixed in this first series of simulations in order to facilitate the comparison. For definiteness, for most of the isolated halo simulations we select , , erg, and . Note that our choice for these parameters will be slightly different in cosmological simulations, as we will discuss in Section 4. In most of our numerical experiments we start with a small BH seed, typically equal to , to establish if the BH growth is self-regulated and whether it leads to a realistic BH mass when a quasi-stationary state is reached. In a number of test simulations we also explore a scenario in which a massive BH is already present at the very beginning.
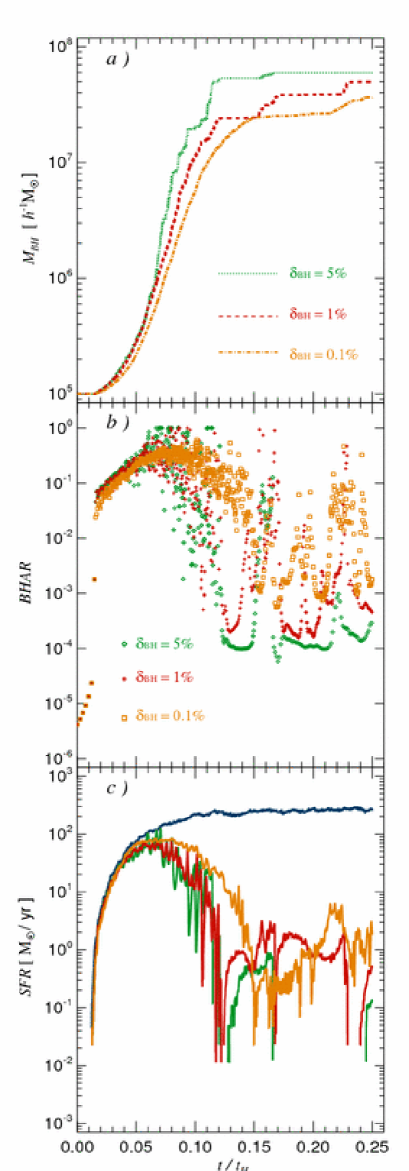
In panels and of Figure 1 we show the BH mass and the accretion rate expressed in Eddington units as a function of time, for three different values of , and . It can be seen that the BH is initially growing rapidly starting from the seed mass of , and the accretion rate onto the BH is quite high, reaching the Eddington level at . However, after this initial phase of rapid growth, AGN feedback starts to reduce the further BH growth, because at this point enough heating is supplied to the surrounding medium, preventing it to quickly cool and sink towards the most inner regions. Thus, the feedback provided by AGN-driven bubbles reduces the supply of gas available for accretion by the central BH. Consequently, drops and the mass of the BH shows no significant growth with time for a while. However, after a certain amount of time which depends on the heating efficiency, the central cluster gas starts to cool again, causing an increase of the BHAR and the triggering of another bubble episode. This mechanism establishes a self-regulated cycle, in which a balance between the gas cooling rate, the bubble heating rate and the residual BHAR is achieved. In panel of Figure 1, this cycle of AGN activity can be clearly seen. Here the peaks in BHAR correspond to the bubble injection events. Note that the higher values of lead to fewer and more powerful AGN outbursts that cause the accretion rate to drop to very low values of order of .
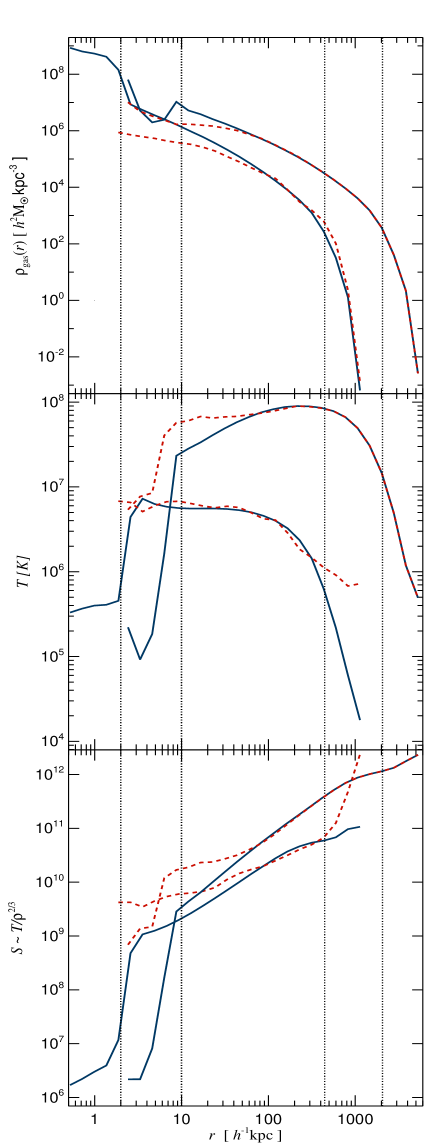
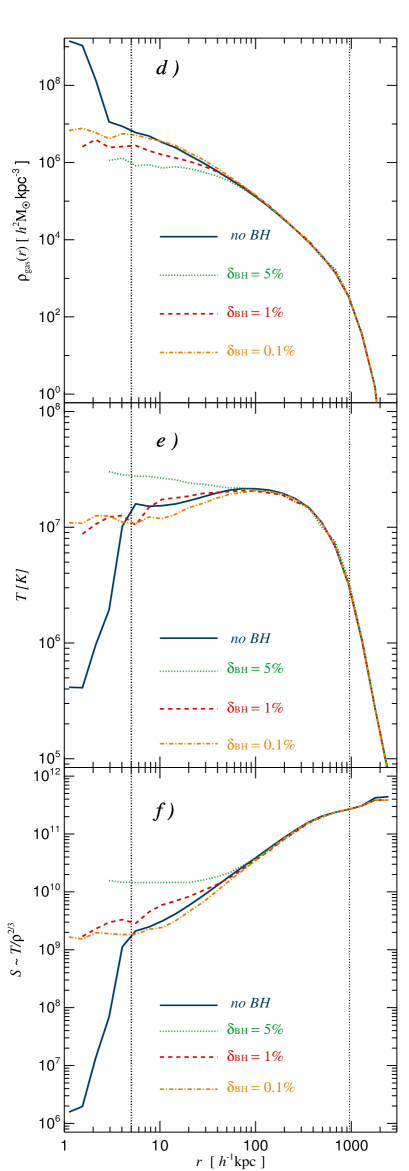
The parameter also affects the properties of the ICM. In panels , and of Figure 1 we illustrate this effect by plotting the radial profiles of gas density, temperature and entropy, for the different values of assumed in the simulations, as indicated in the panels. We also show the corresponding profiles for the run without AGN heating, denoted by the continuous blue lines. Clearly, there is a trend in the simulated profiles with : more frequent and more gentle bubble heating events increase the central cluster entropy less than more powerful but rarer feedback episodes. A similar result has been found in the simulations of Omma & Binney (2004), where a higher jet power was heating the cluster for a longer time interval. However, regardless of the exact value of the parameter, the central cooling catastrophe is prevented in our model cluster in all simulated cases with feedback. Once the feedback becomes effective, the BH mass stops growing when it reaches . Note however that the final value of the BH mass depends also on the parameter, which we have taken to be as high as possible in these test runs. Consequently, the BH masses obtained here represent a lower limit for the actual BH mass that one would expect in a cluster of this size.
In panel of Figure 1, we show how the star formation rate (SFR) is affected by AGN-driven bubbles. Without AGN heating, the SFR of the isolated cluster grows with time to values as high as . This high SFR results from the large amounts of cool gas that accumulate in the central regions, forming a reservoir for intense star formation activity. However, in the models with AGN feedback, the SFR drops dramatically to values of order of . For these runs it can be also seen that the SFR shows a number of short spikes of somewhat enhanced activity, and these peaks are directly related with episodes of increased BHAR which lead to a triggering of bubbles and a successive reduction of the SFR.
We have also tested to which extent the AGN feedback is affected by changes in the normalization value for the bubble radius. As before, we adopt as default values for bubble energy and ICM density erg and , respectively, but we vary for different runs. In the range of to for , our results are not altered significantly by modifications of this parameter. However, for substantially larger values of , e.g. , the heating energy per particle drops to considerably smaller values, changing the initial rapid growth phase of the BH. For large values of , the AGN feedback is less efficient in the early phase of growth such that the BH can grow to a somewhat larger mass before a self-regulated heating loop is established. We will further discuss the importance of the bubble radius when we consider halos of different mass in Section 3.2.
Finally, we have numerically explored scenarios where an already massive BH is introduced at the very beginning of a simulation. For equal to , the BH mass is found to increase from its initial value of to over a time span equal to one quarter of the Hubble time. Most of this BH growth, however, can be attributed to the intermittent nature of bubble heating, while in the continuous AGN feedback regime, the BH mass increases by less then over the same simulated time span. Thus, our numerical scheme indeed leads to a stable galaxy cluster solution where overcooling in the central parts is prevented and the BH mass grows to a self-regulated value.
3.2 AGN heating in halos of different mass
In this section we examine AGN feedback effects in cluster halos spanning a range in mass, from to . We adopt one set of feedback parameters for all simulations, namely , , , and , as in the previous section, and for we choose the intermediate value of . We are interested in the question whether for a fixed set of parameters our model produces satisfactory solutions for halos of very different masses.
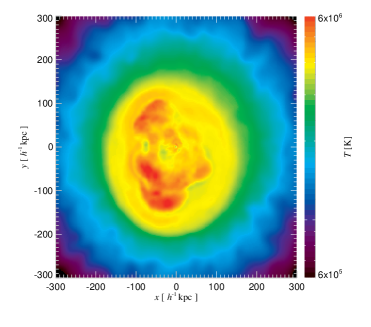
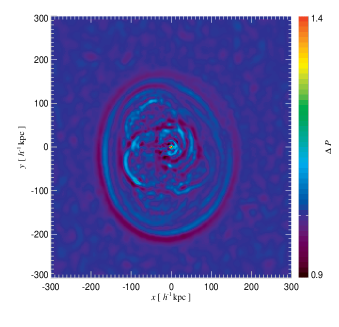
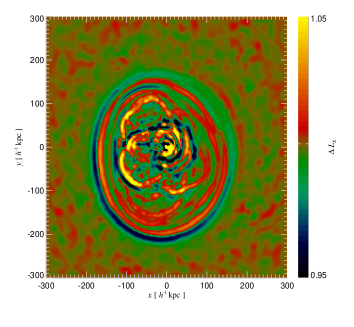
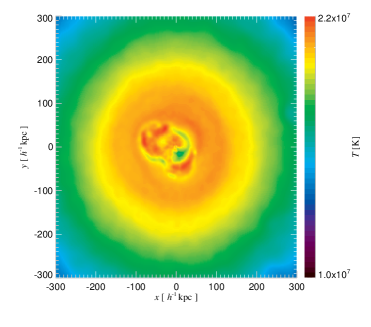
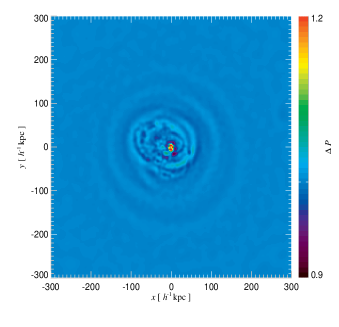
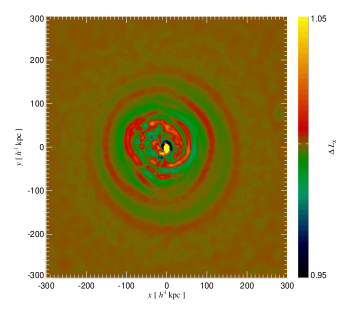
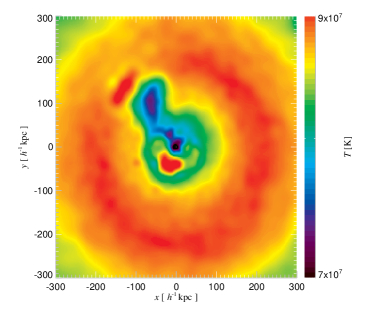
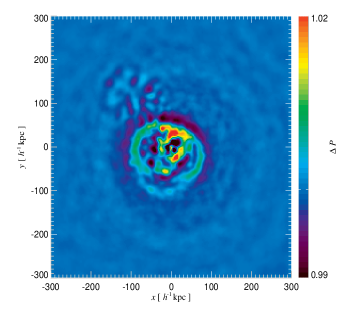
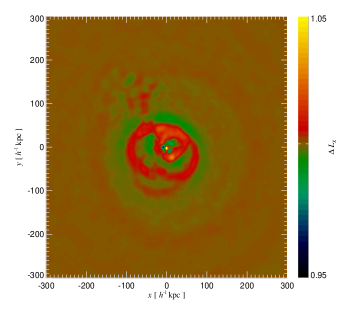
Before we delve into a detailed quantitative analysis of the cluster simulations, we illustrate the visual morphology of simulated AGN-inflated bubbles in Figure 2. For this purpose, we show projected mass-weighted temperature maps (first column), pressure fluctuation maps (middle column) and fluctuation maps of the X–ray luminosity (last column). Different rows are for clusters of increasing mass, from top to bottom. We call the maps in the second and the third columns “fluctuation” maps because they have been constructed by dividing the original map by a version that has been smoothed on a scale of . This highlights local departures from the mean ICM properties, similar to what is known as unsharp masking technique in observational analysis.
A number of interesting features can be seen from the panels in Figure 2. First, AGN-driven bubbles have characteristic mushroom-like and cap-like morphologies. These are particularly evident for the halo, where several bubbles injected briefly after one another can be noticed. Note that the reason why there are so many bubbles in this particular map is in part due to the selected time for the image. At this moment happens to grow rapidly, thus the bubble duty cycle is rather short. In the last row of Figure 2, two bubbles can be seen in the central region of the cluster, one SW from the cluster centre and the other NW and more distant. The latter one is uplifting some residual cool gas from the cluster centre, which forms a filamentary structure in the wake of the bubble. Looking at the pressure map of this cluster a nicely defined mushroom-like bubble can be seen that corresponds to the NW red blob in the temperature map. In general, the pressure and X-ray luminosity maps show numerous irregularities, sound waves and weak shocks that have been generated by the bubbles. The ripples in these maps become progressively weaker for more massive cluster, which is a consequence of the parameterization adopted in our model, as we will clarify in the following paragraphs.
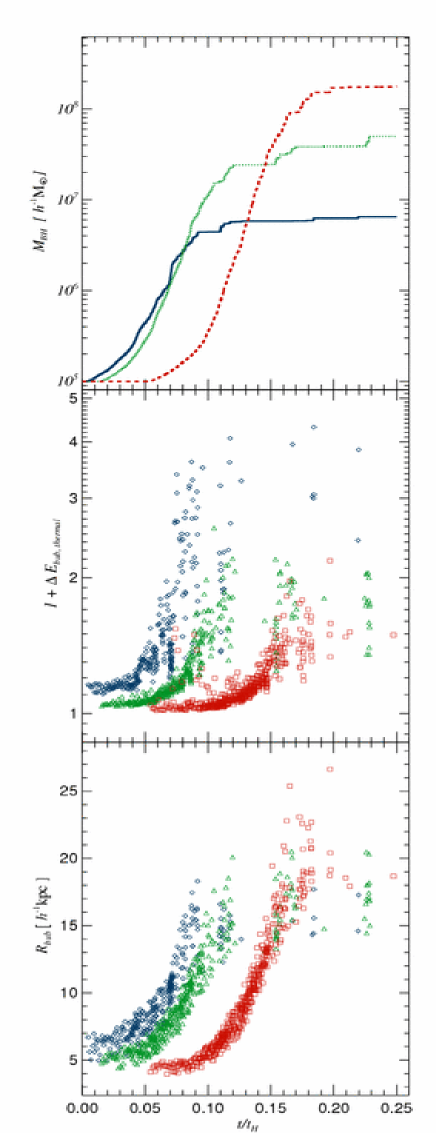
In the upper-most panel of Figure 3, we show the mass growth of the central BH as a function of time for the different cluster simulations. It can be seen that halos of increasing mass exhibit a qualitatively similar behaviour for their BH growth: an initial rapid growth phase is followed by self-regulated stagnation. However, the starting point of the rapid growth is dictated by the gas cooling time, which is shortest for the smallest cluster mass considered. Therefore, for the halo, the BH starts growing first, but it is also the first one to reach stagnation, while the BH sitting in the centre of the cluster waits for before increasing its mass significantly. At the end of the simulated time-span, all three BHs reach equilibrium states and their final masses are: , , and , respectively.
In the other two panels of Figure 3, we show how certain bubble properties evolve with time for different cluster simulations. In the middle panel, represents the thermal energy contrast of the bubble just before and after the energy was injected into it. is reflecting mainly the mass growth of the BH, since it determines how much energy will be thermally coupled to the bubbles. It can be seen that initially grows significantly with time, but when the BH growth saturates, it scatters around a constant value. Also, there is a systematic trend of with cluster mass, with smaller mass clusters showing a larger energy contrast for the bubbles. This is primarily due to the smaller radius of bubbles in less massive clusters, as can be seen in the bottom panel of Figure 3. Given that we have adopted the same set of parameters for our different cluster simulations, it follows from Eqn. (5) that BHs of smaller mass will generate smaller bubbles. This explains why is growing in time and why it is bigger for more massive halos that harbour larger BHs. This consequence of our model has also repercussions for the presence and intensity of sound waves generated by the inflation of bubbles, as seen in the maps of Figure 2. Smaller bubbles with a higher energy contrast relative to the surrounding ICM are more efficient in generating weak shocks and sound waves than large bubbles with low .
In Figure 4, we show radial profiles of gas density, temperature and entropy for our isolated clusters of mass and . The radial profiles of the cluster can be found in Figure 1 with the same colour-coding. The blue, continuous lines denote the runs without AGN, while the red, dashed curves are for the simulations with AGN heating. The upper set of profiles in each panel are for the more massive cluster. The results show that for a fixed choice of parameters in our AGN heating model the ICM properties of clusters over a range of masses appear satisfactory: (i) the gas density is somewhat suppressed in central regions; (ii) very cool gas in the innermost regions of clusters is absent, and at the same time the AGN heating is not increasing the ICM temperature too much; (iii) the gas entropy is boosted in central regions, but without generating entropy inversions that are typically not observed in real systems. Together with realistic BH masses and BHAR, these promising features of the simulated ICM properties encourage us to proceed studying our model using fully cosmological simulations of galaxy cluster formation, which we consider in the next section.
4 Cosmological simulations of AGN feedback in galaxy clusters
We now turn to self-consistent cosmological simulations of galaxy cluster formation, with the aim to understand how AGN feedback influences these objects at different cosmological epochs and how this influence depends on the mass and the evolutionary history of clusters. We focus our analysis on two galaxy cluster simulations that have quite different merging histories and different present-day masses. The clusters have been selected from a cosmological CDM model with a box size of (Yoshida et al., 2001; Jenkins et al., 2001), and were prepared by Dolag (2004) for resimulation at higher resolution using the Zoomed Initial Condition (ZIC) technique (Tormen et al., 1997). The cosmological parameters of the simulations are those of a CDM concordance cosmology with , , , , and Hubble constant at the present epoch. In respect to the isolated halos simulations we have adopted somewhat different parameters of the BH feedback model, with the normalization values for erg, and being lower, with , and with a more realistic mechanical feedback efficiency of , while the other parameters were kept exactly the same.
The primary numerical parameters of our simulations are summarized in Table 2, and the main physical properties at of the formed clusters are listed in Table 3. For both simulated galaxy clusters, the smaller one (“g676”) and the more massive one (“g1”), the virial radius, virial mass, total gas mass and stellar mass have been measured in runs without AGN feedback (labelled “csf”) and when it is included (labelled “csfbh”). Additionally, the mass– and emission–weighted temperature, X–ray luminosity and total SFR are given in the 6th to the 9th column of Table 3, respectively. Looking at the gas properties listed in Table 3 it can be seen that AGN feedback does not significantly alter the global gas temperature, or the X–ray luminosity. However, there are still important local changes of these properties when AGN heating is included, as we will discuss in more detail in Section 4.3. On the other hand, the global stellar properties are strongly affected by AGN feedback: the total stellar mass is reduced considerably, as well as the total SFR, while the total gas mass is increased. This implies that the relative amount of gas versus stars is a function of AGN heating efficiency.
| Simulation | [] | [] | [] | ||||
|---|---|---|---|---|---|---|---|
| g676 | |||||||
| g1 |
| Cluster | SFR | |||||||
|---|---|---|---|---|---|---|---|---|
| [] | [] | [] | [] | [] | [] | [] | [] | |
| g676_csf | 51 | |||||||
| g676_csfbh | 1 | |||||||
| g1_csf | 742 | |||||||
| g1_csfbh | 144 |
4.1 Black hole growth in clusters
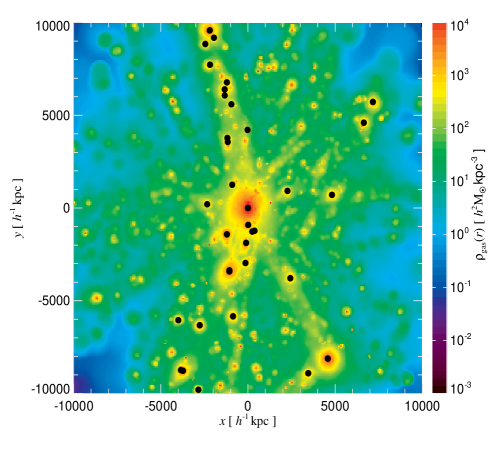
In Figure 5, we show a projected gas density map of the g676 galaxy cluster simulation at , with the positions of BHs more massive than overlaid as black dots. The density map is on a side and is centred on the most massive cluster galaxy. Interestingly, the surrounding large-scale structure shows many smaller halos with embedded BHs, many of them residing in a filamentary region NW of the central object. In fact, most halos are harbouring a central, massive BH. However, the most massive BH among them is sitting at the centre of the biggest halo, and this is also true at higher redshifts.
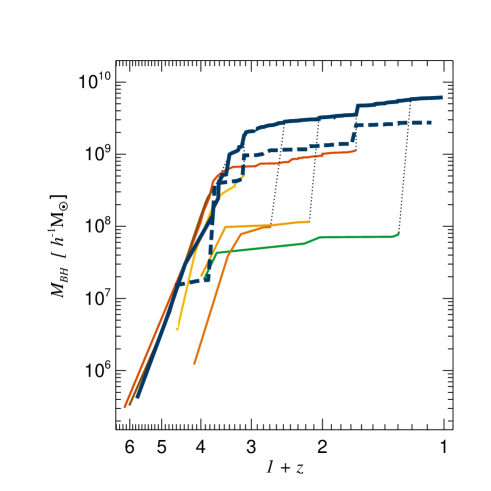
The mass as a function of time of this most massive BH is shown in Figure 6. To produce this measurement, we have first constructed the full merger tree of all BHs formed in the simulated volume, allowing us to extract the main progenitor trunk corresponding to the most massive BH at , which is plotted as a thick continuous blue line. Also, we show the mass growth of the secondary progenitors that at the moment of their last merger have a mass greater than . It can be seen that the most massive BH at is not the first one to form, but it merges with two BHs that formed somewhat earlier and that are more massive for . This is similar to our findings in Di Matteo et al. (2007), where we showed that the most massive black holes found at high redshift in a cosmological volume need not necessarily be the most massive ones at low redshift. The thick, dashed blue line in Figure 6 represents the cumulative mass of all secondary progenitors of the most massive BH at . This shows that mergers contribute up to to the final mass of the BH that defines the trunk, while the remaining are due to gas accretion by the BH on the trunk itself. Note however that ultimately all the BH mass is built-up by gas accretion (the mass of the initial seed BHs is negligible), but the part we here attributed to mergers was built up by gas accretion in other systems.
We also note that the mass growth via mergers is more important at higher redshifts, with the last significant merging event occurring at . The merger events of BHs are mainly driven by the merging history of the host galaxy clusters. Indeed, there is a quite close correspondence between the evolution of the main progenitor of the most massive BH and the main progenitor of the biggest halo in the simulation. In particular, the main progenitor of the g676 galaxy cluster undergoes a number of mergers between redshifts , when also the BH grows significantly via mergers with other BHs. Then at , the g676 cluster experiences its last major merger, visible as a jump in the main trunk in Figure 6. At lower redshifts, the cluster becomes fairly relaxed and isolated, such that its central BH grows mostly by accreting gas that is cooling off from the hot cluster atmosphere. As we will discuss in Section 6 this mode of accretion (at low accretion rates) does however not contribute significantly to the overall BH mass growth.
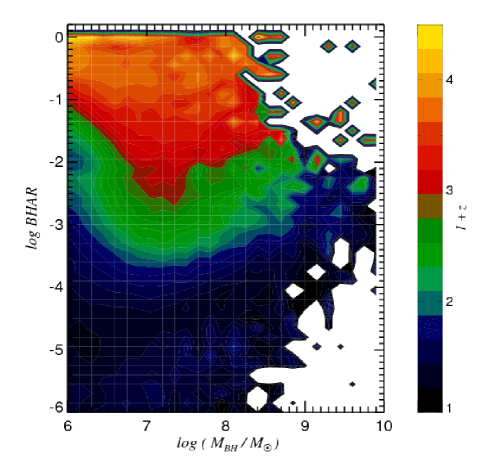
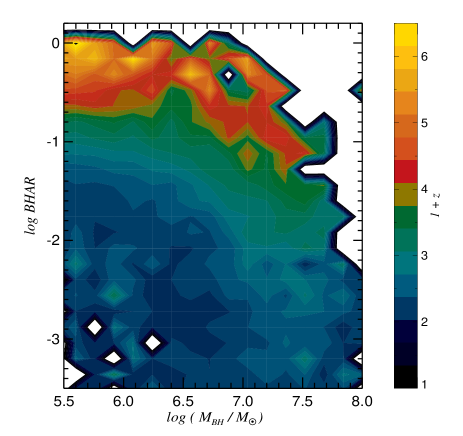
Now we consider in more detail the mass growth and the accretion rate, not only of the most massive BH, but of all the BHs belonging to the simulated volume. Due to the better statistics provided by the g1 galaxy cluster simulation, we focus on this simulation, noting that the results for the g676 cluster are very similar. In Figure 7, we plot the BHAR, expressed in Eddington units, as a function of the BH mass. The colour-coding denotes the redshift, over the redshift interval to considered here. A number of interesting features can be noticed in this plot: (i) at a given BH mass, the accretion rate is decreasing with redshift; (ii) for intermediate redshifts, , the BHAR is lowest for intermediate mass BHs; (iii) at still lower redshifts, the BHAR for intermediate masses keeps falling strongly, while it stays comparatively high for low-mass BHs as well as for very massive BHs (iv) at the present epoch there is a large population of low-mass BHs that is still accreting efficiently. These features are qualitatively consistent with observational findings both from optical and X-rays surveys (e.g. Steffen et al., 2003; Ueda et al., 2003; Heckman et al., 2004; Barger et al., 2005; Hasinger et al., 2005) that indicate that BHs are growing in a so-called ‘anti-hierarchical’ manner. In Section 5, we will come back to this issue, and discuss how the BHAR depends on the BH mass in a galactic environment.
At low redshifts, the increase of the BHAR with mass at the high BH mass end is driven by BHs that sit at the centres of massive galaxy clusters. These BHs are fed by gas from the hot cluster atmosphere, which would develop a strong cooling flow without the periodic heating by the AGN feedback. Interestingly, we also find that our BHAR of massive BHs at agrees very well with a recent estimate of the Bondi accretion rate for a sample of X-ray luminous elliptical galaxies by Allen et al. (2006).
However, we need to emphasize that the simulations performed in this study were not designed to address the problem of BH formation and growth in the very early universe, for which they lack the required resolution and volume. This becomes also apparent in the plot of Figure 7, where the upper right corner is not populated. This means that these simulations cannot account for the existence of supermassive BHs of mass already at , as inferred from the luminosity of high redshift quasars (Fan et al., 2001). Using high-resolution compound galaxy models to populate a merger tree measured from a zoom simulation of a protocluster region, Li et al. (2006) have however recently demonstrated that at least in principle such early supermassive BHs can grow from accretion in gas-rich mergers at high redshift.
4.2 Heating the cluster outskirts
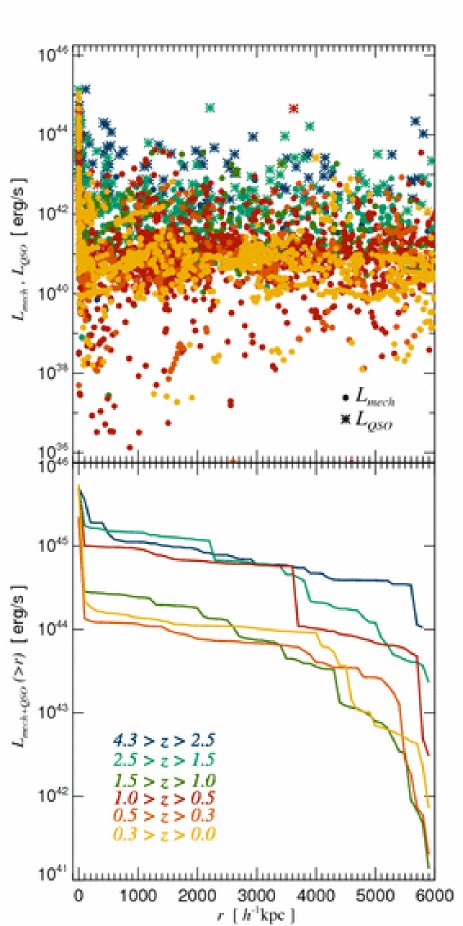
In Figure 8, we examine the radial dependence of AGN heating in our simulated clusters for different redshift bins. To this end, we evaluate the AGN luminosity at the given epoch and plot it as a function of distance from the centre of the most massive cluster in the simulation. Depending on the BHAR, we decide whether the BH is in the “quasar” or “radio” mode, which we denote with star symbols or circles, respectively (see upper panel). In the lower panel, we plot the total AGN luminosity outside of a given radius, regardless in which mode the BHs accrete. It can be seen that the AGN heating at all redshifts considered and regardless of the feedback mode is most important in the cluster centre. However, at early times, and in particular for , BHs that happen to reside in cluster outskirts during this time could provide an important additional source of ICM heating. These BHs are essentially all in the quasar phase where they accrete gas efficiently. Most of these BHs reside in satellite halos that are entering the most massive system for the first time, and thus possibly are preheating the gas of smaller halos prior to and during the merger with the massive cluster. These findings and the spatial distribution of AGN in galaxy clusters, illustrated in Figure 5, are in a good agreement with observational evidence (e.g. Cappi et al., 2001; Cappelluti et al., 2005; Ruderman & Ebeling, 2005; Martini et al., 2006) for the presence of AGN in galaxy cluster environments. At low redshifts, though, the AGN sitting at the cluster centre appears to be the dominant source of heating, as we confirm in Section 4.3. Interestingly, the feedback luminosity of the central AGN, regardless of its accretion regime, peaks at the similar value for the whole time span considered.
4.3 The impact of AGN heating on the ICM
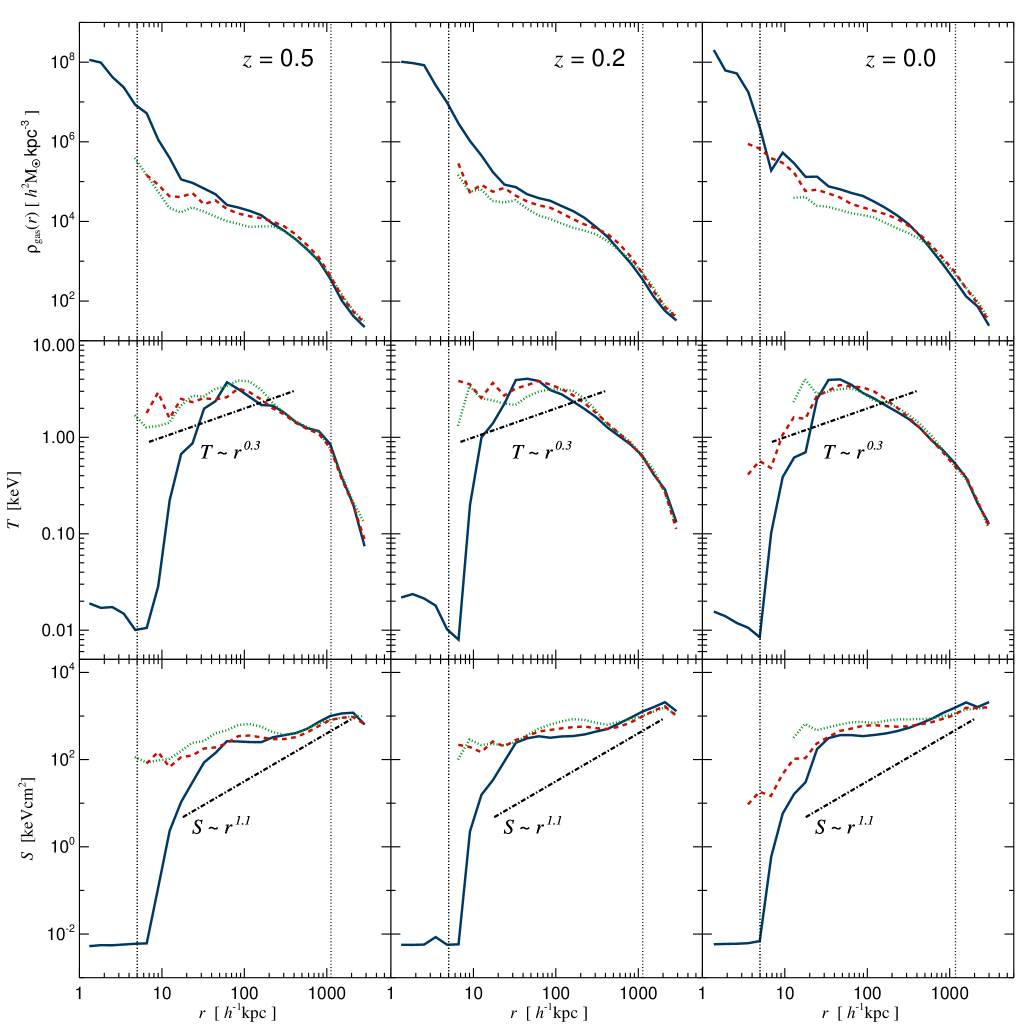
We here analyse how AGN feedback affects the intracluster medium and the stellar properties of the cluster galaxies. In Figure 9, we show radial profiles of gas density, temperature and entropy of the g676 cluster at three different epochs, both without (continuous blue lines) and with AGN heating (dashed red lines). Additionally, we have explored a model in which the BHAR was not limited to the Eddington rate, which is drawn with a dotted green line. It can be seen that at all redshifts considered, the central gas density is reduced significantly as a result of AGN feedback. We also observe that the gas temperature in the central regions is fluctuating around the “isothermal” value, sometimes for short time intervals increasing towards the centre, but most of the time being roughly constant or decreasing. These trends in gas temperature are due to the periodic nature of the bubble feedback. If a very energetic bubble is injected in the innermost cluster regions, the gas temperature increases for a short time, and reduces the BHAR considerably. After some time has elapsed, the gas will begin to cool again such that the central gas temperature will gradually start to decrease towards the centre. When enough gas has cooled off from the hot cluster atmosphere and has become available for accretion onto the supermassive BH, a new bubble will be triggered, establishing a self-regulated loop for the growth of the BH and the heating of the ICM. In some sense, this feedback loop acts as a thermometer for the ICM, preventing it to develop strong cooling flows.
On top of our simulated gas temperature profiles, we plot the slopes of the central temperature profiles of the cool core clusters recently found by Sanderson et al. (2006), showing a very encouraging agreement. Indeed, a number of observational studies (e.g. De Grandi & Molendi, 2002; Vikhlinin et al., 2005; Dunn & Fabian, 2006; Pratt et al., 2007) have shown that the central temperature profiles of relaxed, cool core clusters decrease with decreasing radius, while at the same time these systems require an additional source of heating in order to avoid excessive cooling flows. Theoretically, it is not trivial to explain this observed feature of the central cluster temperature – a self-regulated feedback mechanism is apparently needed which is sensitive to the local properties of the intracluster gas. Our model contains such a mechanism and represents to our knowledge the first successful attempt to simulate such a process in a cosmological environment.
As a result of the non-gravitational bubble heating, the ICM entropy is increased in the central regions, but maintains a monotonically increasing radial profile. Given the temperature of this cluster, the overall shape and the normalization of the simulated entropy profile are consistent with observational findings (e.g. Pratt & Arnaud, 2003; Ponman et al., 2003). Observationally, it is found that the entropy scales with radius roughly as in the cluster outskirts, while departures from this scaling are seen in the central regions, out to . As can be noticed from the bottom row of Figure 9, our simulated entropy profiles depart from this scaling out to somewhat larger radii, and this is also found for the ‘g1’ cluster simulation which has quite similar radial profiles. However, to decide whether this constitutes a real discrepancy between the simulations and observations, a larger set of simulated galaxy clusters is required, which we plan to compile in forthcoming work.
Looking at the radial gas profiles for it is clear that the AGN heating does not significantly change the ICM properties at larger radii. Thus, heating of the cluster outskirts does not appear to be relevant for , confirming our findings in Section 4.2. Moreover, the radial profiles of our simulated galaxy cluster at do not differ significantly from the ones at . This is consistent with observational findings (Bauer et al., 2005), where already formed cool core clusters are seen at , with similar properties to the local population.
| Cluster | SFR | ||||||
|---|---|---|---|---|---|---|---|
| [] | [] | [] | [] | ||||
| g676_csf | |||||||
| g676_csfbh | |||||||
| g1_csf | |||||||
| g1_csfbh |
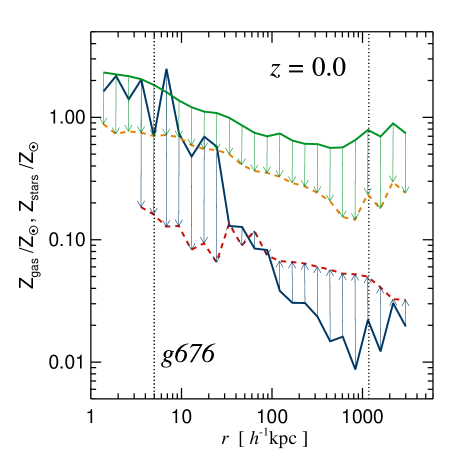
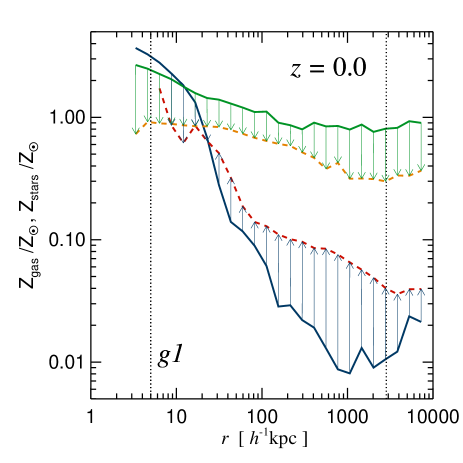
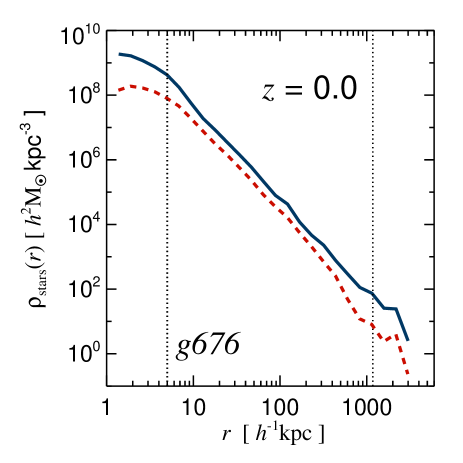
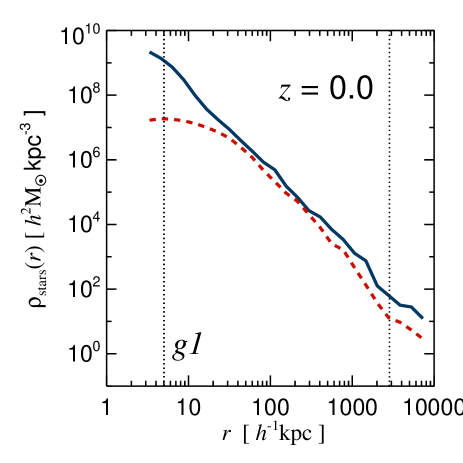
In Figure 10, we show radial profiles of gas and stellar metallicity, in Solar units, for the g676 and g1 cluster simulations at . The continuous lines show the metallicity profiles without AGN feedback, while the dashed lines illustrate how these profiles change when our BH model is “switched-on”. The stellar metallicity is reduced at all radii, while the gas metallicity shows a tilt: it is reduced in the innermost regions, for , while it is increased for larger radii. These changes in the metallicity gradients are caused by two effects: first, due to the AGN feedback the total number of stars is reduced, not only in the central regions, but all over the cluster, as illustrated in Figure 11; second, some of the metals accumulated in dense, star-forming regions are expelled into the hot ICM. This mechanism drives the tilt in the gas metallicity, increasing the metal content of the hot intracluster gas.
| Simulation | [] | [] | [] | [] | |||
|---|---|---|---|---|---|---|---|
| R1 | |||||||
| R2 | |||||||
| R3 |
The effect of AGN heating on the metal production and mixing in clusters brings the simulated gradients into a much better agreement with observational results. However, the simulated gas metallicity in the cluster outskirts appears still too low in comparison with the metallicity levels of cool core clusters at similar radii (e.g. De Grandi & Molendi, 2001). This discrepancy may in part be attributed to the fact that in these simulations we have not included feedback effects from galactic winds and outflows powered by star formation. As we have shown in Sijacki & Springel (2006), galactic winds help spreading metals throughout the cluster environment, especially into the outer parts. Another restriction of our model for metal enrichment lies in its highly simplified treatment of supernovae, where we neglect the time delay of supernovae type Ia. More sophisticated models of chemical enrichment (e.g. Tornatore et al., 2004; Scannapieco et al., 2005; Kobayashi et al., 2007) that take this into account might therefore help as well.
We now turn to the effects of AGN feedback on the stellar properties of the simulated clusters. In Figure 11, it can be seen that the stellar density is reduced at all radii in both clusters, as we have anticipated above. This reduction is caused not only by the activity of the central cluster BH, but also by other BHs that are harboured at the centres of individual galaxies throughout the cosmic evolution. As we will discuss in more detail in Section 5.2, when a BH at the centre of a given galaxy becomes massive enough to influence its host, it acts on the stellar properties by reducing both the instantaneous SFR as well as the integrated total stellar mass by a significant amount.
In Table 4, we list a number of properties we have measured for the central cluster galaxy. For the identification of the cD galaxy, we have simply taken its radius to be , based on the apparent break in the stellar density profile at this radius. A number of interesting results can be noticed from the values in the table: due to the AGN feedback, the stellar mass of the cD galaxy is significantly reduced, as well as the central total gas mass. There is some residual cold gas in the cD galaxy, but star formation is completely quenched. This has an immediate and important consequence for the photometric colours of the cD galaxies. In order to estimate the colours, we have used the stellar population synthesis models of Bruzual & Charlot (2003) and computed the rest-frame magnitudes in the SDSS bands, assuming Solar metallicity and a Chabrier initial mass function. Both cD galaxies in our cluster simulations become much less luminous in the , and -bands as a result of AGN feedback, such that the and colour indices are substantially increased. This reflects the fact that the stellar populations of the cD galaxies have become much older in our BH model, with very little recent star formation. With these properties, the simulated cD galaxies are in quite good agreement with observational findings (e.g. von der Linden et al., 2007), in terms of their stellar mass, their SFR and their colours.
Finally, we briefly discuss whether the Eddington limit that we have imposed on the BHAR has a significant effect on the BH growth and the feedback in clusters. For this purpose we have rerun the g676 galaxy cluster simulation with exactly the same feedback parameters, but relaxing the maximum accretion rate assumption. In Figure 9, we have included results for the radial profiles of gas density, temperature and entropy in this run as dotted green lines. It can be seen that the ICM properties are modified slightly more strongly in this case with respect to our default model, i.e. the AGN feedback effects appear to be somewhat stronger. A closer look at the detailed mass growth and accretion rate history of the BH as function of redshift shows that the feedback is regulating the BHAR even without an upper limit in the form of the Eddington rate. In fact, the total mass of all BHs at in the simulated volume increases only by roughly if the Eddington limit is disregarded. The most massive BH in the cluster centre shows an increase of its mass of the same order. This additional growth of the BH mass mostly comes from brief episodes of very high accretion rate (typically reaching a few times up to ten times ), which are quickly terminated by the onset of AGN heating. Without an explicit Eddington limit, a bit more growth can happen before the ‘suicidal’ AGN activity shuts off the accretion, but the limit itself is not required for establishing a stable self-regulation loop. The Eddington limit therefore does not seem to pose an important restriction on the growth of BHs in clusters. However, this may still be quite different in the early phases of BH accretion at high redshifts, when the BH mass is so low that feedback effects are weak. Then the Eddington limit sets the shortest growth timescale that can be realized, which makes it a challenge to grow BHs quickly enough to the observationally inferred large masses already at very high redshifts. We plan to address this interesting problem in full cosmological simulations in future work.
5 Simulations of galaxy formation with AGN feedback
In this section we analyse BH growth and feedback in simulations of cosmic structure formation in homogeneously sampled volumes. We are mainly interested in the question whether our numerical model for a two-mode AGN growth produces realistic results for a range of object masses, from the scales of isolated galaxies to the ones of massive galaxy clusters. In Section 4, we have already confirmed that the BH model works well for clusters of galaxies, where it in fact drastically improves the properties of simulated galaxy clusters with respect to observations, and yields at the same time plausible evolutionary histories for the BH masses and the accretion rates. Here, we want to see whether this success also carries over to the scale of individual galaxies, where the “quasar” mode of feedback will be dominant. In particular, we want to establish whether our unified model for AGN feedback maintains and extends the successes we have found in Di Matteo et al. (2007) for the high-redshift galaxy population in a model that only accounts for the “quasar” mode.
We have performed hydrodynamical simulations of a cosmological box with on a side, at three different mass resolutions, as summarized in Table 5. The small box-size allows us to study comparatively small galaxies with stellar masses in the range of to . However, since the fundamental mode of this small box becomes non-linear at around , we had to stop the simulations at this redshift, since they would not be representative any more for the low-redshift universe. For the initial conditions, we have used a ‘glass’ as unperturbed particle load and the power spectrum fit of Eisenstein & Hu (1999) for imposing initial perturbations with WMAP-3 cosmological parameters (Spergel et al., 2007). In particular, we have adopted a CDM cosmology with , , , , and at the present epoch, and a primordial spectral index of .
For all three mass resolutions R1-R3 that we considered, we have computed two runs, one only with cooling and star formation and the other with the BH model included as well. The parameters of the BH model were exactly the same as the ones adopted in our cosmological simulations of galaxy cluster formation. For our intermediate resolution case R2, we have carried out additional simulations to study the influence of further parameters. This includes a run where we used the same cosmological parameters as in Section 4 in order to gauge the importance of the cosmological model. We have also explored the relative importance of the bubble feedback on galactic scales relative to the quasar feedback, that we will discuss more in detail in Section 6. Finally, we have studied the influence of including a model for supernova-driven galactic winds with velocity , which can be especially important in low mass systems, as we will discuss below.
5.1 Black hole growth
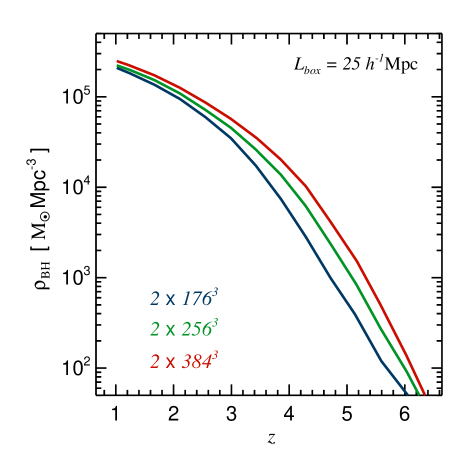
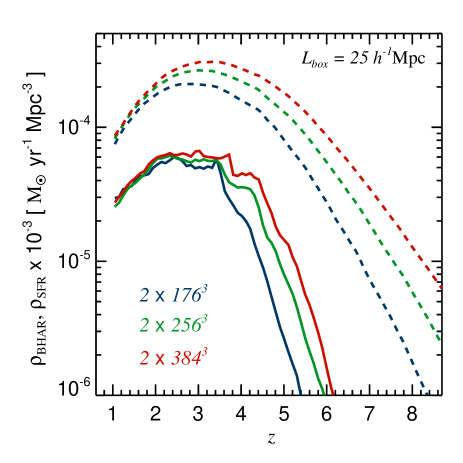
In Figure 12, we consider the comoving BH mass density (left-hand panel) and BHAR density (right-hand panel) as a function of cosmic time. For comparison, we also show the redshift evolution of the SFR density (right-hand panel, dashed lines), which we have rescaled by a constant factor of to put the curves onto the same plot. It can be seen that the BHAR and SFR densities approach each other asymptotically towards low redshifts when the numerical resolution is increased. The fact that numerical convergence can be more easily achieved at low than at high redshift is not surprising in light of the hierarchical growth of structure. At high redshift, most of the small mass systems that undergo star formation and BH accretion in our highest resolution simulation are unresolved in our low resolution simulation, which hence underpredicts the BHAR and SFR density. However, towards later times, the mass scale where most of the accretion happens shifts to larger mass objects, which can be resolved in all of our simulations, such that approximate convergence can be reached even with moderate resolution. This behaviour is also similar to the one seen by Springel & Hernquist (2003b) in a comprehensive simulation study of the cosmic star formation rate history. We consider it highly encouraging that we find such a behaviour for our BH growth model as well, which shows that the model is numerically well posed and can be meaningfully applied to cosmological volumes with their comparatively poor resolution per galaxy.
Nevertheless, it is clear that the numerical resolution in our cosmological runs remains too poor to correctly resolve the internal structure of galaxies, in particular the thin gaseous and stellar disks in spiral galaxies. This presumably affects the detailed time evolution of star formation and black hole accretion in galaxy mergers. For example, our cosmological runs will largely blend over the time delay we see in high-resolution galaxy mergers between BH activity and the peak of the star burst. But the final BH mass reached in a merger is comparatively insensitive to these details and probes primarily the depth of the gravitational potential of the forming spheroid, which our simulations can still represent quite well. While numerical resolution is clearly an important limitation in our cosmological results, we therefore believe they are reasonably accurate for the basic properties of the BH population.
Our estimated BH mass density at in our highest resolution run is . This is in very good agreement with a number of observational estimates, based both on optical and X–ray data, which typically find values in the range of (e.g. Fabian & Iwasawa, 1999; Merritt & Ferrarese, 2001; Yu & Tremaine, 2002; Cowie et al., 2003; Graham et al., 2007). The SFR density shows a peak at , while the BHAR density peaks at somewhat lower redshift, i.e. . The BHAR and SFR then decline to lower redshifts, with the SFR density decreasing slightly more steeply. If we extrapolate the BHAR and SFR densities to , the ratio of the two is of order of , a value that is roughly in agreement with estimates from the local population of galaxies (Heckman et al., 2004). In contrast, at high redshift, the BHAR density is rising more steeply than the SFR density, in broad agreement with the estimates by Merloni et al. (2004).
However, Hopkins et al. (2007b) find that the quasar luminosity density declines more steeply for than in our simulations. It is quite plausible that this discrepancy at high redshift is due to the limited numerical resolution available in our cosmological simulations, and in particular, their inability to correctly reproduce galactic disks of the right sizes, as discussed above. While the bulk of the BH accretion happens during major merger events in our simulations, we expect that there is a significant contribution from minor merger episodes or secular processes, which boost the BHAR at high and induce a less steep rise. If the galaxies could be fully spatially resolved, the gas would instead not be able to easily reach the galactic centres in these minor merger events. Nonetheless, it is encouraging that the shapes and the peaks of the SFR and BHAR densities we find are significantly different, clearly indicating that the BHAR is not simply following the evolution of the SFR with time. Finally, by comparing the simulations with and without AGN feedback we conclude that the SFR density starts to be noticeably reduced by BH heating for , and at , this reduction is of order .
In Di Matteo et al. (2007), similar results for the BH mass density and BHAR density are obtained for a cosmological box performed at somewhat higher numerical resolution, further supporting the trends we find here. The peak of the BHAR density appears moderately broader here than in Di Matteo et al. (2007), which could be a result of our smaller simulation box, or simply due to different choices of cosmological parameters, or due to the absence of galactic winds in Figure 12. As we shall discuss in detail in Section 6, the ‘radio mode’ does not play a significant role at high redshift and hence is unlikely to modify the shape of the BHAR evolution at the peak of the quasar activity.
In the left-hand panel of Figure 13 we show how the BHAR evolves with redshift as a function of the BH mass. We have already considered an analogous plot for our galaxy cluster simulations in Figure 7. While the two plots are consistent for the overlapping range of BH masses, the most striking difference can be seen at the high BH mass end: in the galaxy cluster simulation we saw an upturn of the BHAR at low redshifts for very massive BHs, while here instead the BHAR keeps decreasing with increasing BH mass at all redshifts considered. This can be understood as a consequence of the limited size of the cosmological box. As a result of the small volume, rare big objects are absent, and hence massive BHs residing in cluster-sized objects are missing as well.
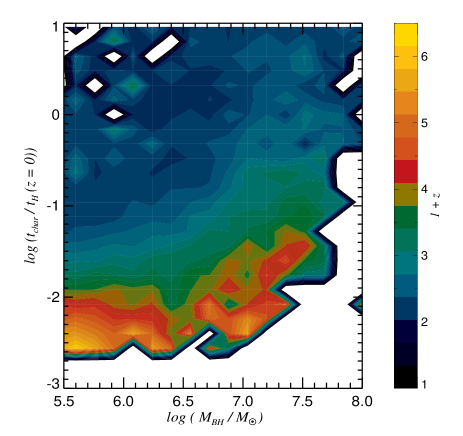
The characteristic time of BH growth, as a function of the BH mass, is illustrated in the right-hand panel of Figure 13. For each BH, we have defined the characteristic growth time as the ratio of its mass to its accretion rate at the given redshift, normalized to the Hubble time at the present epoch. It can be seen that the BH growth time is shortest at high redshifts and for the smallest BHs. At , BHs with mass of order of reach a characteristic growth time of the order of the Hubble time for the first time. At different redshifts, the curve has a similar shape, which is consistent with results obtained for the local galaxy population (Heckman et al., 2004).
5.2 Effects on the intergalactic medium
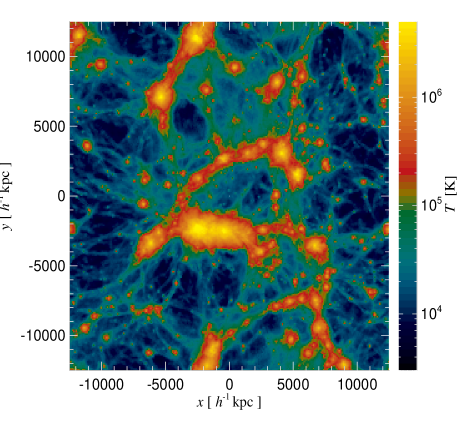
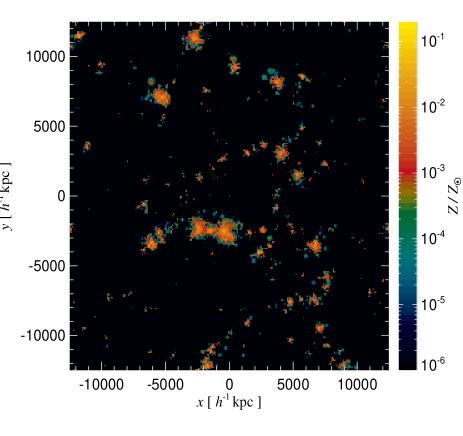
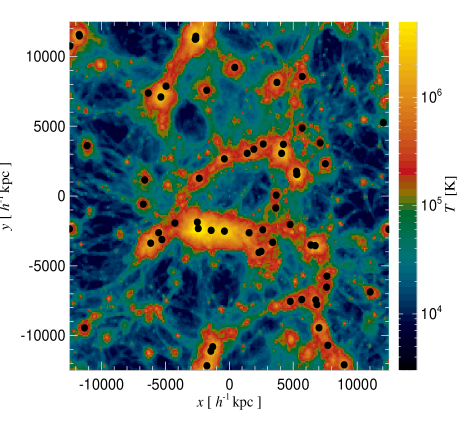
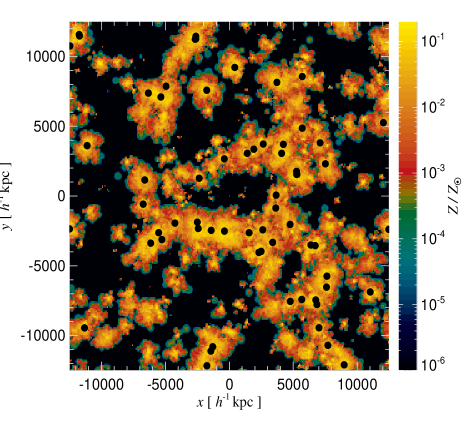
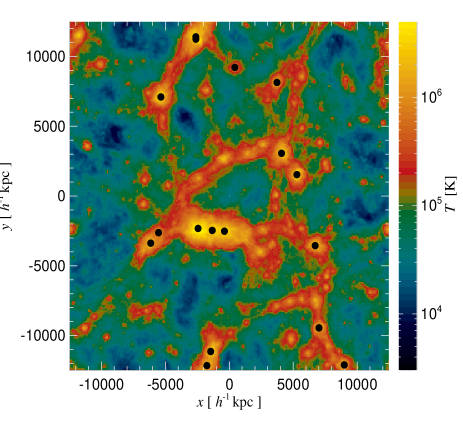
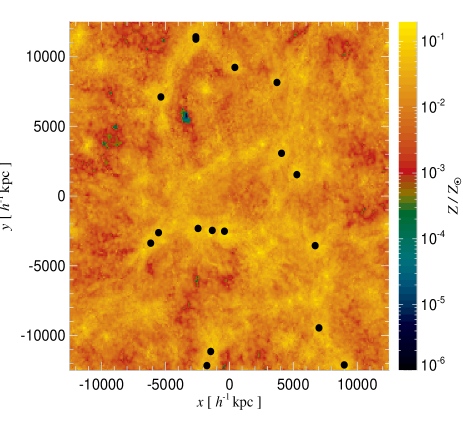
In Figure 14, we show projected mass-weighted temperature and metallicity maps of our cosmological box at . In the upper row, the run with cooling and star formation only is plotted, while the other two rows give results for simulations where the AGN feedback was included. In the lower row, feedback by galactic winds was additionally included. The positions of BHs more massive than are marked with black dots. It can be seen that galactic winds modify the gas temperature and metallicity properties more significantly than the BH feedback alone. As expected, galactic winds are especially important in low mass systems, given that they can expel gas from objects with small escape speeds relatively easily due to their shallow potential wells. Galactic winds can therefore pollute a sizable fraction of the volume of the intergalactic medium (IGM) with metals, to a level of of the Solar metallicity, in agreement with a number of observational findings (e.g. Rauch et al., 1997; Cowie & Songaila, 1998; Schaye et al., 2000; Ellison et al., 2000).
However, as can be seen from Figure 14, AGN contribute to the process of metal pollution of the low density gas, albeit with lower efficiency. If only AGN feedback is considered, we find that metals can be transported up to a distance of from a galactic centre, but the large-scale metallicity distribution remains extremely patchy. Thus, the main difference relative to enrichment by galactic winds lies not only in the level of IGM metal enrichment, but in the volume filling factor of the metal-enriched regions. Nevertheless, by redshift , AGN feedback is making an important contribution to the enrichment of the IGM, where the characteristic size of high metallicity regions is of the order of . However, we should point out that the AGN impact on the metal distribution found in our simulations is probably a lower limit, due to the fact that we cannot account for the contribution of very bright quasars powered by massive BHs at high redshifts.
Interestingly, even though AGN heating is affecting the gas metallicity of the IGM, it hardly affects its mean temperature, which is probably a reflection of the small volume filling factor of AGN-driven outflows. In contrast, galactic winds raise the intergalactic temperature significantly. Since this can delay the formation of small galaxies, the number and the mass of galaxies at a given epoch is reduced as well, which in turn slows the growth of the BH mass density.
5.3 Galaxy properties and evolution
We now study the question how the properties of galaxies are affected by BH feedback, and how the BH masses relate to their hosts. For this purpose, we identify the galaxies present in our cosmological box at different redshifts using a special group finder, and compute a number of properties for them, e.g. their stellar mass , stellar velocity dispersion , their total SFR, and their colours in the rest-frame SDSS bands. This also allows us to look for correlations with their central BH masses. Our scheme for identifying simulated galaxies as isolated groups of stars is based on a simplified variant of the SUBFIND algorithm (Springel et al., 2001a). We first compute an adaptively smoothed baryonic density field for all stars and gas particles, allowing us to robustly identify centres of individual galaxies as isolated density peaks. Using SUBFIND’s approach for growing these centres by attaching nearby particles of ever lower density, we then obtain a list of cleanly separated galaxies. By restricting the set of gas particles processed in this way to those that have at least a density of 0.01 times the threshold density for star formation, we avoid that spatially separated galaxies are linked together, while all the stars present in the simulation are assigned to the different galaxies. A gravitational unbinding procedure is then not necessary in this procedure. Note that we are not interested in the gaseous components of galaxies here. We only include the gas particles in the galaxy finding procedure because the dense, cold gas that most galaxies contain makes the method more robust.
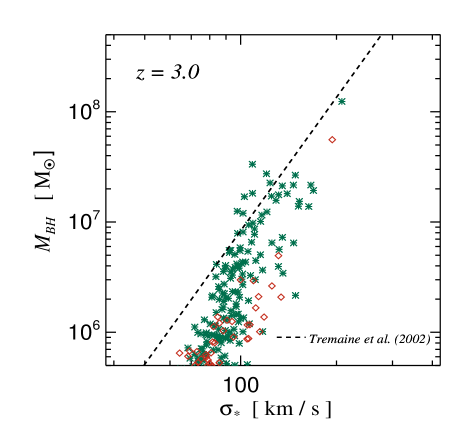
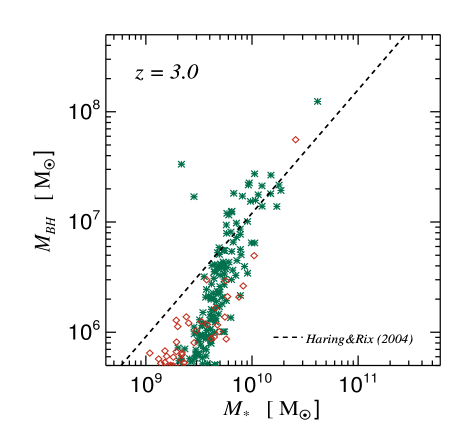
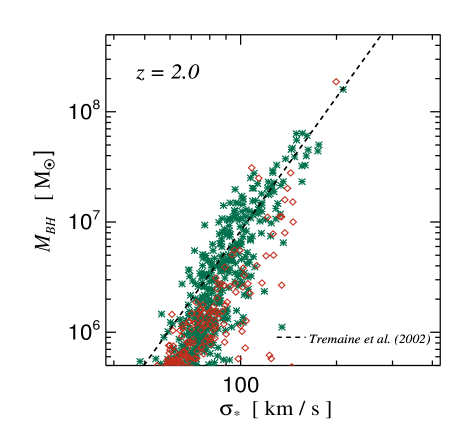
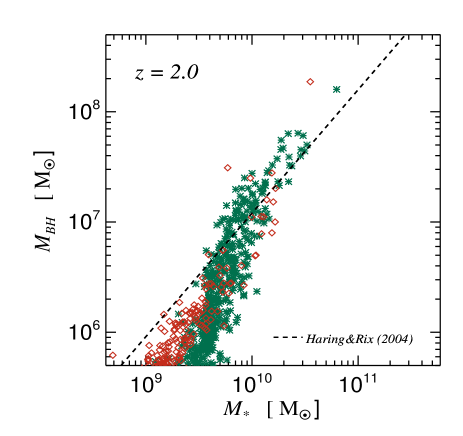
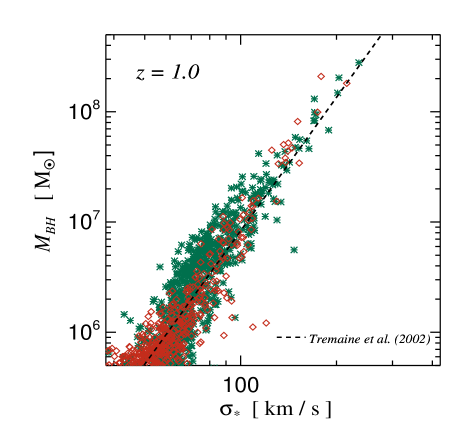
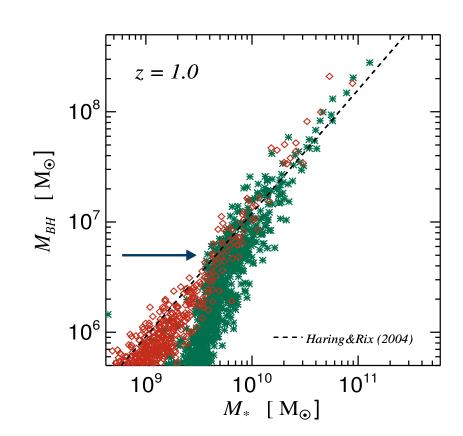
In Figure 15, we show the relation between BH mass and stellar velocity dispersion (left-hand panels), and between BH mass and (right-hand panels), at three different redshifts, and . Here we evaluate and within the effective radius, , chosen as the half-mass radius. Green star symbols are for the run without galactic winds, while red diamonds are for the simulation that also includes galactic winds. The results shown are from our intermediate resolution box, but we have verified good convergence in these quantities by comparing with the R3 box. With the dashed lines we overplot the locally observed and relations, as determined by Tremaine et al. (2002) and Häring & Rix (2004), respectively. A number of interesting features are noteworthy in this figure:
-
1.
Both relations show some evolution with redshift that however seems most prominent at the low BH mass end and for the run with galactic winds. The most massive objects found at every epoch stay very close to the local relation over the redshift interval considered.
-
2.
At high redshifts, galactic winds give rise to less massive galaxies with somewhat lower , and for a given or , BHs are less massive when the winds are “switched-on”. However, by redshift and for , the central BH masses are comparable for a given stellar mass of a galaxy, regardless of the presence of winds. This suggests that the feedback by galactic winds is delaying BH growth by expelling significant amounts of gas at high redshift. However, this gas becomes available for BH accretion at latter epochs, when it has been reincorporated from the IGM back into the galaxies.
-
3.
For BH masses smaller than (as indicated with the arrow in Figure 15) there is a tilt in both relations, especially noticeable for the relation. This tilt is significantly reduced in the run with galactic winds. This can be understood by considering that the AGN feedback in these small galaxies is very modest, and does not modify the properties of the hosts significantly. On the other hand, galactic winds are very efficient for these low mass objects, reducing their stellar mass and bringing them into better agreement with the expected relation. However, we caution that this result of our modelling may be sensitive to our prescription for BH seeding and the early initial growth, which could be affected by numerical resolution effects. If small mass galaxies could grow somewhat bigger BHs in their centre, they would also be more affected by BH feedback so that it may not be necessary to invoke galactic winds to match the low mass end of the relation. In any case, it is interesting that galactic winds shift these smaller objects in the desired direction while at the same time more massive galaxies are unaffected and still lie on the local relation.
-
4.
Finally, given that the simulated and relations at match the locally observed relations well it would be interesting to explore how the model will evolve further until . It seems quite likely, especially for more massive galaxies, that not much evolution will occur for , given that these galaxies have a reduced star formation and depleted gas content due to the AGN feedback. However, considering the complex interplay between BHs and galactic winds, a reliable answer of this question will require explicit numerical simulations of a bigger cosmological box at comparable or better resolution, which we will tackle in future work.
In Di Matteo et al. (2007), a measurement of the and relations is presented as well, for an overlapping redshift range. Their results extend to somewhat higher BH mass, due to their larger box-size and their higher normalization of the power spectrum. In general, we find a reassuring agreement with the findings of Di Matteo et al. (2007), indicating that the and relations are not significantly affected by the bubble feedback or the underlying cosmology, as we will discuss latter on in more detail. Only for the relations at , our measurements lie somewhat below those of Di Matteo et al. (2007), a trend that we attribute to the fact that we required dark matter halos to be five times more massive than Di Matteo et al. (2007) before we endowed them with a seed black hole, which may have delayed their early growth.
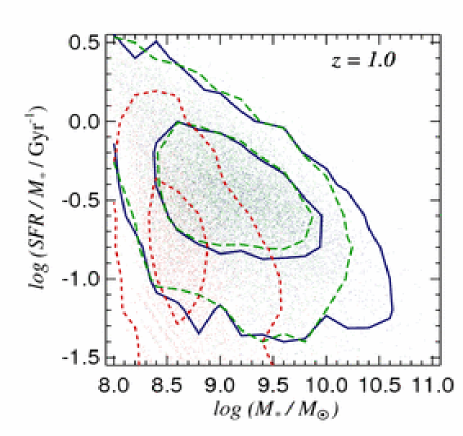
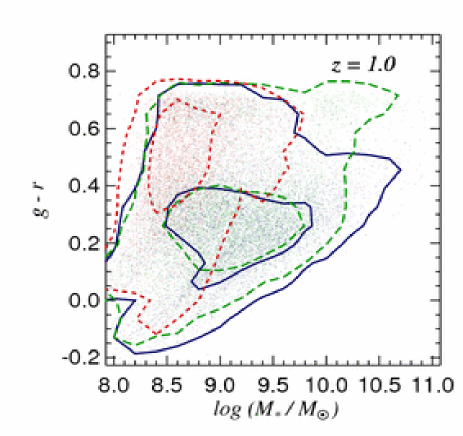
In Figure 16, we show the specific SFRs and the colours of our simulated galaxies at as a function of their stellar mass. Blue dots and blue continuous contours show the results when only cooling and star formation is considered. Green dots and long-dashed contours give the results for the run with AGN feedback, while red dots and short-dashed contours represent the case with additional galactic winds. While AGN feedback does not affect the bulk of the population significantly, it is evident that the stellar masses and the SFRs of most massive galaxies are reduced. When feedback by galactic winds is included as well this trend is even more pronounced, and extends to the lower mass systems. Note also that the galaxy colours change in our BH model – a number of galaxies become much redder, forming a red sequence, as it is shown in the right-hand plot of Figure 16. However, if the galactic wind model is included, the clearly defined red sequence disappears. Instead, all galaxies are in general less massive and redder. The fact that the red sequence becomes largely unpopulated in the run with galactic winds is not necessarily problematic, however. A larger cosmological box may again fill this region of the diagram with a population of more massive galaxies.
Finally, in order to assess whether the colours of our galaxies in the AGN feedback model are realistic, we have computed the mean colour of the red sequence at , obtaining . We can compare this result to the work of Bell et al. (2004) on the COMBO-17 survey. Using the conversion between and colours suggested by these authors, we find that the colour of our simulated galaxies along the red sequence is in good agreement with the early-type galaxies from the COMBO-17 survey.
5.4 Dependence on cosmological parameters
In order to evaluate how sensitively our BH model depends on the underlying cosmological model, we have performed two additional simulations at intermediate resolution (R2) with exactly identical BH parameters. In one case we have adopted cosmological parameters consistent with the WMAP 1st-year data analysis, while for the other run we have selected the updated parameters of WMAP’s 3rd year data release. The main difference between the corresponding cosmological models lies in a reduction of the normalization parameter (), a lowering of the matter density () and in the introduction of a tilt in the primordial power spectrum slope ().
Our results show that BHs form earlier in the WMAP-1 cosmology, as expected from the fact that host halos above a given mass threshold appear earlier in this model due to the higher normalization, and are therefore seeded with a BH at higher . Also, the number density of BHs is higher and there are more high mass BHs at lower redshift with respect to the WMAP-3 run. Consequently, the comoving BH mass density is somewhat higher in the WMAP-1 cosmology. At , it is , while for WMAP-3 we obtain at the same numerical resolution. The BHAR density is higher in the WMAP-1 model as well, with its peak shifted to a slightly earlier redshift of . However, for lower redshifts this is compensated by a steeper decline, such that at the BHAR densities have a very similar value in both cosmologies. These trends can simply be understood as a result of “delayed” structure formation in the WMAP-3 cosmology. Increasing will let the BHs form earlier, evolve faster, and reach their peak activity at higher redshift. Interestingly, within the scatter, the and relations are however not significantly affected by the change in the cosmological parameters.
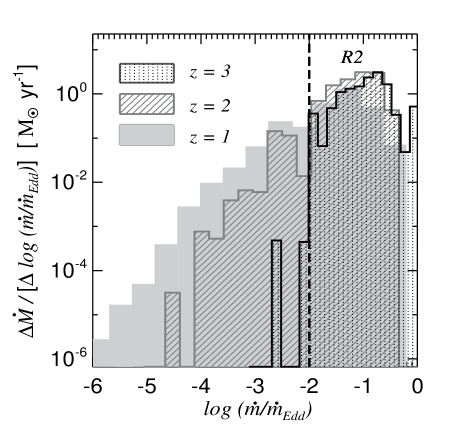
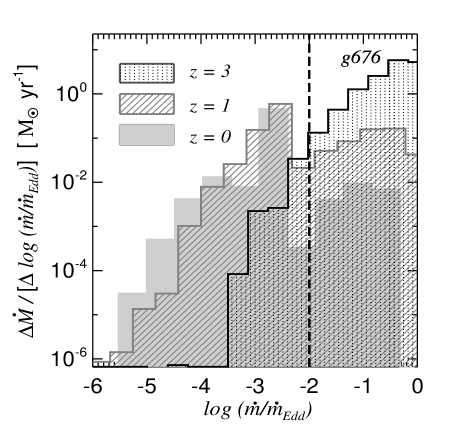
6 Relevance of radio versus quasar feedback mode
In this section, we explore the relative importance of our two different modes of black hole growth and quasar feedback for the build-up of the cosmological black hole mass density. For this purpose, we show in Figure 17 the distribution function of the net black hole mass accretion rate in , as a function of the Eddington-normalized accretion rate. In the left-hand panel, we give results for our cosmological box R2 at redshifts , and , while on the right-hand side we show results for the g676 galaxy cluster simulation at different redshifts.
It can be seen that at the bulk of the BH growth occurs in the “quasar” mode, where the accretion rate is more than 0.01 times the Eddington rate. In fact, the “radio” mode contributes less than to the total BHAR at this epoch, and for the g676 cluster simulation, the contribution from growth in this radiatively inefficient mode is similarly small (). At lower redshifts, BHs accreting at low rates make up for an increasingly higher fraction of the total BHAR density (which however declines with time). For the R2 simulation at they contribute , and at they are at . Instead, for the g676 galaxy cluster, these numbers are somewhat higher, with at and at coming from BHs in a low accretion state. Thus, while in the cosmological box BHs in the quasar regime are the main channel of BH growth at all epochs considered, for the galaxy cluster run there appears to be a transition epoch at , below which BHs in the “radio” mode are driving the BH growth at low redshifts. This difference between the BHAR distributions for the R2 run and the g676 cluster simulation can be explained by the presence of a dominating, very massive BH in the centre of the main progenitor of the cluster simulation, while the cosmological box contains a much fairer sample of the black hole mass function.
However, integrating the BHAR over cosmic time for all BHs in the simulated volumes, we find that the bulk of BH mass is always grown during phases of quasar activity, i.e. in the high accretion rate regime. In fact, BH accreting in the “radio” mode contribute less than to the integrated black hole mass density in the cosmological box, while for the g676 cluster simulation this number is . Performing the same calculations for our g1 galaxy cluster simulation we obtain a very similar result (), further strengthening this point. Thus, we conclude that most of the BH mass is assembled during periods of rapid growth in the radiatively efficient “quasar” mode. This implies that our models are consistent with the Soltan argument (Soltan, 1982; Yu & Tremaine, 2002; Marconi et al., 2004; Merloni, 2004; Hopkins et al., 2006b), and shows that merger-driven quasar activity is still dominating the black hole assembly in our unified model for AGN feedback.
Furthermore, by repeating our cosmological box simulations without “radio” mode feedback we have explicitly checked that the inclusion of bubble feedback has a negligible influence on the and relations. Only at , the “radio” mode makes BHs slightly less massive due to the somewhat more efficient heating by the bubbles. Thus, quasar activity triggered by the merging of host galaxies is the primary process responsible for establishing the scaling relationships between the central supermassive BHs and their host galaxies, and this process remains intact and is essentially unaffected if an additional “radio” mode feedback is invoked in the low accretion state of BHs.
On the other hand, our simulations also show that the “radio” mode feedback in the form of AGN-driven bubbles is essential in massive groups and clusters. In order to demonstrate this point directly, we have rerun our g676 galaxy cluster simulation by switching off the radio channel of feedback mode, only allowing the ordinary quasar activity to proceed until . This results in simulated ICM properties that are in disagreement with observations. In particular, the gas temperature profile keeps rising towards the very centre. Thus the intermittent nature of our bubble feedback appears necessary in this respect, as well of course for explaining the observed phenomena of radio galaxies and X-ray cavities in clusters of galaxies.
7 Discussion and Conclusions
In this study, we have proposed a new model for following BH growth and feedback in cosmological simulations of structure formation. Within our prescription, BH seeds are introduced at early cosmic times in the centres of all halos once their mass exceeds a certain threshold value for the first time. The BH seeding is accomplished by frequently running a FoF algorithm on the fly in our simulation code, which identifies newly formed halos and their properties. The BHs themselves are represented as collisionless sink particles that can grow their mass via two channels, by (1) gas accretion with an accretion rate estimated by a simple Bondi formulae, and (2) via mergers with other BHs that are close enough. Motivated by the observed phenomenology of radio galaxies and quasars, and by analogy with X–ray binaries, we have assumed that the AGN feedback that accompanies gas accretion can be decomposed into two physically distinct modes: BHs accreting at high accretion rates in terms of their Eddington limit are operating in a radiatively efficient “quasar” regime, while BHs accreting at much lower rates live in a radiatively inefficient “radio” mode, which however produces significant mechanical luminosity that gives rise to jet-inflated bubbles.
In our initial tests of the model, we have applied it to simulations of isolated galaxy clusters consisting of a static dark matter potential and gas in hydrostatic equilibrium. Considering a range of cluster masses from to , we have found that the model leads to a self-regulated AGN feedback that produces realistic ICM properties and prevents the overcooling problem in the central cluster regions. At the same time, it yields reasonable BH masses and accretion rates.
We have then applied our model to fully self-consistent cosmological simulations of galaxy cluster formation, where the seeding of BHs and their subsequent growth is followed self-consistently. Together with our work in Di Matteo et al. (2007), these simulations are the first cosmological hydrodynamical models that simultaneously follow the growth of structure in the dark matter as well as the baryonic physics of star formation and AGN feedback. These simulations provide information on how the BHs are spatially distributed in the simulated volume, how they grow with cosmic time as a function of their environment, and how they influence the surrounding medium and their host galaxies.
Our analysis of these calculations has focused on the history of the BH in the central cD galaxy. We have shown that while essentially all the mass in supermassive BHs originates in gas accretion, a large fraction of the mass of the BH in the cD grows from mergers with other BHs, as opposed to being all accreted by a single massive progenitor. This suggests that mergers of supermassive BHs are an important factor for building up very massive BHs. In line with our findings for the isolated cluster simulations we found that feedback from BHs is preventing the formation of excessive cooling flows out of hot cluster atmospheres, and is changing the central ICM properties substantially in the process. These changes are all acting to bring the simulated temperature and entropy profiles into much better agreement with observational findings of cool core clusters (e.g. De Grandi & Molendi, 2002; Pratt & Arnaud, 2003; Ponman et al., 2003; Vikhlinin et al., 2005; Bauer et al., 2005; Dunn & Fabian, 2006; Sanderson et al., 2006; Pratt et al., 2007). Moreover, the stellar properties of the central galaxy are affected as well, with the forming cD galaxies being less massive, and having older and redder stellar populations which are consistent with the results found in recent studies of a large sample of BCGs in the SDSS survey (von der Linden et al., 2007).
We have also studied our unified AGN feedback model in simulations of homogeneously sampled cosmological volumes, thereby investigating how successful it is on the scale of galaxies, and with respect to the mean properties of the cosmic population of BHs. In our simulation box of size on a side, we were able to resolve galaxies with stellar masses greater than . We have found that our model produces a comoving BH mass density equal to , which is in very good agreement with observational estimates (Fabian & Iwasawa, 1999; Merritt & Ferrarese, 2001; Yu & Tremaine, 2002; Cowie et al., 2003). Moreover, the AGN feedback influences the properties and the formation of the host galaxies and vice versa, and this mutual coupling establishes and relationships already at early epochs. Again, these relations are in broad agreement with observations, at least for the more massive and better resolved systems. Interestingly, a model that besides BH feedback includes feedback from supernova-driven galactic winds produces a better match to the expected relationships at the low mass end. At the same time, this model also leads to a much more widespread enrichment of the IGM, which appears required by the data on quasar absorption line systems. Additionally, AGN heating reduces the stellar mass of the most luminous galaxies identified in the simulated volume, and it affects their SFR and colours as well. The galaxies in simulations with AGN feedback show a clearly defined red sequence already at .
Finally, we have explored the relative importance of “radio” versus “quasar” mode. We have found that the bulk of the BH growth occurs at high accretion rates, corresponding to radiatively efficient AGN activity. While the relative importance of the “radio” mode grows towards late times, and becomes large in clusters of galaxies at , this mode of accretion is unimportant for the total black hole mass density today. This also implies that our model is consistent with the Soltan argument. We also found that the feedback of the quasar regime is the key factor for establishing the and relationships, a process that appears unaffected by the bubble feedback. On the other hand, the mechanical luminosity of AGN-driven bubbles in groups and cluster of galaxies is necessary in order to successfully reproduce the observed ICM properties.
These results represent highly encouraging successes for hydrodynamical models of hierarchical galaxy formation in CDM cosmologies, and provide support for the theoretical conjecture that galaxy formation and supermassive BH growth are intimately linked. In spite of these successes we need to emphasize that our BH model clearly represents a drastically simplified picture of BH physics. In part, the simplifications are driven by numerical limitations, because even state-of-the-art simulations of galaxy formation in cosmologically representative regions of the Universe cannot directly resolve the gravitational sphere of influence of individual BHs. We are therefore forced to adopt a subresolution approach for the representation of BH accretion, and also for the modelling of bubble feedback where the initial stages of bubble inflation by a jet are not resolved. However, this subresolution approach can still capture the essential parts of the physics relevant for the coupling of the BHs to their larger-scale environment, and this is what allows us to study their cosmological significance for galaxy formation.
While we have tried in this study to shed some light onto the entangled histories of galaxies and their central BHs, a number of important questions remain open for future work, and our model appears suitable to help answering them. They include: (i) The early growth of BHs - can the observed ‘downsizing’ of BH growth be reproduced by our model? (ii) Do the galaxy cluster scaling relations change as a result of the AGN feedback? (iii) Can a galaxy luminosity function with a bright end consistent with observational constraints be reproduced in cosmological simulations, and what is the respective AGN luminosity function? (iv) Do the quasar clustering properties come out right?
Indeed, AGN appear to be a key ingredient of structure formation, and future numerical simulations should be a very helpful theoretical tool to unveil the intriguing and complex picture of their interactions and growth.
Acknowledgements
We are grateful to Simon White, Eugene Churazov, Andrea Merloni and Martin Haehnelt for very stimulating discussions and useful comments on the manuscript. We thank Klaus Dolag for proving us with galaxy cluster initial conditions used in this study. DS acknowledges the PhD fellowship of the International Max Planck Research School in Astrophysics, and the support received from a Marie Curie Host Fellowship for Early Stage Research Training.
References
- Allen et al. (2006) Allen S. W., Dunn R. J. H., Fabian A. C., Taylor G. B., Reynolds C. S., 2006, MNRAS, 372, 21
- Barger et al. (2005) Barger A. J., Cowie L. L., Mushotzky R. F., et al., 2005, AJ, 129, 578
- Barnes & Hernquist (1992) Barnes J. E., Hernquist L., 1992, ARA&A, 30, 705
- Bauer et al. (2005) Bauer F. E., Fabian A. C., Sanders J. S., Allen S. W., Johnstone R. M., 2005, MNRAS, 359, 1481
- Begelman & Cioffi (1989) Begelman M. C., Cioffi D. F., 1989, ApJ, 345, L21
- Bell et al. (2004) Bell E. F., Wolf C., Meisenheimer K., et al., 2004, ApJ, 608, 752
- Binney & Tabor (1995) Binney J., Tabor G., 1995, MNRAS, 276, 663
- Bîrzan et al. (2004) Bîrzan L., Rafferty D. A., McNamara B. R., Wise M. W., Nulsen P. E. J., 2004, ApJ, 607, 800
- Blandford & Begelman (1999) Blandford R. D., Begelman M. C., 1999, MNRAS, 303, L1
- Bondi (1952) Bondi H., 1952, MNRAS, 112, 195
- Bondi & Hoyle (1944) Bondi H., Hoyle F., 1944, MNRAS, 104, 273
- Bruzual & Charlot (2003) Bruzual G., Charlot S., 2003, MNRAS, 344, 1000
- Cappelluti et al. (2005) Cappelluti N., Cappi M., Dadina M., et al., 2005, A&A, 430, 39
- Cappi et al. (2001) Cappi M., Mazzotta P., Elvis M., et al., 2001, ApJ, 548, 624
- Chartas et al. (2003) Chartas G., Brandt W. N., Gallagher S. C., 2003, ApJ, 595, 85
- Churazov et al. (2001) Churazov E., Brüggen M., Kaiser C. R., Böhringer H., Forman W., 2001, ApJ, 554, 261
- Churazov et al. (2005) Churazov E., Sazonov S., Sunyaev R., Forman W., Jones C., Böhringer H., 2005, MNRAS, 363, L91
- Churazov et al. (2002) Churazov E., Sunyaev R., Forman W., Böhringer H., 2002, MNRAS, 332, 729
- Cowie et al. (2003) Cowie L. L., Barger A. J., Bautz M. W., Brandt W. N., Garmire G. P., 2003, ApJ, 584, L57
- Cowie & Songaila (1998) Cowie L. L., Songaila A., 1998, Nature, 394, 44
- Cox et al. (2006a) Cox T. J., Di Matteo T., Hernquist L., Hopkins P. F., Robertson B., Springel V., 2006a, ApJ, 643, 692
- Cox et al. (2006b) Cox T. J., Dutta S. N., Di Matteo T., et al., 2006b, ApJ, 650, 791
- Crenshaw et al. (2003) Crenshaw D. M., Kraemer S. B., George I. M., 2003, ARA&A, 41, 117
- Croton et al. (2006) Croton D. J., Springel V., White S. D. M., et al., 2006, MNRAS, 365, 11
- Dalla Vecchia et al. (2004) Dalla Vecchia C., Bower R. G., Theuns T., Balogh M. L., Mazzotta P., Frenk C. S., 2004, MNRAS, 355, 995
- De Grandi & Molendi (2001) De Grandi S., Molendi S., 2001, ApJ, 551, 153
- De Grandi & Molendi (2002) De Grandi S., Molendi S., 2002, ApJ, 567, 163
- Di Matteo et al. (2007) Di Matteo T., Colberg J., Sijacki D., Springel V., Hernquist L., 2007, ArXiv Astrophysics e-prints
- Di Matteo et al. (2005) Di Matteo T., Springel V., Hernquist L., 2005, Nature, 433, 604
- Dolag (2004) Dolag K., 2004, in The Riddle of Cooling Flows in Galaxies and Clusters of galaxies, edited by T. H. Reiprich, J. C. Kempner, N. Soker, 27–30, to be published electronically at http://www.astro.virginia.edu/coolflow/
- Dunn & Fabian (2006) Dunn R. J. H., Fabian A. C., 2006, MNRAS, 373, 959
- Eisenstein & Hu (1999) Eisenstein D. J., Hu W., 1999, ApJ, 511, 5
- Ellison et al. (2000) Ellison S. L., Songaila A., Schaye J., Pettini M., 2000, AJ, 120, 1175
- Fabian & Iwasawa (1999) Fabian A. C., Iwasawa K., 1999, MNRAS, 303, L34
- Fabian et al. (2006) Fabian A. C., Sanders J. S., Taylor G. B., et al., 2006, MNRAS, 366, 417
- Fan et al. (2001) Fan X., Narayanan V. K., Lupton R. H., et al., 2001, AJ, 122, 2833
- Fender et al. (1999) Fender R., Corbel S., Tzioumis T., et al., 1999, ApJ, 519, L165
- Ferrarese & Merritt (2000) Ferrarese L., Merritt D., 2000, ApJ, 539, L9
- Forman et al. (2006) Forman W., Churazov E., Jones C., et al., 2006, ArXiv Astrophysics e-prints
- Gallo et al. (2003) Gallo E., Fender R. P., Pooley G. G., 2003, MNRAS, 344, 60
- Gebhardt et al. (2000) Gebhardt K., Bender R., Bower G., et al., 2000, ApJ, 539, L13
- Graham et al. (2007) Graham A. W., Driver S. P., Allen P. D., Liske J., 2007, MNRAS, 378, 198
- Häring & Rix (2004) Häring N., Rix H.-W., 2004, ApJ, 604, L89
- Hasinger et al. (2005) Hasinger G., Miyaji T., Schmidt M., 2005, A&A, 441, 417
- Heckman et al. (2004) Heckman T. M., Kauffmann G., Brinchmann J., Charlot S., Tremonti C., White S. D. M., 2004, ApJ, 613, 109
- Heinz et al. (2005) Heinz S., Merloni A., Di Matteo T., Sunyaev R., 2005, Ap&SS, 300, 15
- Heinz et al. (1998) Heinz S., Reynolds C. S., Begelman M. C., 1998, ApJ, 501, 126
- Hopkins et al. (2005) Hopkins P. F., Hernquist L., Cox T. J., et al., 2005, ApJ, 630, 705
- Hopkins et al. (2006a) Hopkins P. F., Hernquist L., Cox T. J., Di Matteo T., Robertson B., Springel V., 2006a, ApJS, 163, 1
- Hopkins et al. (2007a) Hopkins P. F., Hernquist L., Cox T. J., Robertson B., Krause E., 2007a, ArXiv Astrophysics e-prints
- Hopkins et al. (2006b) Hopkins P. F., Narayan R., Hernquist L., 2006b, ApJ, 643, 641
- Hopkins et al. (2007b) Hopkins P. F., Richards G. T., Hernquist L., 2007b, ApJ, 654, 731
- Hopkins et al. (2006c) Hopkins P. F., Somerville R. S., Hernquist L., Cox T. J., Robertson B., Li Y., 2006c, ApJ, 652, 864
- Hoyle & Lyttleton (1939) Hoyle F., Lyttleton R. A., 1939, in Proceedings of the Cambridge Philisophical Society, vol. 34 of Proceedings of the Cambridge Philisophical Society, 405–+
- Jenkins et al. (2001) Jenkins A., Frenk C. S., White S. D. M., et al., 2001, MNRAS, 321, 372
- Katz et al. (1996) Katz N., Weinberg D. H., Hernquist L., 1996, ApJS, 105, 19
- Kauffmann & Haehnelt (2000) Kauffmann G., Haehnelt M., 2000, MNRAS, 311, 576
- Kawata & Gibson (2005) Kawata D., Gibson B. K., 2005, MNRAS, 358, L16
- King (2003) King A., 2003, ApJ, 596, L27
- Kobayashi et al. (2007) Kobayashi C., Springel V., White S. D. M., 2007, MNRAS, 376, 225
- Körding et al. (2006) Körding E. G., Jester S., Fender R., 2006, MNRAS, 372, 1366
- Kormendy & Richstone (1995) Kormendy J., Richstone D., 1995, ARA&A, 33, 581
- Li et al. (2006) Li Y., Hernquist L., Robertson B., et al., 2006, ArXiv Astrophysics e-prints
- Maccarone et al. (2003) Maccarone T. J., Gallo E., Fender R., 2003, MNRAS, 345, L19
- Magorrian et al. (1998) Magorrian J., Tremaine S., Richstone D., et al., 1998, AJ, 115, 2285
- Marconi & Hunt (2003) Marconi A., Hunt L. K., 2003, ApJ, 589, L21
- Marconi et al. (2004) Marconi A., Risaliti G., Gilli R., Hunt L. K., Maiolino R., Salvati M., 2004, MNRAS, 351, 169
- Martini et al. (2006) Martini P., Kelson D. D., Kim E., Mulchaey J. S., Athey A. A., 2006, ApJ, 644, 116
- McKinney (2006) McKinney J. C., 2006, MNRAS, 368, 1561
- McNamara et al. (2005) McNamara B. R., Nulsen P. E. J., Wise M. W., et al., 2005, Nature, 433, 45
- Merloni (2004) Merloni A., 2004, MNRAS, 353, 1035
- Merloni & Heinz (2006) Merloni A., Heinz S., 2006, ArXiv Astrophysics e-prints
- Merloni et al. (2004) Merloni A., Rudnick G., Di Matteo T., 2004, MNRAS, 354, L37
- Merritt & Ferrarese (2001) Merritt D., Ferrarese L., 2001, MNRAS, 320, L30
- Narayan & Yi (1994) Narayan R., Yi I., 1994, ApJ, 428, L13
- Navarro et al. (1996) Navarro J. F., Frenk C. S., White S. D. M., 1996, ApJ, 462, 563
- Navarro et al. (1997) Navarro J. F., Frenk C. S., White S. D. M., 1997, ApJ, 490, 493
- Okamoto et al. (2007) Okamoto T., Nemmen R. S., Bower R. G., 2007, ArXiv e-prints, 704
- Omma & Binney (2004) Omma H., Binney J., 2004, MNRAS, 350, L13
- Ponman et al. (2003) Ponman T. J., Sanderson A. J. R., Finoguenov A., 2003, MNRAS, 343, 331
- Pounds et al. (2003) Pounds K. A., Reeves J. N., King A. R., Page K. L., O’Brien P. T., Turner M. J. L., 2003, MNRAS, 345, 705
- Pratt & Arnaud (2003) Pratt G. W., Arnaud M., 2003, A&A, 408, 1
- Pratt et al. (2007) Pratt G. W., Böhringer H., Croston J. H., et al., 2007, A&A, 461, 71
- Proga (2003) Proga D., 2003, ApJ, 585, 406
- Quilis et al. (2001) Quilis V., Bower R. G., Balogh M. L., 2001, MNRAS, 328, 1091
- Rauch et al. (1997) Rauch M., Haehnelt M. G., Steinmetz M., 1997, ApJ, 481, 601
- Robertson et al. (2006a) Robertson B., Cox T. J., Hernquist L., et al., 2006a, ApJ, 641, 21
- Robertson et al. (2006b) Robertson B., Hernquist L., Cox T. J., et al., 2006b, ApJ, 641, 90
- Ruderman & Ebeling (2005) Ruderman J. T., Ebeling H., 2005, ApJ, 623, L81
- Ruszkowski & Begelman (2002) Ruszkowski M., Begelman M. C., 2002, ApJ, 581, 223
- Sanderson et al. (2006) Sanderson A. J. R., Ponman T. J., O’Sullivan E., 2006, MNRAS, 372, 1496
- Scannapieco et al. (2005) Scannapieco C., Tissera P. B., White S. D. M., Springel V., 2005, MNRAS, 364, 552
- Schaye et al. (2000) Schaye J., Rauch M., Sargent W. L. W., Kim T.-S., 2000, ApJ, 541, L1
- Scheuer (1974) Scheuer P. A. G., 1974, MNRAS, 166, 513
- Shakura & Sunyaev (1973) Shakura N. I., Sunyaev R. A., 1973, A&A, 24, 337
- Sijacki & Springel (2006) Sijacki D., Springel V., 2006, MNRAS, 366, 397
- Silk & Rees (1998) Silk J., Rees M. J., 1998, A&A, 331, L1
- Soltan (1982) Soltan A., 1982, MNRAS, 200, 115
- Spergel et al. (2007) Spergel D. N., Bean R., Doré O., et al., 2007, ApJS, 170, 377
- Springel (2005) Springel V., 2005, MNRAS, 364, 1105
- Springel et al. (2005a) Springel V., Di Matteo T., Hernquist L., 2005a, ApJ, 620, L79
- Springel et al. (2005b) Springel V., Di Matteo T., Hernquist L., 2005b, MNRAS, 361, 776
- Springel & Hernquist (2002) Springel V., Hernquist L., 2002, MNRAS, 333, 649
- Springel & Hernquist (2003a) Springel V., Hernquist L., 2003a, MNRAS, 339, 289
- Springel & Hernquist (2003b) Springel V., Hernquist L., 2003b, MNRAS, 339, 312
- Springel et al. (2001a) Springel V., White S. D. M., Tormen G., Kauffmann G., 2001a, MNRAS, 328, 726
- Springel et al. (2001b) Springel V., Yoshida N., White S. D. M., 2001b, New Astronomy, 6, 79
- Steffen et al. (2003) Steffen A. T., Barger A. J., Cowie L. L., Mushotzky R. F., Yang Y., 2003, ApJ, 596, L23
- Thacker et al. (2006) Thacker R. J., Scannapieco E., Couchman H. M. P., 2006, ApJ, 653, 86
- Tormen et al. (1997) Tormen G., Bouchet F. R., White S. D. M., 1997, MNRAS, 286, 865
- Tornatore et al. (2004) Tornatore L., Borgani S., Matteucci F., Recchi S., Tozzi P., 2004, MNRAS, 349, L19
- Tremaine et al. (2002) Tremaine S., Gebhardt K., Bender R., et al., 2002, ApJ, 574, 740
- Ueda et al. (2003) Ueda Y., Akiyama M., Ohta K., Miyaji T., 2003, ApJ, 598, 886
- Vikhlinin et al. (2005) Vikhlinin A., Markevitch M., Murray S. S., Jones C., Forman W., Van Speybroeck L., 2005, ApJ, 628, 655
- Volonteri et al. (2003) Volonteri M., Haardt F., Madau P., 2003, ApJ, 582, 559
- von der Linden et al. (2007) von der Linden A., Best P. N., Kauffmann G., White S. D. M., 2007, MNRAS, 578–+
- Yoshida et al. (2001) Yoshida N., Sheth R. K., Diaferio A., 2001, MNRAS, 328, 669
- Yu & Tremaine (2002) Yu Q., Tremaine S., 2002, MNRAS, 335, 965