The light curve of the companion to PSR B1957+20
Abstract
We present a new analysis of the light curve for the secondary star in the eclipsing binary millisecond pulsar system PSR B1957+20. Combining previous data and new data points at minimum from the Hubble Space Telescope, we have 100% coverage in the R-band. We also have a number of new Ks-band data points, which we use to constrain the infrared magnitude of the system. We model this with the Eclipsing Light Curve code (ELC). From the modelling with the ELC code we obtain colour information about the secondary at minimum light in BVRI and K. For our best fit model we are able to constrain the system inclination to 65 2° for pulsar masses ranging from 1.3 – 1.9 M☉. The pulsar mass is unconstrained. We also find that the secondary star is not filling its Roche lobe. The temperature of the un-irradiated side of the companion is in agreement with previous estimates and we find that the observed temperature gradient across the secondary star is physically sustainable.
keywords:
binaries: eclipsing – pulsars: individual (PSR B1957+20) – stars: neutron, low mass1 Introduction
The binary millisecond pulsar (MSP) PSR B1957+20 (Fruchter, Stinebring & Taylor, 1988) is the original and one of the best studied members of its class. It consists of a 1.6 ms radio pulsar orbiting a companion of mass no less than , in a binary of orbital period 9.17 hours. For 10% of this orbit, the radio emission from the pulsar is eclipsed: the eclipsing region is considerably larger than the Roche lobe of the companion star, suggesting a wind of material from the secondary star, due to ablation by the impinging pulsar radiation (Fruchter et al., 1988). The optical counterpart to PSR B1957+20 was discovered by Kulkarni, Djorgovski & Fruchter (1988); subsequent observations by Callanan, van Paradijs & Rengelink (1995) found the optical counterpart to vary by a factor of 30-40 in flux over the course of the orbital period. These observations are hampered by the close proximity of a line of sight “contaminator”, only 0.7 away.
At the time of its discovery it was assumed that PSR B1957+20 was the missing link between low-mass X-ray binaries (LMXBs) and isolated millisecond pulsars. It was suggested that the high energy pulsar radiation could evaporate the companion star (Ruderman et al. 1989a & 1989b) leaving behind an isolated millisecond pulsar like PSR B1937+21 (Backer et al., 1982). However, the means by which such a scenario could occur is still the subject of debate (Eichler & Levinson 1988 & 1991; see also Bhattacharya & van den Heuvel 1991, Phinney & Kulkarni 1994 and Lorimer 2001 for thorough reviews of the formation and evolution of MSPs, binary MSPs and the current status of MSP research respectively).
PSR B1957+20 is a member of a class of binary pulsar systems, the Black Widow Pulsars (e.g. King, Davies & Beer 2003). These are systems with secondaries of mass typically less than 0.05M☉ and orbital period less than 10 hours. To date 15 such systems have been identified111http://www.atnf.csiro.au/research/pulsar/psrcat/expert.html, Manchester et al. (2005), with 13 of these residing in globular clusters and only 2 situated in the field. Radio eclipses have been detected in approximately half of the cluster systems and in both of the field systems. Optical light curves exist for only the field systems, PSR B1957+20 (Callanan et al., 1995) and PSR J2051-0827 (Stappers et al., 1999, 2001).
Previous attempts at modelling the optical light curve of PSR B1957+20 had one major limitation: the companion was undetectable at minimum. As such it was impossible to tightly constrain important system parameters such as the inclination or the degree of Roche lobe filling. However, a number of R & I-band images of the optical counterpart at minimum were subsequently obtained by the Hubble Space Telescope (HST). Furthermore, we have recently acquired a number of Ks-band images of the near infrared counterpart. In this paper we combine these data for the first time to model the light curve to obtain tight constraints on the inclination and Roche lobe filling fraction.
2 Data
2.1 Optical Photometry
The data set consists of B, V and R-band images taken with the William Herschel Telescope (WHT) at La Palma on the nights of 1989 July 2-5 (see Callanan et al. 1995 and references therein for details of the observations), along with two pairs of R (1994 Aug 30, Oct 28) & I-band (1994 Sep 03, Oct 27) data points taken at minimum with the HST.
We re-reduced the WHT data using the IRAF222IRAF is distributed by the National Optical Astronomy Observatories, which are operated by the Association of Universities for Research in Astronomy Inc., under cooperative agreement with the National Science Foundation. implementation of daophot (Stetson, 1987). We undertook this task as, in their original analysis, Callanan et al. (1995) used only approximately half of their data due to poor seeing during 2 of the 4 nights of their observing run. Our re-analysis allows us to use an additional night of data. In the end we had 41 useful R-band data-points covering 85% of the orbit, 39 V-band data points covering 70% of orbital phase and 7 useful B-band points taken near maximum.
Two R-band & 2 I-band data points were also obtained during eclipse with the Wide Field Planetary Camera 2 using the F675W and F814W filters respectively. The exposure time was 600s in each case. These images were corrected for cosmic ray hits and the object magnitudes were calculated using the qphot task in IRAF. The F675W and F814W magnitudes were converted to R and I-band magnitudes in the Johnson system following the prescription given by Holtzman et al. (1995).
2.2 IR photometry
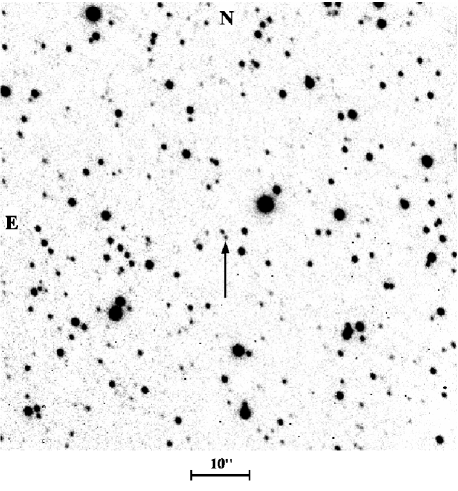
Our observations consist of a series of Ks-band images obtained with the 6.5m Magellan Baade telescope at Las Campanas Observatory on 2004 July 23 and 2005 September 13 using the PANIC camera. These were dark-current subtracted, flat fielded, background subtracted and combined using standard IRAF routines. In total we obtained 4 images totalling approximately 18 minutes on source exposure time. We display one of our Ks-band (1.99 ) images in Fig. 1. The companion star to the pulsar is easily resolved.
Photometry was carried out in the same manner as the WHT optical data. The image was calibrated using the standard star P565-C (Persson et al., 1998) and cross checked by comparing a number of stars in our field with those in the 2MASS catalogue. The data was phased using the ephemeris of Arzoumanian et al. (1994), which at the time of our observations was accurate to at least 1 second. Our final Ks-band photometry is displayed in Table 1.
| Secondary Ks mag | Contaminator Ks mag | |
|---|---|---|
| 0.5 | 17.8 0.1 | 18.06 0.06 |
| 0.764 | 18.20 0.05 | 17.98 0.04 |
| 0.774 | 18.27 0.10 | 18.13 0.08 |
| 0.788 | 18.35 0.06 | 18.02 0.05 |
| 0.824 | 18.73 0.09 | 18.11 0.07 |
Previous attempts at IR photometry of this system were unable to resolve the pulsar from the line of sight contaminator and as such only the K-band magnitude of the unresolved combination was obtained (see Eales et al. 1990). However, our new observations allow us to subtract the magnitude of the contaminator from the combined magnitude of Eales et al. (1990), yielding a Ks-band magnitude of the system at maximum of 17.8 0.1.
3 The ELC Model
To model these data we used the ELC light curve modelling code (Orosz et al., 2000). The ELC code is ideally suited for this type of system as it incorporates the NEXTGEN low temperature model atmosphere tables, which are critical for systems like PSR B1957+20, with a companion of likely temperature 3000 K (Fruchter et al., 1995). The ELC code also allows one to fit light curves on a one by one or simultaneous basis. In our case this allowed the fitting of the BVRI and K-band light curves simultaneously.
3.1 The Model
| Parameter | Value |
|---|---|
| Companion Mass1 | 0.022 M☉ |
| Orbital Period1 | 9.17 hr |
| log Lspindown1 | 35.20 erg s-1 |
| Companion Effective Temp2 | 2800 K |
| Inclination3 | 50 – 80° |
| full |
1 Fruchter et al.1988 ; 2 Fruchter et al. 1995
3 Callanan et al.
1995
The ELC program requires a number of input parameters before modelling the light curve: the initial parameters used are given in Table 2. The temperature dependent gravity darkening exponents of Claret (2000) were used. We initially attempted to model the system as a blackbody (T 2800 K); however, the results were unsatisfactory. While the code had no problem in fitting the observed light curve at maximum, it was completely incapable of reproducing the observed minimum (the model was consistently too luminous during eclipse). We then employed the NEXTGEN model atmospheres of Hauschildt, Allard & Baron (1999a) & Hauschildt et al. (1999b), and using our blackbody model as our starting point, we proceeded to model the light curve. The pulsar mass was set to the canonical value of 1.4 M☉. We then varied the following parameters: inclination and mass ratio of the system, Roche lobe filling fraction (), temperature and bolometric albedo () of the secondary star and the irradiating luminosity. The geneticELC algorithm (based on the PIKAIA routine of Charbonneau 1995) was used to search for the best fit values. The best fit R-band model is displayed in Figure 2. We see that there is excellent agreement between the fit and the data ( = 1.06). The largest deviations occur at orbital phases , but even these are well within the errors. This discrepancy is due to the relative faintness of the companion at these phases, and poorer seeing conditions during these observations. As a check on the validity of the model we used our limited Ks-band data, as displayed in Figure 3. We see that the fit agrees with these data very well.

.

Given that the mass of the pulsar is currently unknown, although most evolutionary scenarios suggest that it will have accreted a few 1/10th of a solar mass from the secondary, we decided to repeat the above procedure for a number of other primary masses in the range 1.3 MMSP 1.9 M☉, to investigate the effect of the pulsar’s mass on our estimates of the mass ratio and orbital inclination of the system.
4 Results
4.1 Inclination
At a given pulsar mass the inclination was constrained to within 1.2°, i.e. for a pulsar of mass 1.4 M☉, i = 64.4 (see Figure 4), and overall for the above range of pulsar masses we find the inclination of the system to be in the range, , at the 3 level.
4.2 Pulsar Mass
The value of exhibited only a nominal increase as the mass of the pulsar was increased from 1.3 – 1.9 M☉: hence our models are unable to constrain this parameter.
4.3 Roche lobe filling factor
At no point in our attempts to model this system were we able to obtain an acceptable fit for a secondary filling its Roche lobe. For our models using the NEXTGEN model atmospheres the value of f was approximately constant, 0.81 f 0.87 (3 level), as we varied the mass of the pulsar between 1.3 and 1.9 M☉. Hence the secondary is tightly constrained as not currently filling its Roche lobe.
4.4 Temperature of the Secondary at maximum and minimum
We obtained a value of T = 2900 110 K (3 level), for the effective temperature of the un-illuminated side of the companion star for pulsar masses in the range 1.3 – 1.9 M☉. For individual pulsar masses the 3 error was 90 K i.e. for a pulsar of mass 1.4 M☉ an effective temperature of T = 2900 90 K was obtained. The corresponding temperature at maximum is T = 8300 200 K (3).
From our modelling, we have obtained the magnitude of the secondary at maximum (in I) and during eclipse (in B, V and K); see Table 3. These provide us with colour information about both the cool side and the irradiated side of the pulsar’s companion.
We find that at least 70% of the spin-down energy of the pulsar is required to produce the observed heating effect and that this percentage is independent of the mass of the pulsar. The bolometric albedo of the system was found to remain close to a value of 0.5 for all our models, which ensured that the secondary was convective.
| B | V | R | I | K | |
|---|---|---|---|---|---|
| Max | 21.08 0.05 | 20.16 0.05 | 19.53 0.05 | 18.79 0.05 | 17.8 0.1 |
| Min | 28.1 0.1 | 26.2 0.1 | 24.6 0.1 | 22.52 0.05 | 19.5 0.1 |
The values in bold are predicted by the ELC models, all other values are measured directly from the photometry.

5 Discussion
We have modelled the light curve of the PSR B1957+20 system with the ELC code and we find the system to be accurately modelled by a highly irradiated secondary. The inclination of the system is measured to be 65 2° for a pulsar in the mass range 1.3 - 1.9 M☉.
The optical/IR lightcurves display no evidence for the presence of a contribution from the intra-binary shock. If such a shock did contribute in a non-negligible manner to the optical/IR flux from the system, we would expect to observe this in the form of an asymmetrical distortion of the lightcurves, which is not observed. In contrast the highly symmetrical nature of the lightcurves is striking evidence that the modulation is the result of the emission from the heated face of the secondary star. Bogdanov et al. (2005) observed variable non-thermal X-ray emission attributed to the intra-binary shock in the binary millisecond pulsar 47 Tuc W333also known as PSR J0024-7204; however, an extrapolation of this emission to optical wavelengths demonstrated that it contributed negligibly here. Recent XMM-Newton observations (Huang et al., 2007) have tentatively detected similar emission in the PSR B1957+20 system, although our observations show it to have an insignificant contribution in the optical, as observed in 47 Tuc W.
5.1 The Roche lobe filling factor
The Roche lobe filling factor is constrained to be greater than 80%, for our best fit model. This result is in agreement with past estimates that required the secondary to be close to filling its Roche lobe (Aldcroft et al. 1992; Applegate et al. 1994; Brookshaw et al. 1995; Callanan et al. 1995). Previous estimates of the mass loss rate in this system (Fruchter & Goss, 1992) required the system to be close to filling its Roche lobe, as the measured density of the eclipsing material was too tenuous to account for significant mass loss. They claimed that if the secondary neared its Roche lobe, material could easily leave the stellar surface and remain in the orbital plane; this would explain the low density of the observed material.
5.2 Temperature and albedo of the secondary star
The effective temperature of the un-illuminated side of the secondary, T = 2900 110 K, is in excellent agreement with the previous estimate of T = 2800 150 K (Fruchter et al., 1995) and is corroborated by its agreement with the R - I colour temperature obtained via the HST ( 3000 K, Cox 2000). The temperature derived from the colour information at maximum is Tmax = 8000 K. This compares with a temperature of 8300 200 K from the ELC models. The error in the colour temperature at maximum is dominated by the large uncertainty in the extinction in the direction of PSR B1957+20.
The bolometric albedo of the secondary, defined as the ratio of the reradiated energy to the irradiance energy (Wilson, 1990), was found to favour the convective case (a 0.5 ) as one would expect for a secondary of such a small size (King et al., 2005). We note here the modelling of the analogous system PSR J2051-0827 (Stappers et al., 2001), in which the percentage of the pulsar’s spin-down luminosity, which is re-radiated in the optical by the secondary, was determined to be in the region of 30% - 45%. This is consistent with the the incident spin-down luminosity that our models require for PSR B1957+20 ( 70%), given the above albedo.
As a check, a number of models were constructed in which the bolometric albedo was set to 1.0 (radiative secondary). In this case, the best fit value of the irradiating luminosity is found to be lower as expected but the associated temperature of the cool side of the secondary is inconsistent with the observed colours.
5.3 Temperature Gradient
It is clear from the light curve of PSR B1957+20 that a large temperature gradient is required between the heated and cool hemispheres of the companion star. To test if this is physically sustainable, we decided to model the heat flow along the surface of the secondary in more detail.
A two-dimensional model of the irradiation of PSR B1957+20 was simulated using a modified version of the code described in Beer & Podsiadlowski (2002) . The code uses a polytropic equation of state and only hydro-dynamical effects were initially considered. The irradiation causes a stress on the stellar surface which drives a sub-sonic circulation. Once this circulation pattern was found thermodynamic effects were considered. Matter in the directly illuminated region was heated and the advection of this matter was followed across the stellar surface. As the matter flowed it was allowed to cool radiatively. The resulting temperature distribution was evolved in time until a steady-state solution was achieved. It was found that the heated material extended beyond the directly irradiated region but that not all of the un-illuminated portion of the star was heated. Consequently a large temperature gradient between the illuminated and un-illuminated sides was found to exist.
It may not be obvious how such a large temperature gradient can exist across the surface of the secondary. In fact the converse has also been argued. If the radiative cooling timescale is short then little or no energy would be redistributed (Dahab, 1974). The reason why a large temperature gradient can exist is because the star is perturbed from hydrostatic equilibrium by the irradiation induced circulation as first noted by Kippenhahn & Thomas (1979). The circulation pattern attempts to distribute the energy due to heating across the surface of the secondary. However, the circulation itself, produces inertia terms in the equations of motion which perturb the star from hydrostatic equilibrium i.e. the pressure gradient is no longer in the same direction as the potential gradient. This in turn is what allows the large temperature gradient to exist across the surface, even of a star as small as the secondary present in this system. This effect is independent of whether the object in question is degenerate or non-degenerate.
5.4 Nature of the secondary
We can use the above colour/temperature information to constrain the nature of the secondary star. The colour information appears to rule out the possibility that the secondary is a white dwarf. In their study of ultracool white dwarfs (T 4000 K) Gates et al. (2004) found that white dwarfs at this low temperature typically have R-I 0.5, whereas we find (R-I)0 = 1.8 0.3. The reddening in the direction of PSR B1957+20 was calculated using the hydrogen column density estimate of Stappers et al. (2003), NH = (1.8 0.7) cm -2, in combination with the extinction curve of Savage et al. (1979). Furthermore, if the secondary in PSR B1957+20 was a 0.025 M☉ white dwarf, one would expect a radius of 0.1 R☉ - again in contrast with the value of 0.3 R☉ which we have determined from our modelling.
According to Bessell (1991) R - I is the most reliable spectral type indicator for late M-type stars and using their diagrams of both spectral type & temperature vs R - I for a sample of late M dwarfs, we find that temperatures of between 2900 - 3100 K and spectral types of M4 - M7 are in agreement with our observed R - I. Hence the secondary appears to exhibit the colours of a late M-type dwarf, although a main sequence companion (M 0.08 M☉) is ruled out on the basis of the mass function combined with our inclination estimate above. It is clear that the current mass of the secondary is well below the hydrogen burning limit of 0.08 M☉. Hence, the most likely current state of the secondary is that of a brown dwarf.
The low mass secondary in this system has been observed to have a temperature of 2900 K and a radius encompassing 80% of its Roche lobe. In contrast a 50 Myr old 0.025 M☉ brown dwarf would be expected to have a temperature of 2200 K and a radius approximately half the size of that observed (Chabrier et al., 2000). Applegate et al. (1994) have previously proposed a model in which the secondary star is heated to this temperature through tidal heating; this model also has the advantage of naturally explaining the orbital period variability observed by Arzoumanian et al. (1994). However, this model requires the secondary star to be close to filling its Roche lobe and given that we observe the secondary to be underfilling its Roche lobe by up to 20%, it is questionable if tidal heating would be an efficient heating mechanism in this scenario.
The accreting millisecond pulsar SAX J1808.4-3658 is also observed to have a bloated, low mass ( 0.05M☉) companion. In this case Bildsten & Chakrabarty (2001) suggest that the secondary star is ’pumped up’ to the bloated higher entropy state by the heating effect of the thermal radiation emitted by the neutron star in quiescence. One could envisage the secondary star in PSR B1957+20 being affected in a similar manner but in this case the heating would be caused by the incident spin-down radiation from the radio pulsar. In reality the situation is likely to be a complicated interplay between both mechanisms which combine to produce the abnormal secondary present in this system.
5.5 Comparison with other MSPs
At this point we should also compare our results with the other ablating field system PSR J2051-0827 (Stappers et al., 1999, 2001), which is remarkably similar to PSR B1957+20. The secondary in this system appears to be similar to that in PSR B1957+20. It has a mass of 0.025 M☉ and the temperature of the cool side has been measured to be 3000 K. This system has also been found to be under-filling its Roche lobe, in this case by 50%. Even though the orbital period of this system is only 2.4 hrs (in comparison to 9.1 hrs for PSR B1957+20), it is clear that a similar ablation mechanism is at work.
Interest in these ablating systems has increased with the discovery of the accretion powered X-ray millisecond pulsars (AXMPs). There is evidence that the pulsar in these systems is in the process of ’turning-on’ as a radio pulsar. In the AXMP SAX J1808.4-3658 (in’t Zand et al., 1998), consisting of a neutron star and a secondary of mass 0.05 M☉ (Bildsten & Chakrabarty, 2001), a similar process could be taking place. Once again the secondary is being heated, but in this case the cool side of the secondary is only 1000 K cooler than the warm side. Campana et al. (2004) have interpreted this as evidence that the companion star is being irradiated by the spin down luminosity of the pulsar. Further observations of quiescent AXMPs are required to test this hypothesis (e.g. Callanan et al. 2007).
6 Conclusions
The main aim of this paper was to constrain the inclination of the
system as a precursor to a campaign of phase resolved spectroscopy,
with the aim of measuring the mass of the pulsar. We have determined
the inclination to within for a pulsar mass in the range
1.3 – 1.9 M☉. This should ensure that any mass determination will
be limited only by the accuracy of the radial velocity measurements.
We have shown that the temperature of the secondary agrees
with previous estimates and the observed temperature gradient is
physically sustainable. We also find the secondary to be under-filling
its Roche lobe by up to 20%.
We thank Jerome Orosz for kindly providing us with the ELC code.
This paper includes data gathered with the 6.5 meter Magellan Telescopes located at Las Campanas Observatory, Chile. This research has utilized 2MASS data products. The Two Micron All Sky Survey is a joint project of the University of Massachusetts and the Infrared Processing and Analysis Centre/California Institute of Technology, funded by NASA and the National Science Foundation. This research made extensive use of the SIMBAD database, operated at CDS, Strasbourg, France and NASA’s Astrophysics Data System.
MTR and PJC acknowledge financial support from Science Foundation Ireland. MAPT was supported in part by NASA LTSA grant NAG5-10889.
References
- Aldcroft et al. (1992) Aldcroft T.L., Romani R.W., Cordes J.M., 1992, ApJ, 400, 638
- Applegate et al. (1994) Applegate J.H., Shaham J., 1994, ApJ, 436, 312
- Arzoumanian et al. (1994) Arzoumanian Z., Fruchter A.S., Taylor J.H., 1994, ApJ, 426, 85
- Backer et al. (1982) Backer D, Kulkarni S, Heiles C, Davies M, Goss W.M., 1982, Nature, 300, 615
- Beer et al. (2002) Beer M.E., Podsiadlowski Ph., 2002, MNRAS, 335, 358
- Bessell (1991) Bessell M.S., 1991, AJ, 101, 662
- Bhattacharya & van den Heuvel (1991) Bhattacharya D., van den Heuvel E.P.J., 1991, Phys. Rep., 203, 1
- Bildsten & Chakrabarty (2001) Bildsten L., Chakrabarty D., 2001, ApJ, 557, 292
- Bogdanov et al. (2005) Bogdanov B., Grindlay J., van den Berg M., 2005, ApJ, 630, 1029
- Brookshaw et al. (1995) Brookshaw L., Tavani M., 1995, in Fruchter A.S., Tavani M. & Backer D.C., eds, Millisecond pulsars. A decade of surprise, ASPConf Ser, San Francisco
- Callanan et al. (1989) Callanan P.J., Charles P.A, van Paradijs J., 1989, MNRAS, 240, 31
- Callanan et al. (1995) Callanan P.J., van Paradijs J., Rengelink R., 1995, ApJ, 439, 928
- Callanan et al. (2007) Callanan P.J., Reynolds M.T., Filippenko A.V., Foley R., Garnavich P.M., 2007, in prep.
- Campana et al. (2004) Campana S., D’Avanzo P., Casares J., Covino S., Israel G., Marconi G., Hynes R., Charles P., Stella L., 2004, ApJ, 614, 49
- Chabrier et al. (2000) Chabrier G., Baraffe I., Allard F., Hauschildt P., 2000, ApJ, 542, 464
- Charbonneau (1995) Charbonneau P., 1995, ApJS, 101, 309
- Claret (2000) Claret A., 2000, A&A, 359, 289
- Cox (2000) Cox A.N., 2000, in Cox A.N., ed., Allen’s Astrophysical Quantities, 4th edn. AIP/Springer-Verlag, New York
- Dahab (1974) Dahab R.E., 1974, ApJ, 187, 351
- Eales et al. (1990) Eales S.A., Becklin E.E., Zuckerman B., McLean I.S., 1990, MNRAS, 242 , 17
- Eichler & Levinson (1988 & 1991) Eichler D., Levinson A., 1988, ApJ, 335, L67
- Fruchter et al. (1988) Fruchter A.S., Stinebring D.R., Taylor J.H., 1988, Nature, 333, 237
- Fruchter & Goss (1992) Fruchter A.S., Goss W.M., 1992, ApJ, 384, L47
- Fruchter et al. (1995) Fruchter A.S., Bookbinder J., Bailyn C.D., 1995, ApJ, 443, 21
- Gates et al. (2004) Gates E., Gyuk G., Harris H.C. et al., 2004, ApJ, 612, 129
- Hauschildt et al. (1999a) Hauschildt, P.H., Allard F., Baron E., 1999, ApJ, 512, 377
- Hauschildt et al. (1999b) Hauschildt P.H., Allard F., Ferguson J., Baron E., Alexander D.R., 1999, ApJ, 525, 871
- Holtzman et al. (1995) Holtzman J.A., Burrows C.J., Casertano S., Hester J.J., Trauger J.T., Watson A.M., Worthey G., 1995, PASP, 107, 1065
- Huang et al. (2007) Huang H.H., Becker W., 2007, A&A, 463, 5
- in’t Zand et al. (1998) in’t Zand J.J.M., Heise J., Muller J.M., Bazzano A., Cocchi M., Natalucci L., Ubertini P., 1998, A&A, 331, 25
- King, Davies & Beer (2003) King A.R., Davies M.B., Beer M.E., 2003, MNRAS, 345, 678
- King et al. (2005) King A.R., Beer M.E., Rolfe D.J., Schenker K., Skipp J.M., 2005, MNRAS, 358, 1501
- Kippenhahn et al. (1979) Kippenhahn R., Thomas H.C., 1979, A&A, 75, 281
- Kulkarni, Djorgovski & Fruchter (1988) Kulkarni S.R., Djorgovski S., Fruchter A.S., 1988, Nature, 334, 504
- Levinson& Eichler (1991) Levinson A., Eichler D., 1991, ApJ, 379, 359
- Leggett (1992) Leggett S.K., 1992, ApJS, 82, 351
- Lorimer (2001) Lorimer D.R., http://www.livingreviews.org/Articles/Volume4/2001-5lorimer/
- Manchester et al. (2005) Manchester R. N., Hobbs G. B., Teoh A., Hobbs, M., 2005, AJ, 129, 1993
- Orosz et al. (2000) Orosz J.A., Hauschildt P.H., 2000, A&A, 364, 265.
- Persson et al. (1998) Persson S.E., Murphy D.C, Krzeminski W., Roth M., Rieke M.J., 1998, AJ, 116, 2475
- Phinney & Kulkarni (1994) Phinney E.S., Kulkarni S.R., 1994, ARA&A, 32, 591
- Ruderman et al. ( 1989) Ruderman M., Shaham J., Tavani M., 1989a, ApJ, 336, 507
- Ruderman et al. (1989) Ruderman M., Shaham J., Tavani M., Eichler D., 1989b, ApJ, 343, 292
- Ryba & Taylor (1991) Ryba M.F., Taylor J.H., 1991, ApJ, 380, 557
- Savage et al. (1979) Savage B.D., Mathis J.S., ARA&A, 17, 73
- Stappers et al. (1999) Stappers B.W., van Kerkwijk M.H., Lane B., Kulkarni S.R., 1999, ApJ, 510, 45L
- Stappers et al. (2001) Stappers B.W., van Kerkwijk M.H., Bell J.F., Kulkarni S.R., 2001, ApJ, 548, 183
- Stappers et al. (2003) Stappers B.W., Gaensler B.M., Kaspi V.M., van der Klis M., Lewin W.H.G., 2003, Sci, 299, 1372
- Stetson (1987) Stetson P, 1987, PASP, 99, 101
- Wilson (1990) Wilson R.E., 1990, ApJ, 356, 613