Observations of Galactic Gamma-Ray Sources with H.E.S.S.
Abstract
H.E.S.S. results from the first three years of nominal operation are presented. Among the many exciting measurements that have been made, most gamma-ray sources are of Galactic origin. I will concentrate here on an overview of Galactic observations and summarise and discuss observations of selected objects of the different source types.
1 Introduction
The High Energy Stereoscopic System (H.E.S.S.) is a system of four imaging atmospheric Cherenkov telescopes which commenced full operation in the Khomas Highland of Namibia in December 2003 [1], at an altitude of 1800 m. The experiment is run by an international collaboration of mostly European institutes. It is built for very-high-energy (VHE) gamma-ray astronomy, exploiting the energy range above 100 GeV up to several tens of TeV. Gamma rays are measured by means of Cherenkov light emitted in air showers of secondary particles that form whenever a primary gamma ray hits the earth’s atmosphere and is being absorbed. Using Cherenkov images of air showers one can deduce the energy and direction of the primary particle.
The H.E.S.S. Cherenkov telescopes are operated in moonless nights yielding a total observation time of roughly 1000 h per year. In normal data taking mode, five to ten objects are tracked per night with a typical cosmic-ray event rate of 300 Hz. The observations proceed in stereoscopic mode: events are recorded if at least two out of the four telescopes have triggered on the same air shower [3]. The telescopes itself have a 60-t steel structure with altitude-azimuth mount. Each has a tessellated mirror surface consisting of 380 single round facets, comprising a total area of [4]. With a focal length of 15 m, the Cherenkov light is imaged onto 960-photo-multiplier cameras with integrated fast readout electronics [5]. Each camera covers a large field of view of . The resulting of the system field-of-view response makes H.E.S.S. the currently best suited experiment in the field for the study of extended VHE gamma-ray sources and the search for unknown sources in surveys.
At zenith, the energy threshold of the system is about 100 GeV and for point sources an energy resolution of 15% is achieved. The angular resolution for individual gamma rays is better than and the point source sensitivity reaches of the flux of the Crab nebula for long exposures ( hours).
2 The H.E.S.S. Survey of the Inner Galaxy
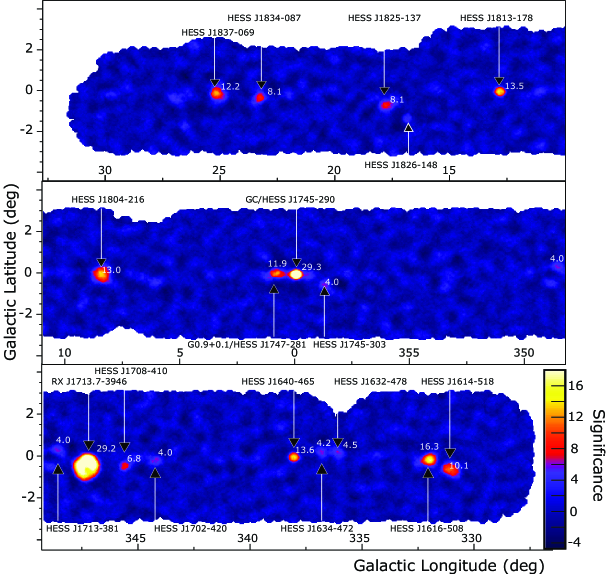
One of the first observation campaigns of H.E.S.S. in 2004 was a survey of the inner part of the Galaxy. Initially a total of 95 live hours were recorded in scan mode, re-observations of promising gamma-ray source candidates yielded another 30 hours of data. Including pointed observations of the Galactic-centre region and the supernova remnant RX J1713.7–3946 (which will both be discussed below), the H.E.S.S. data set accumulates to 230 hours and reaches an average sensitivity of 2% of the Crab flux above 200 GeV. In the region covered ( in Galactic longitude, in latitude) 14 previously unknown sources were detected. Fig. 1 shows a map of the significance of gamma-ray emission of the survey region. 8 of the new sources exceed a significance level of post-trials [6], 6 of them exceed the level of [2]. They all line up with the Galactic plane, except for one all are extended at the 2 to level and reveal hard power-law type energy spectra with a mean photon index of 2.3.
The H.E.S.S. survey is a major breakthrough for the field of gamma-ray astronomy. The increased number of sources allows to consider the behaviour of population of sources, for the first time in this wave band. Using multi-wavelength observations one will now try to understand the physics of the acceleration processes that lead eventually to the emission of VHE gamma radiation. The sources in the survey region might be associated with four source classes:
-
•
Pulsar Wind Nebulae (PWNe): HESS J1825–137,
HESS J1747–281 (G0.9+0.1), HESS J1702–420, and HESS J1616–508. -
•
X-ray binaries: HESS J1826–148 (LS 5039).
-
•
Supernova remnants (SNRs): HESS J1834–087, HESS J1813–178, HESS J1804–216, RX J1713.7–3946, HESS J1713–381, and HESS J1640–465.
-
•
Unknown nature: HESS J1837–069, HESS J1745-290 (Galactic centre), HESS J1745-303, HESS J1708–410, HESS J1634–472, HESS J1632–478, HESS J1614–518.
I will step now sequentially through the source classes and discuss examples of H.E.S.S. measurements.
3 Pulsar Wind Nebulae
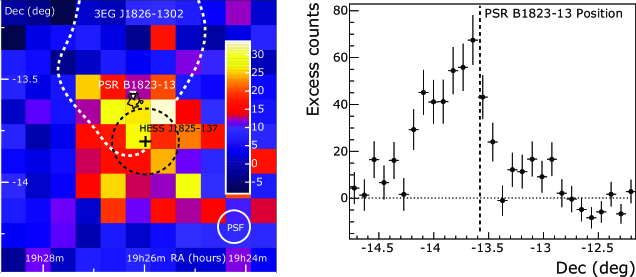
Energetic pulsars dissipate rotational energy in form of relativistic outflows. Confinement of these winds by the ambient medium leads to the formation of PWNe which can emit X-rays via Synchrotron radiation and gamma rays via the Inverse Compton mechanism. One of the four PWN candidates in the H.E.S.S. survey region is HESS J1825–137, shown in Fig. 2 [7]. The source is probably associated with PSR J1826–334, a years old pulsar. As can be seen from the figure, the emission region is offset from the pulsar and extends asymmetrically to the south. The reason for this asymmetric PWN, which is also seen in the X-ray measurement, is the reverse shock from the northern side, where an increased density of the interstellar medium is encountered. The shock presumably crashed into the PWN and pushed it to the south. Note that follow-up observations of this object have been performed with H.E.S.S. and more detailed analyses, including spatially resolved energy spectra, will be published very soon.
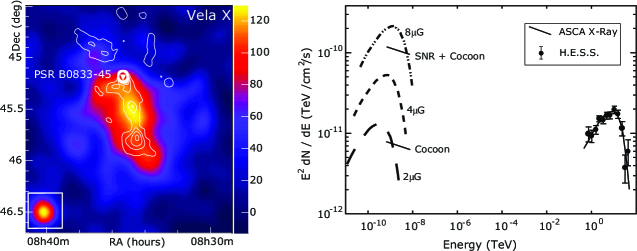
Another example of a PWN measured in VHE gamma rays with H.E.S.S. (which is not in the survey region) is Vela X, the nebula associated with PSR B0833–45. Fig. 3 shows the combined image from the 2004 and 2005 H.E.S.S. data [8]. The gamma-ray emission region is extended, roughly ellipsoidal in shape, and coincides well with ROSAT and Chandra X-ray measurements. Also here, the emission is offset from the pulsar, again due to an asymmetric reverse shock from the northern side. The energy spectrum measured with H.E.S.S. is well explained by a one-zone Inverse Compton model, as is shown in Fig. 3 (right). The measured photon index is very hard, , with an exponential cutoff of . This is actually the first measurement of a complete VHE gamma-ray peak in a spectral energy distribution.
4 X-ray Binaries
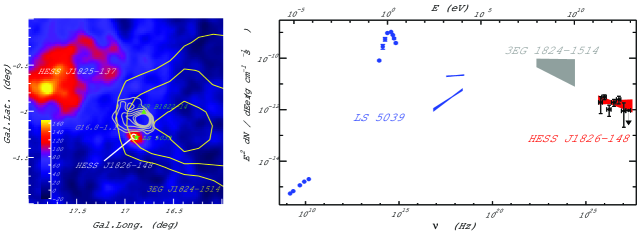
A point-like gamma-ray source was found close to HESS J1825–137 in the H.E.S.S. survey, HESS J1826–148, likely to be associated with a system called LS 5039. This system is an X-ray binary, a companion star orbiting around a compact object. Radio and X-ray observations of relativistic outflows of some X-ray binaries have led to the term Microquasar, suggesting that they behave as scaled-down active galactic nuclei. The H.E.S.S. measurement is shown in Fig. 4 [9]. It is noteworthy that this is the only point-like source in the whole survey region. The positional coincidence with LS 5039 led to the identification of the gamma-ray source with the microquasar, and it is the first detection of such an object in VHE gamma rays. The spectrum of HESS J1826–148 is shown in Fig. 4 (right), it follows a power law and suggests an association with the EGRET source 3EG 1824–1514, despite a spatial separation of . More H.E.S.S. data from follow-up observations in 2005 exist and allow to search for orbital modulations. Detailed results will be published soon.
5 Supernova Remnants
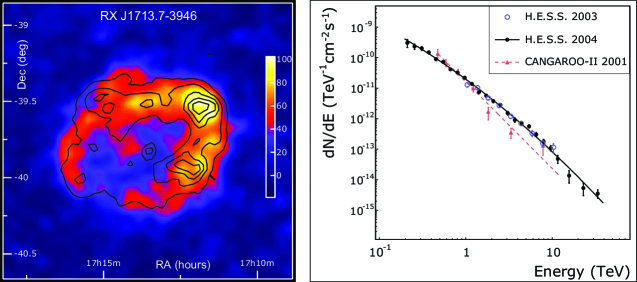
SNRs are the best source candidates for cosmic rays in our Galaxy. The standard notion of particle acceleration is the diffusive shock acceleration of charged particles in the shells of SNRs. The source with the largest extension in the survey region is such a shell-type SNR, RX J1713.7–3946. It has an apparent diameter of , twice the size of the full moon. The remnant was discovered with ROSAT in X-rays [13], follow-up observations with ASCA revealed a dominantly non-thermal X-ray continuum without line emission [14, 15], most plausibly explained by Synchrotron emission of multi-TeV electrons. The presumed acceleration of electrons to TeV energies in the expanding shell of RX J1713.7–3946, together with indications of interactions of the shock with molecular clouds [16], made this SNR a prime target for H.E.S.S. to look for gamma rays from interactions of accelerated cosmic rays with ambient matter.
After the first detection of VHE gamma rays from this object with CANGAROO [17, 18], H.E.S.S. has indeed confirmed gamma-ray emission with its 2003 observation campaign. It revealed the first ever resolved image of an astronomical source in VHE gamma rays [12]. Follow-up observations allowed for detailed analyses with unprecedented precision [11], the resulting gamma-ray image is shown in Fig. 5 [10]. It shows a clear shell structure, brighter in the northwest, resembling very much the picture seen in X-rays. In fact a detailed correlation study revealed a striking correspondence between keV and TeV energies. The differential energy spectrum of the whole remnant is shown in Fig. 5 (right). It extends over more than two decades well beyond 10 TeV and is well described by power-law type spectral shapes, albeit with deviations from a pure power law at large energies. The spectrum reported by the CANGAROO-II collaboration, also shown in the figure, is in marginal agreement with the H.E.S.S. measurement.
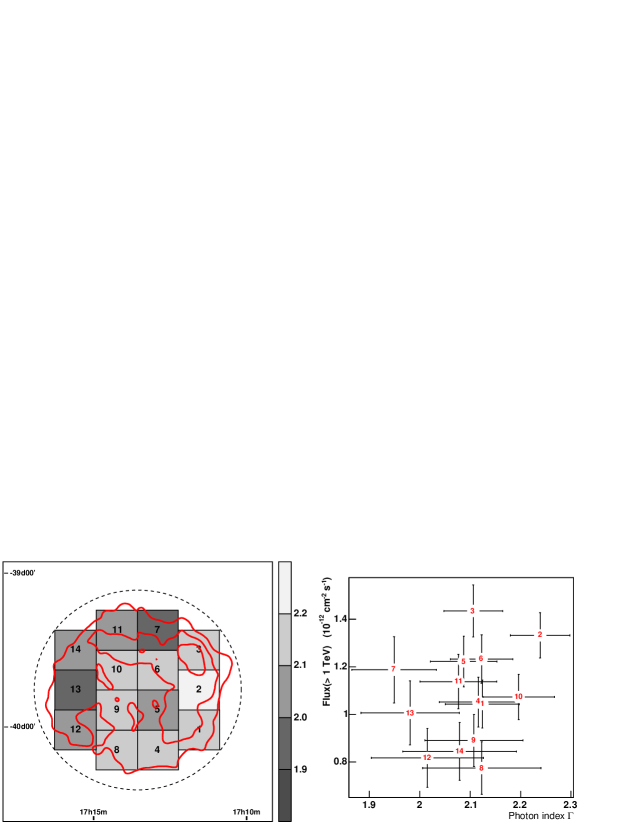
The H.E.S.S. 2004 data of RX J1713.7–3946 enabled us to perform a spatially resolved spectral analysis, to look for spectral variation on scales down to . The result is shown in Fig. 6. When determining spectra in 14 boxes arranged to cover the whole SNR, no significant index variation is found, the spectral shape is the same everywhere, only the flux varies by more than a factor of two.
The key issue from the interpretation side for the RX J1713.7–3946 data is the identification of the particle population responsible for gamma-ray emission. While with the H.E.S.S. measurement it is clear that primary particles are accelerated in the shock wave to energies beyond 100 TeV, it remains difficult to say whether these particles are electrons or protons, in other words, if we really have the proof at hands that this SNR is a source of nucleonic cosmic rays. A broadband approach to answer this question is shown in Fig.7. A one-zone electron model fails to reproduce the spectral shape measured with H.E.S.S., in a hadronic scenario on the other hand the spectral shape seen in gamma rays is
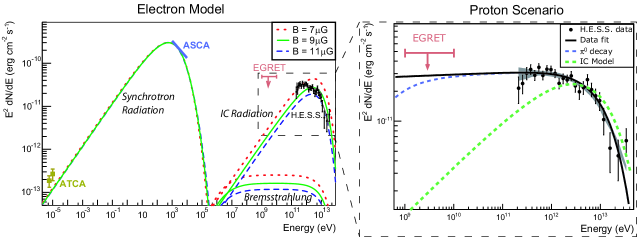
qualitatively as expected from theory. In that sense the hadronic scenario is favoured by the H.E.S.S. data, although the correlation between X-rays and gamma rays is then challenging and so far not well understood.
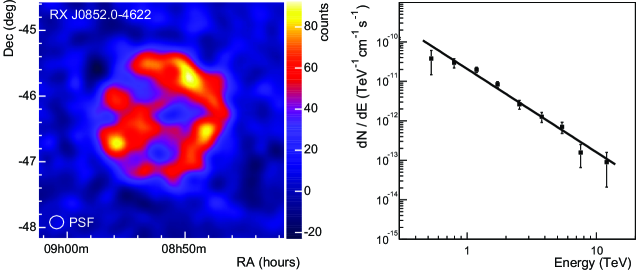
Another prominent SNR that was detected with H.E.S.S. in 2004 is RX J0852.0–4622 [20], sometimes called Vela Junior (it is close to the PWN Vela X, discussed above). Also first discovered with ROSAT [21], this object is in many regards similar to RX J1713.7–3946. It is largely extended with a diameter of almost and reveals a shell structure, correlated in X-rays and gamma rays. The H.E.S.S. image is shown in Fig. 8. It demonstrates once more impressively the ability of H.E.S.S. to map extended objects in gamma rays. The spectrum of the whole SNR is shown in Fig. 8 (right). It extends beyond 10 TeV and is within statistics well described by a pure power law with a photon index of . Note that detailed analysis of more data from 2005 is underway and in the pipeline for publication.
6 Sources of Unknown Nature – The H.E.S.S. Galactic Centre Signal
Among all the H.E.S.S. sources in the survey region that so far could not be unequivocally identified the Galactic centre is probably the most exciting one. The point-like VHE gamma-ray emission is coincident with the supermassive black hole and the SNR Sgr A East [23]. The spectrum is well described by a pure power law with photon index . No sign for any time variability of the signal is found. Possible emission processes that have been discussed include electron and proton origin of gamma rays, produced in the vicinity of the black hole or the shocks of the SNR. Moreover, the H.E.S.S. signal has been discussed in the framework of dark matter annihilations [24].
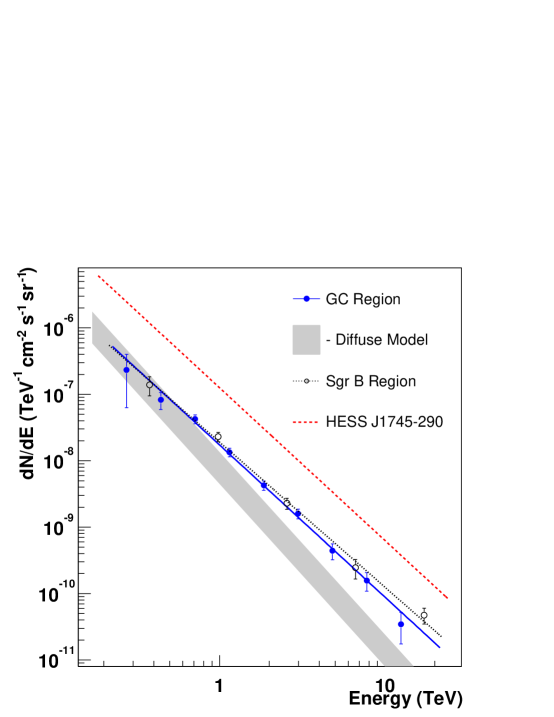
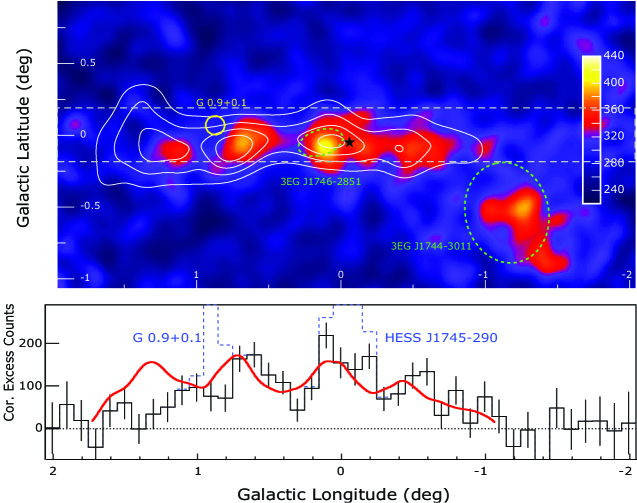
The deep exposure of 2004 revealed not only a second source of VHE gamma rays, G0.9+0.1, but also enabled us to subtract these two strong point sources and search for remaining diffuse emission. The result is shown in the upper panel of Fig. 9 which shows the residual gamma-ray excess after subtraction. Two significant features appear: a region of extended emission spatially coincident with the unidentified EGRET source 3EG J1744–3011, and emission extending along the Galactic plane for roughly [22]. Overlaid in the figure are velocity-integrated CS data from the Galactic centre direction which trace molecular gas. There is a close correlation visible between the gamma-ray signal and the molecular gas density. In the lower panel of Fig. 9 the gamma-ray count rate is shown as a profile, plotted versus Galactic longitude, integrated in a thick slice. The good match between gamma-ray and CS data suggests a cosmic-ray origin of gamma rays, produced in interactions of cosmic rays with molecular clouds. The similarity in the distributions of CS-line and gamma-ray emission implies a rather uniform cosmic-ray density in this region. Fig. 10 shows the gamma-ray flux measured in this region. The data is well described by a power law with photon index . Keeping in mind that in case of a power-law energy dependence, the gamma-ray spectral index closely traces the cosmic-ray index itself, it follows that the measured spectrum is significantly harder than in the solar neighbourhood. If we estimate the gamma-ray flux assuming a target mass as determined from the CS measurement, and the local cosmic-ray flux and spectrum, we obtain the shaded grey band shown in Fig. 10. There is a clear excess measured beyond 500 GeV. This could simply be due to the proximity to the accelerator, meaning that propagation effects, which lead to a steepening of the spectrum, are less pronounced.
7 Summary and Conclusions
During its first three years of operation H.E.S.S. has had a number of significant achievements in the field of VHE gamma-ray astronomy. Only with the sensitivity, the good angular and energy resolution and the large field of view of experiments like H.E.S.S. is it now possible to measure the morphology and spectra of extended gamma-ray sources with great precision. Moreover, the good off-axis sensitivity make H.E.S.S. ideally suited for sky surveys. This was demonstrated here by means of the Galactic plane survey data, which revealed 14 previously unknown VHE gamma-ray sources. The detection of extended emission from SNRs such as RX J1713.7–3946, which resembles indeed as expected a shell structure, proves the existence of highest energy particles in the shocks of SNRs and presents a major step forward towards solving the puzzle of the origin of Galactic cosmic rays. Finally, the detection of a diffuse VHE gamma-ray component from the direction to the Galactic centre provides new vistas of the centre of our Galaxy delivering exciting insights into acceleration and diffusion processes of cosmic rays.
References
- [1] Hinton, J. A., 2004, New Astronomy Review 48, 331.
- [2] Aharonian et al. (H.E.S.S. Collaboration), 2006, The Astrophysical Journal 636, 777.
- [3] Funk et al., 2004, Astroparticle Physics 22, 285.
- [4] Bernlohr et al., 2003, Astroparticle Physics 20, 111.
- [5] Vincent et al. (H.E.S.S. Collaboration), 2003, Proc. 28th ICRC (Tsukuba), 2887.
- [6] Aharonian et al. (H.E.S.S. Collaboration), 2005, Science 307, 1938.
- [7] Aharonian et al. (H.E.S.S. Collaboration), 2005, Astronomy and Astrophysics 442, L25
- [8] Aharonian et al. (H.E.S.S. Collaboration), 2006, Astronomy and Astrophysics 448, L43
- [9] Aharonian et al. (H.E.S.S. Collaboration), 2005, Science 309, 746.
- [10] Aharonian et al. (H.E.S.S. Collaboration), 2006, Astronomy and Astrophysics in preparation.
- [11] Aharonian et al. (H.E.S.S. Collaboration), 2005, Astronomy and Astrophysics 449, 223.
- [12] Aharonian et al. (H.E.S.S. Collaboration), 2004, Nature 432, 75.
- [13] Pfeffermann, E. & Aschenbach, B., 1996, in Roentgenstrahlung from the Universe, 267.
- [14] Koyama et al., 1997, Publications of the Astronomical Society of Japan 49, L7.
- [15] Slane et al., 1997, The Astrophysical Journal 525, 357.
- [16] Fukui et al., 2003, Publications of the Astronomical Society of Japan 55, L61.
- [17] Muraishi et al., 2000, Astronomy and Astrophysics 354, L57.
- [18] Enomoto et al., 2002, Nature 416, 823.
- [19] Komin et al. (H.E.S.S. Collaboration), 2005, Proc. 29th ICRC (Pune).
- [20] Aharonian et al. (H.E.S.S. Collaboration), 2005, Astronomy and Astrophysics 437, L7.
- [21] Aschenbach, B., 1998, Nature 396, 141.
- [22] Aharonian et al. (H.E.S.S. Collaboration), 2006, Nature 439, 695.
- [23] Aharonian et al. (H.E.S.S. Collaboration), 2004, Astronomy and Astrophysics 425, L13.
- [24] Aharonian et al. (H.E.S.S. Collaboration), 2006, Physical Review Letters in preparation.