Also at ]Epigenetics Laboratory, Centre for Addiction and Mental Health, Toronto Ontario M5T 1R8, Canada
Network Topology of an Experimental Futures Exchange
Abstract
Many systems of different nature exhibit scale free behaviors. Economic systems with power law distribution in the wealth is one of the examples. To better understand the working behind the complexity, we undertook an empirical study measuring the interactions between market participants. A Web server was setup to administer the exchange of futures contracts whose liquidation prices were coupled to event outcomes. After free registration, participants started trading to compete for the money prizes upon maturity of the futures contracts at the end of the experiment. The evolving ‘cash’ flow network was reconstructed from the transactions between players. We show that the network topology is hierarchical, disassortative and scale-free with a power law exponent of 1.020.09 in the degree distribution. The small-world property emerged early in the experiment while the number of participants was still small. We also show power law distributions of the net incomes and inter-transaction time intervals. Big winners and losers are associated with high degree, high betweenness centrality, low clustering coefficient and low degree-correlation. We identify communities in the network as groups of the like-minded. The distribution of the community sizes is shown to be power-law distributed with an exponent of 1.190.16.
pacs:
89.65.Gh, 89.75.Da, 89.75.FbI Introduction
Many complex systems exhibit distributions of observables that are not characterized by a single scale. Examples include net wealth, earthquake magnitudes and gene expression Ueda et al. (2004). Heterogeneity in system constituents and/or in the interactions among them might underlie the complexity. Continuing advances in information technology have facilitated acquisition and analysis of sheer amounts of data, unraveling the interacting networks of different kinds ranging from the transportation network of airlines in technology Guimera et al. (2005), collaboration networks of scientists in sociology Newman (2001) and binding networks of proteins in biology Uetz et al. (2000). Network topologies evolve to fulfill system requirements. Studies of networked systems thus help better understand complex systems. Among the encouraging examples are the jamlessness of scale-free communication networks Toroczkai and Bassler (2004), short separation of small-world acquaintance networks Watts and Strogatz (1998) and robustness against random mutations of scale-free biological networks Albert et al. (2000). Further applications of network analysis involve demarcation between social and nonsocial networks by an attribute that measures the correlation between the degrees of interacting nodes Newman and Park (2003). The finding of hierarchical structures in metabolic networks also has implications for functional categorization of metabolites Ravasz et al. (2002).
Financial markets, consisting of such heterogeneous agents as investors, hedgers and arbitragers, show stylized distributions of returns and wealth Mandelbrot (1963); Bouchaud and Potters (1997). Intrigued by the universal behavior, physicists have applied the methodologies of nonequilibrium statistical mechanics to elucidating the mechanisms underlying the complexity Mantegna and Stanley (2000). Examples include critical phenomenon Stanley et al. (2002) and self-organized criticality Scheinkman and Woodford (1994) modeling of economic systems.
In line with the network approach to technological, social and biological complex systems, we designed an experimental market, recording every transaction between pairs of participants during the experiment. Transactions (edges) hold information on the flow of assets from sellers to buyers (nodes). Characterization of the evolving topology of the resulting network helps shed light on the emergence of complexity in financial markets. The unique feature of our experiment is that no parallel can be easily undertaken in the real market. We describe the experimental settings and market rules in Sec. II, followed by characterization of the network by mean shortest path lengths and degree and wealth distributions of Sec. III. Further analysis in Sec. IV unravels subtle network structures including hierarchy, dissortativity and community. We argue that an integrated model of financial markets should accommodate the results of our empirical study.
II Experiment
A 24-hour exchange market was established on the Web, accepting bid and ask orders from registered players via the Internet Wang et al. (2004, 2006, ). Upon registration, which was anonymous and free, an account with 30,000 units of fictitious money was allocated to the player on the exchange server. The futures contracts that our market issued were tied to the candidates running for the Taipei mayoral election which took place on December 9, 2006111Contract specifications and trading rules were announced at http:// socioecono .phys .sinica .edu.tw/ exchange/ announce. The liquidation price of each futures contract was determined by the percentage of votes the candidate received on the election day. Such an experiment was run continuously for 30 days, ending on the election day. After the experiment, any contracts in the players’ accounts were liquidated using the official counts released by the government. Money prizes were awarded to the top ten winners determined by the accumulated wealth in the players’ accounts. In a previous publication Wang et al. , we demonstrated that such a market, which drew typically 400 participants, exhibited power-law distributions of price changes, net wealth and inter-transaction times that are characteristic of real world markets. Furthermore, predictions of the market have so far been consistent with election outcomes. In this paper, we examine the evolving network of ‘cash’ flow recorded along the experiment.
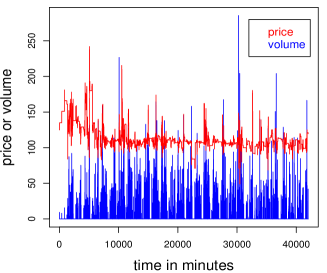
Five candidates ran for Taipei mayor. We included a sixth futures contract to account for invalid ballots. The sum of the six prices should be 100 if the players were rational or the market was efficient. Figure 1 plots this price and volume time series throughout the experiment. The intermittence of price spikes may be attributable to a multiplicative process with additive noise which is known to yield power law distributions in the fluctuations Takayasu et al. (1997); Sornette (1998). From the number of time points where the trading volumes are nonzero, we determine that the market was active 12.7% of the time. We advertised the experiment by constant posts to the electronic bulletin boards of the colleges throughout Taiwan during the experiment. The number of registrants increased roughly monotonically with time, topping at 628 in the end of the experiment. Trading orders submitted by players were stored in the orderbooks on the server with the continuous double auction mechanism for order matching and price finding. The number of successful transactions in the experiment totaled 8,563. Information on each of the transactions, including price, volume, contract, buyer, seller and time, was recorded.
III Results and Analysis
III.1 Small World Cash Flow Networks
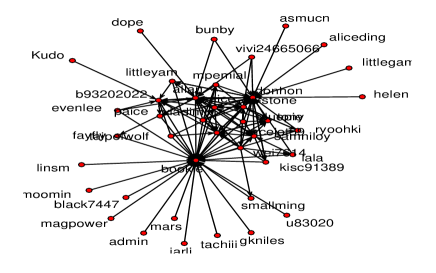
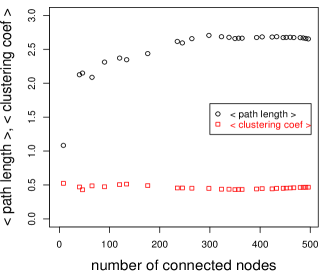
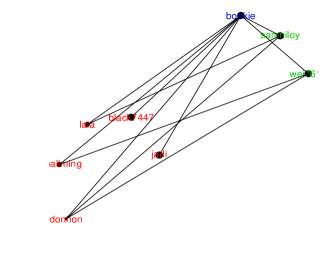
When the bid order of player was matched with the ask order of player at a price and specified volume of a futures contract, an amount of cash flew from player to . Every day, the server output the cumulative cash flow between any pair of players, from which we reconstructed 30 networks of cash flow, one for each day. On average, 232% of the nodes in the networks were isolated, corresponding to those who registered but had never traded with others. Figure 2 shows the network on day 3. The day 1 network consists only of three isolated nodes. The day 2 network has 11 nodes with 8 connected shown in Fig 10. We exclude the isolated nodes in the following analysis. The average number of (undirected) edges per node in the network increased with day to about 6 within the first 10 days and saturated at around 8 in the final days. Inspection of the networks such as Fig. 2 by eyes identifies hubs which usually confer the small world property. To confirm the property, we calculate the characteristic path length of a network which is the average of the smallest numbers of edges between pairs of nodes. The slow increase of the characteristic path length with network size in Fig. 3, together with the high clustering coefficients (also shown in Fig. 3 but to be elaborated later), demonstrates the small-worldness of the cash flow networks. The emergence of the small world property at early onset of the experiment suggests a low quorum for such a market to function efficiently in terms of opinion exchange.
III.2 Degree Distribution
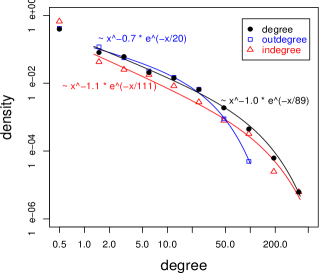
The degree distribution of a network gives the probability of a randomly chosen node to have edges. A power-law decay of with indicates excessive presence of hubs in the network. To get the density distribution, we employ bin sizes that are even in the logarithmic scale, with a binsize ratio of 2. Figure 4 shows the distributions of in-degrees, out-degrees and undirected degrees of the cash flow network in the end of the experiment. We found that the degree distributions are well described by a power-law with exponential cut-off,
| (1) |
The exponents for the in-, out- and undirected degree are found to be , and , respectively. The power laws in Fig. 4 show that the cash flow network from our experiment is scale free. Note however that the small values of the exponents are in contrast to those of other real world networks found typically in the range . Hubs play a pivotal role in opinion/information collection and dissemination. If consensus is to be reached independent of the network size, we would expect a wide range of node degrees (corresponding to small ’s) Sood and Redner (2005). As we found that, despite transient spikes, the prices of individual contracts were stationary as new players joined throughout the experiment222Time-series plots of the individual contract prices are available at http:// socioecono .phys .sinica .edu.tw / exchange/ D/ TWMayors 06/ tw_taipei06-p.jpg, this property may explain the small exponents. The exponential cut-off could be due to such finite size effects as the limited time frame and trade activity of the experiment.
III.3 Weighted Networks and Wealth Distribution
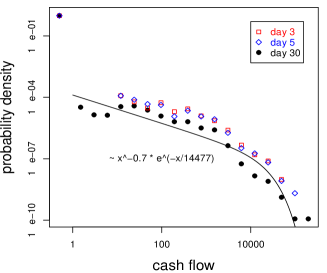
Flow of cash between players accumulated as time went on. We assign the cumulative flow of cash to the edge. The networks are therefore weighted. The frequency distributions of the weights in Fig. 5 show that the weights are power-law distributed with an exponent of 0.690.11. Furthermore, the power-law weights behavior emerged in early stages of the experiment as seen from the distributions accumulated up to days 3 and 5 in Fig. 5.
We sum the weights on the directed edges pointing to (leaving from) a node to obtain the income (spending) of the node. The incomes (and spending) of the nodes having the same degree are then averaged. A plot of the averaged income versus degree is interesting in that it tells if high in-degree players tend to have high incomes. We found that the income and spending increase with the in- and out-degree in a power law fashion,
| (2) |
The relations indicate that those who managed to get more buyers (sellers) cashed in (spent) more. We found no simple functional form relating the in- and out-degrees of the 496 active players up to the last day of the experiment because of the divergence in the scatter plot. However the nonparametric Spearman’s rank correlation coefficient between the and is as high as 0.73. The correlation indicates that those who cashed in more tended to spent more. The same conclusion is reached if we symmetrize the cash flow matrix. That is we replace = and = with ==A+B where = means an amount of had flown from player to player since the experiment began. A+B is then the traded amount between the two players. Using the symmetrized, weighted cash flow matrix, we found a power law similar to Eq. (2): traded where is undirected degree.
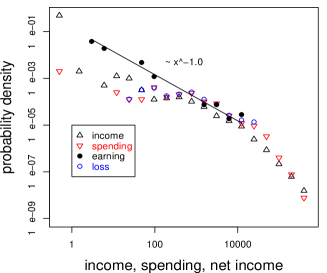
To get the distribution of net incomes, we subtract the spending from the income of each player. The probability densities in Fig. 6 show power law behavior of the incomes, spending, earnings (positive net incomes) and losses (negative net incomes), reminiscent of the Pareto distribution. The exponent of the earnings is 0.990.04.

IV Discussion
We have reconstructed the evolving network of ‘cash’ flow between the players who participated in the trading experiment to compete for real money prizes. We showed that the cash flow network was scale free with small world properties that emerged very early in the experiment. The distributions of the weights (incomes and spending) are also power-law decaying.
IV.1 Hierarchical Structure
To further characterize the cash flow network, we calculate the clustering coefficient of a player which measures the propensity that her trading partners had traded with one another. We use symmetrized adjacency and cash flow matrices in the calculation of the weighted clustering coefficient Barrat et al. (2004) which takes into account the frequency or amount of trades between the players,
| (3) |
where
| (4) |
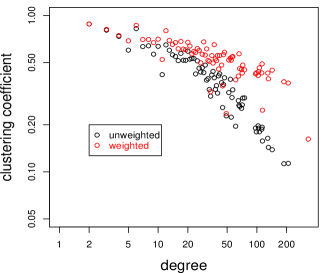
The clustering coefficients of the players having the same degrees are averaged to get . The results in Fig. 7 show a power law decay of the average clustering coefficients with increasing degree, suggesting a hierarchical architecture in the cash flow network Ravasz and Barabasi (2003). We also calculated the average clustering coefficient for each of the 30 networks and found that the values stay rather constant independent of the network size (cf Fig. 3), the averages being 0.460.02 and 0.520.03 for the unweighted (Fig. 3) and weighted versions of the coefficient.
IV.2 Disassortative Mixing, Betweenness and Rank
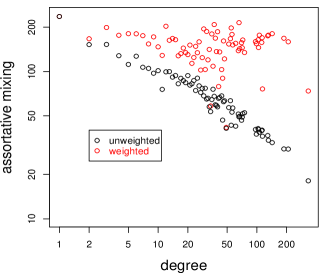
We also calculate the assortative mixing which measures the similarity between player and her trading partners in terms of their degrees Barrat et al. (2004),
| (5) |
An analysis parallel to Fig. 7 shows a decaying degree-correlation with increasing degree, indicating that the cash flow network is disassortative. The dissortativity may reflect the competitive nature of the market although the dissortativity becomes insignificant considering the weights on the edges (Fig. 8).
Another quantity in network analysis is the betweenness centrality of node defined as the number of shortest paths between two other nodes passing through weighted by the inverse of the number of redundancies Freeman (1977). We found the mean betweenness centrality is related to degree by .
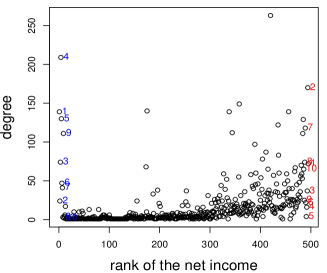
Most of the properties of the node, such as clustering coefficient and betweenness centrality, can be referred to its degree. We rank the players according to their net incomes and plot the degree against rank in Fig. 9. The plot shows that high degree players reaped either victory or debacle. The high degree players tend to have low clustering coefficients as in Fig. 7. A low clustering coefficient translates that, instead of trading within a clique of partners, the player keeps searching for new investment opportunities across cliques over the network. Whether she wins or loses would then depend on her adaptability to changing opinions.
IV.3 Power-law Distribution of Community Sizes
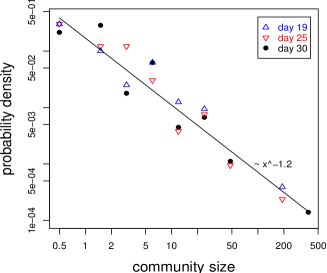
In the context of our experiment, when the price of a futures contract was considered too high (low), a sell (buy) order was placed. An edge between two nodes in the cash flow network therefore indicates that the two players disagreed to the pricing of the futures contract. In other words, players with no edges linking them were those who thought alike. An algorithm to find communities in the players is thus to partition the cash flow network so that the density of edges within communities are lower and that between communities are higher than average. An example of such a division of the network is shown in Fig. 10 where it is clear that the within-community edges are minimized while the between-community edges are maximized. We applied the eigenvector-based partitioning algorithm of Newman (2006) to the 30 networks and found that the number of communities grew logarithmically with the number of active players as . Furthermore, the distribution of community sizes, shown in Fig. 11, is found power-law distributed with an exponent of . Figure 11 shows three distributions from three cash flow networks on day 19, 25 and 30. The day 19 and 25 networks have, respectively, 20 and 33 communities, corresponding to two maximal deviations ( and ) from the above best fit prediction. The distributions in the plot demonstrate that they are power-law distributed. Moreover, the largest communities encompass 61% of the players.
IV.4 Distribution of Inter-transaction Time Intervals
We find the time intervals between successive transactions from the ticks in the volume time-series in Fig. 1. The distribution of the inter-transaction times shown in Fig. 12 exhibits a truncated power law distribution with exponent 1.280.17, consistent with our previous finding Wang et al. . This power law behavior, together with that in the early-day cash flows of Fig. 5, may suggest a contribution of human factors Barabasi (2005) to the origins of power laws.
In summary, in an effort to study financial markets through network approach, we performed an online experiment in the form of tournament. We recorded the flow of fictitious cash between the 496 registered, active participants throughout the 30-day course of the experiment. The topology of the resulting cash flow networks is found nonrandom with a power-law distribution in the connectivity. The heterogeneity in the connectivity as well as weights emerged early in the experiment. The distribution of net incomes in the end of the experiment is also power-law distributed. Network analysis indicates that the cash flow network is hierarchical and disassortative. Communities in the network are defined and identified. The distribution of community sizes is power-law distributed, so is the distribution of inter-transaction time intervals. Our experimental platform offers a unique chance of anatomizing such complex systems as financial markets. A better understanding of the complexity calls for models that account for the major findings in the present study.
Acknowledgements.
The research was supported in part by the National Science Council of Taiwan (NSC #95-2112-M-001-010 and NSC #95-2415-H-004-002-MY3).References
- Ueda et al. (2004) H. R. Ueda, S. Hayashi, S. Matsuyama, T. Yomo, S. Hashimoto, S. A. Kay, J. B. Hogenesch, and M. Iino, Proc. Natl. Acad. Sci. U.S.A. 101, 3765 (2004).
- Guimera et al. (2005) R. Guimera, S. Mossa, A. Turtschi, and L. A. N. Amaral, Proc. Natl. Acad. Sci. U.S.A. 102, 7794 (2005).
- Newman (2001) M. E. J. Newman, Proc. Natl. Acad. Sci. U.S.A. 98, 404 (2001).
- Uetz et al. (2000) P. Uetz, L. Giot, G. Cagney, T. A. Mansfield, R. S. Judson, J. R. Knight, D. Lockshon, V. Narayan, M. Srinivasan, P. Pochart, et al., Nature 403, 623 (2000).
- Toroczkai and Bassler (2004) Z. Toroczkai and K. E. Bassler, Nature 428, 716 (2004).
- Watts and Strogatz (1998) D. J. Watts and S. H. Strogatz, Nature 393, 440 (1998).
- Albert et al. (2000) R. Albert, H. Jeong, and A.-L. Barabasi, Nature 406, 378 (2000).
- Newman and Park (2003) M. E. J. Newman and J. Park, Phys. Rev. E 68, 036122 (2003).
- Ravasz et al. (2002) E. Ravasz, A. L. Somera, D. A. Mongru, Z. N. Oltvai, and A.-L. Barabasi, Science 297, 1551 (2002).
- Mandelbrot (1963) B. B. Mandelbrot, J. Business 36, 394 (1963).
- Bouchaud and Potters (1997) J. P. Bouchaud and M. Potters, Theorie des Risques Financieres, Alea-Saclay/Eyrolles, Paris (1997).
- Mantegna and Stanley (2000) R. N. Mantegna and H. E. Stanley, An Introduction to Econophysics: Correlations and Complexity in Finance, Cambridge University Press, Cambridge (2000).
- Stanley et al. (2002) H. E. Stanley, L. A. N. Amaral, S. V. Buldyrev, P. Gopikrishnan, V. Plerou, and M. A. Salinger, Proc. Natl. Acad. Sci. U.S.A. 99, 2561 (2002).
- Scheinkman and Woodford (1994) J. A. Scheinkman and M. Woodford, American Economic Review 84, 417 (1994).
- Wang et al. (2004) S. C. Wang, C. Y. Yu, K. P. Liu, and S. P. Li, Proc. IEEE/WIC/ACM International Conference on Web Intelligence (WI’04), IEEE Computer Society, Washington DC p. 173 (2004).
- Wang et al. (2006) S. C. Wang, J. J. Tseng, S. P. Li, and S. H. Chen, New Mathematics and Natural Computation 2, 271 (2006).
- (17) S. C. Wang, S. P. Li, C. C. Tai, and S. H. Chen, eprint physics/0503176, to appear in Quantitative Finance.
- Takayasu et al. (1997) H. Takayasu, A.-H. Sato, and M. Takayasu, Phys. Rev. Lett. 79, 966 (1997).
- Sornette (1998) D. Sornette, Phys. Rev. E 57, 4811 (1998).
- Sood and Redner (2005) V. Sood and S. Redner, Phys. Rev. Lett. 94, 178701 (2005).
- Barrat et al. (2004) A. Barrat, M. Barthelemy, R. Pastor-Satorras, and A. Vespignani, Proc. Natl. Acad. Sci. U.S.A. 101, 3747 (2004).
- Ravasz and Barabasi (2003) E. Ravasz and A.-L. Barabasi, Phys. Rev. E 67, 026112 (2003).
- Freeman (1977) L. C. Freeman, Sociometry 40, 35 (1977).
- Newman (2006) M. E. J. Newman, Phys. Rev. E 74, 036104 (2006).
- Barabasi (2005) A.-L. Barabasi, Nature 435, 207 (2005).