Comments on the radio spectrum of HB 3–References
Comments on the radio spectrum of HB 3
Abstract
It has recently been suggested that the radio spectrum of the Galactic supernova remnant HB 3 shows flattening at higher frequencies (above about 1 GHz). Here I review the radio spectrum of HB 3, noting the difficulties in deriving accurate flux densities for this remnant, particularly at high frequencies, due to the proximity of bright, thermal emission from W3 and its surroundings. A flux density for HB 3 at 2695 MHz is derived from Effelsberg survey data. The spectrum of HB 3 is well represented by a simple power-law spectrum from 22 to 2695 MHz, with a spectral index of . It is concluded that contamination with thermal emission from adjacent regions is the cause for the reported spectral flattening of HB 3.
keywords:
supernova remnants – ISM: individual: HB 3 – radio continuum: ISM1 Introduction
Recently Urošević et al. (2007) have proposed – based largely on the results compiled by Tian & Leahy (2005) – that the radio spectrum of the supernova remnant (SNR) HB 3 (G132.7+1.3) between 22 and 3900 MHz is curved, showing a flatter spectrum at higher frequencies. Urošević et al. suggest that the reported flattening is due to a thin shell of thermal emission enclosing HB 3, which contributes per cent of the total flux density at 1.4 GHz. Any thin shell contributing such a large fraction of the flux from the remnant should be apparent from available observations – especially those at 1.4 GHz shown in Tian & Leahy – but no such shell is seen. High frequency flattening of the radio spectra of SNRs has been suggested previously, in the case of Tycho’s and Kepler’s SNRs, by Reynolds & Ellison (1992). In these cases it was proposed that the spectral flattening was an intrinsic curvature resulting from the shock acceleration theory, rather than being due to thermal emission. However, there are several problems with some of the flux densities of HB 3 used by Tian & Leahy, particularly that the highest two frequency observations included (at 3650 and 3900 MHz) have much poorer angular resolutions than stated, and they are likely to be contaminated with thermal emission from the nearby bright H ii region W3. Here I review the flux densities available for HB 3, derive a new flux density for it at 2695 MHz from Effelsberg 100-m survey observations (Fürst et al., 1990), and present a revised radio spectrum for this SNR.
2 Background
2.1 Published flux densities for HB 3
Urošević et al. (2007) cite Tian & Leahy (2005) for the flux densities they use to produce a radio spectrum of HB 3, although they also include a flux density at 22 MHz, which is not listed by Tian & Leahy. This 22-MHz flux density is, apparently, Jy, from Landecker et al. (1987, a private communication from R. S. Roger, integrated from the image presented in ). There are, however, problems with several of the flux densities used by Tian & Leahy, and hence by Urošević et al.. First, Tian & Leahy give the flux density of HB 3 at 38 MHz as Jy, citing Caswell (1967). However, the published flux density is actually Jy. Second, Tian & Leahy use flux densities at 408 and 1420 MHz that they derive from Canadian Galactic Plane Survey (CGPS) images (Taylor et al., 2003), after the removal of the compact (extragalactic) sources. However, these flux densities are compared with other flux densities from the literature which have not had the compact sources removed. Therefore, to compare with the other flux densities, it would be better to use the somewhat higher flux densities at 408 and 1420 MHz that include the compact sources (i.e. 73.9 Jy instead of 68.6 Jy at 408 MHz, and 47.2 Jy instead of 44.8 Jy at 1420 MHz). Tian & Leahy (2005)’s results contain other errors – see the errata published in Tian & Leahy (2006) – namely the wrong resolution for the Effelsberg 2695-MHz survey observations (Fürst et al., 1990), and incorrectly calculated errors in the spectral index for HB 3 derived from their 408- and 1420-MHz integrated flux densities. These errors also apply to the results for OA 184 – which is no longer thought to be a SNR, see Foster et al. (2006) – and for the SNR VRO 42.05.01 (G166.04.3), published in Leahy & Tian (2005). Another problem, which is difficult to quantify, is the fact that the flux densities reported in the literature may not necessarily be on the same flux density scale. Most recent observations, at the higher frequencies, are likely to be on the scale of Baars et al. (1977). However, this scale does not provide secondary calibrator flux densities at frequencies below 400 MHz, and there is evidence that the secular change in spectral index used by Baars et al. for the absolute calibrator Cas A is incorrect – see, for example, Rees (1990) – which is relatively more of a problem for the low frequency flux densities available for HB 3 in the literature. However, the main problem with making a direct comparison of the published flux densities of HB 3 is due to the fact that this SNR is close to the bright thermal complex W3/4/5, which is discussed in more detail below.
2.2 The extent of HB 3
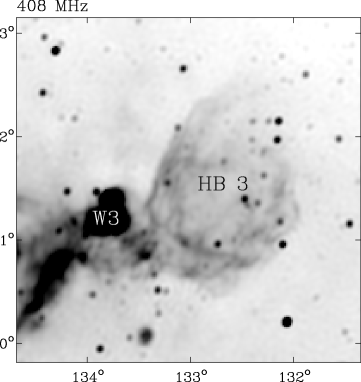
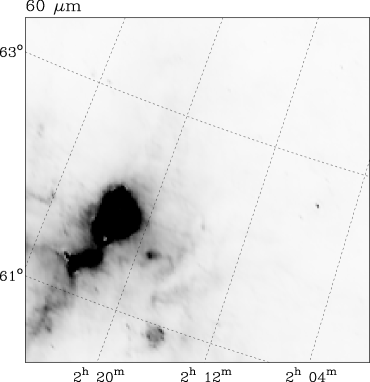
Deriving accurate flux densities for HB 3 is difficult because it is adjacent to the H ii regions W3/4/5 (e.g. Dickel 1980; Roelfsema & Goss 1991; Normandeau et al. 1997). W3 (IC 1795) is a very bright H ii region – near , , to the east of HB 3. Fig. 1 shows images of HB 3 and its vicinity at both a frequency of 408 MHz and a wavelength of 60 m. The 408-MHz image is from the CGPS, and is the same data as used by Tian & Leahy. This image shows the extent of the remnant better than do higher radio frequency observations (see Fig. 2 below). The 60-m image is from IRAS observations, reprocessed for comparison with CGPS radio observations (see Cao et al. 1997), and shows the extent of thermal emission in the region. The resolution varies across the 60-m image, but is typically arcmin2 (PA ). The confusion of HB 3 with W3 is particularly an issue for lower resolution observations, where separating out the remnant from W3 is difficult, and more so at higher frequencies when the non-thermal emission from the remnant is relatively fainter (see Fig. 2 below).
Indeed, the difficulty of defining the extent of HB 3 in the presence of the nearby thermal emission has been noted by various authors. Landecker et al. (1987) comment that there is “no definite boundary separating it [HB 3] from W3”, and that “There is a plateau of emission to the south and west of W3”, which they go on to show is probably mostly thermal. Reich et al. (2003) present observations of HB 3 at 865 MHz, with a resolution of arcmin2, together with observations of many other SNRs at this frequency. In the case of HB 3 they note that it is difficult to obtain an accurate integrated flux density for the remnant due to the complex surroundings of the remnant111Although they themselves give a relatively accurate flux density for HB 3 at 865 MHz., and go on to say “This limitation holds not only for the present observations, but also for most of the previously published images with larger beam sizes.” This difficulty of separating out the emission from HB 3 from the thermal emission associated with W3 is particularly a problem at higher frequencies. The reported spectral flattening of HB 3 depends almost solely on high frequency observations of Trushkin et al. (1987). However, Tian & Leahy erroneously give the resolution of the 3650- and 3900-MHz observations of Trushkin et al. as arcmin2 at each frequency. In fact the resolution of these observations is considerably larger: arcmin2 at 3650 MHz and arcmin2 at 3900 MHz (. Given that the RATAN-600 telescope used for these observations makes scans at fixed declinations, the large north–south extent of the beam means that contamination with thermal emission for the eastern part of the remnant – i.e. from the plateau region south and west of W3, as described by Landecker et al. – seems unavoidable.
Trushkin et al. also present observations of HB 3 at 960 MHz, which have a large beam size, of arcmin2. Unsurprisingly, contamination with nearby thermal emission is a serious problem with the 960-MHz flux density for HB 3 from these observations. The reported flux density of Jy is high by a factor of about 1.45 compared with what might be expected given other available flux densities at lower and higher frequencies (cf. Fig. 3 below). Moreover, it is not clear that the observations of Trushkin et al. were made with a sufficient number of scans to properly sample the emission from HB 3 in declination. The contamination of the 960-MHz flux density from Trushkin et al. was noted by Tian & Leahy, who did not use this flux density for their spectrum. They also noted that the 3650- and 3900-MHz observations may be contaminated with thermal emission. Rather than discard the 3650- and 3900-MHz flux densities – as they did with the 960-MHz flux density value – Tian & Leahy used the published flux densities, but increased their errors to 30 per cent. Since any thermal contamination is a systematic increase in the flux density, it is inappropriate to simply increase the (random) errors of these flux densities.
Discarding the RATAN-600 observations, the highest available frequency with a measured flux density is 2695 MHz, from the Effelsberg survey (Fürst et al.). Given the potential problems of contamination with nearby thermal emission, it is important to define the extent of the remnant well. From Fig. 1 it is clear that it is not easy to separate the emission from HB 3 from the emission from W3 and its surroundings – particularly to the south and west of W3 – as has been noted by previous authors. Indeed, Trushkin et al. themselves note that their baselevels are less reliable in the eastern part of the remnant. They give separate flux densities for the whole remnant, from to (B1950), and for the western part alone, to only. From their observations they report a steeper spectrum for the western part of the remnant than for the remnant as a whole, which is consistent with thermal contamination from W3 and its surroundings in the east. Thus, the flux densities reported by Trushkin et al. for HB 3 as a whole do indeed appear to be significantly contaminated by thermal emission in the east. Note, from the IRAS image shown in Fig. 1, that there is emission to the south and west of W3. This is presumably thermal emission near , , which is west of .

3 A 2695-MHz flux density for HB 3
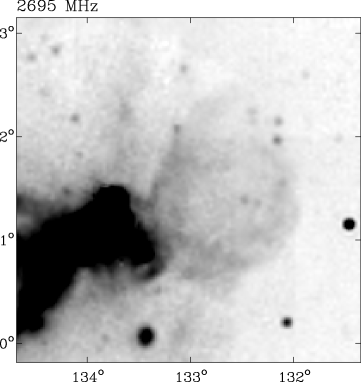
Given the problems with the RATAN-600 data – and the misquoted resolution given by Tian & Leahy for the Effelsberg 2695-MHz survey data – I have derived an integrated flux density for HB 3 from this survey. HB 3 and its surroundings at 2695 MHz are shown in Fig. 2, with different greyscales, to show both the bright emission from W3, and the much fainter emission from HB 3. To derive an integrated flux density for HB 3, the extent of the remnant was defined from the CGPS 408-MHz image (Fig. 1), by drawing a polygon around the SNR, as is reproduced in Fig. 2. It should be recognised, however, that the dividing line between the remnant and the thermal emission in the south and west of W3 is subjective. In order to derive a flux density for the emission within the polygon, a twisted plane was first fitted to the pixels lying around the edges of the polygon, omitting the line that divides the remnant from the extended emission in the south and west of W3. This twisted plane was then removed from the image before integrating the emission within the polygon. The integrated flux density of HB 3 at 2695 MHz, inside the polygon shown on Fig. 2, is 31 Jy. The integrated flux density varies by about 1 Jy (i.e. about 3 per cent) if slightly different polygons are chosen, with similar dividing lines between HB 3 and W3. However, to be cautious, and to reflect any uncertainties in the overall flux density scale of the Effelsberg 2695-MHz survey data, I will assume an overall uncertainty of 15 per cent, giving a 2695-MHz flux density of Jy for HB 3. This value is slightly lower than other flux densities available at this frequency, but not significantly so (cf. the value of Jy derived by Tian & Leahy from the same survey data, and the value of Jy from Velusamy & Kundu 1975).
If the dividing line between HB 3 and W3 – i.e. the dashed line shown on Fig. 2 – is changed to include the emission south and west of W3 that is east of , the derived integrated flux density increases considerably, to about 40 Jy. This implies that the 3650- and 3900-MHz flux densities reported by Trushkin et al. are indeed likely to be too high, as discussed in Section 2.2.
| published | flux | scaled | ||||||
|---|---|---|---|---|---|---|---|---|
| beamsize | flux density | scaling | flux density | reference | ||||
| / MHz | / arcmin2 | / Jy | factor | / Jy | ||||
| × | ± | ± | notes (a) and (b) | |||||
| × | ± | ± | Caswell (1967), note (a) | |||||
| × | ± | Kovalenko et al. (1994) | ||||||
| × | ± | Kovalenko et al. (1994) | ||||||
| × | ± | Kovalenko et al. (1994) | ||||||
| × | ± | ± | Caswell (1967), note (a) | |||||
| × | ± | note (c) | ||||||
| × | ± | Tian & Leahy (2005); note (d) | ||||||
| × | ± | note (e) | ||||||
| × | ± | Reich et al. (2003); note (f) | ||||||
| × | ± | Tian & Leahy (2005); note (d) | ||||||
| × | ± | this paper | ||||||
Notes: (a) the published flux density has been rescaled to be on the scale of Baars et al. (1977); (b) private communication from R. S. Roger to Landecker et al. (1987); (c) from MSci thesis of J. Zhu (1993), reported in Tian & Leahy (2005); (d) including compact sources; (e) private communication from H. Wendker to Landecker et al. (1987); (f) the error has been increased to a nominal 15 per cent.

4 Discussion and Conclusions
Table 1 gives integrated flux densities for HB 3. These are as listed by Tian & Leahy, but with the following revisions: (i) a 22-MHz flux density, from a private communication from R. S. Roger to Landecker et al. (1987); (ii) the 38-MHz flux density has been corrected to the published value (see Section 2.1); (iii) at 408 and 1420 MHz, the values for the flux density of HB 3 from Tian & Leahy before removal of the compact sources are preferred (again see Section 2.1); (iv) the relatively small uncertainty at 865 MHz quoted by Reich et al. (2003) has been increased to a nominal 15 per cent, with the other uncertainties as quoted in the literature, which are taken to be errors; (v) the 2695-MHz flux density derived in Section 3 is preferred to other flux densities available at similar frequencies; (vi) the 3650- and 3900-MHz observations from Trushkin et al. are omitted due to their likely contamination with thermal emission (see discussion in Sections 2.2 and 3); (v) the older flux densities have been scaled to place them in the scale of Baars et al.222The 22-MHz flux density is, presumably, on the scale used by Roger et al. (1986), which is based on an assumed flux density of 29,100 Jy for Cygnus A. This is 5 per cent below the value given by the absolute spectrum for Cygnus A from Baars et al. The 38-MHz flux density reported by Caswell is from the survey data of Williams et al. (1967), which is on the scale of Conway et al. (1963), as is the 178-MHz flux density. The correction factors given by Baars et al. for the CKL scale have been used for the 38- and 178-MHz flux densities., although – as noted in Section 2.1 – there are problems with this scale at low frequencies. The flux density scales used for the 232- and 610-MHz values are not clear, but these are likely to be on the scale of Baars et al. Note also that all the available flux densities at 178 MHz or below have been made with poor resolution, so that obtaining flux densities from these observations is difficult, because of confusion with nearby thermal emission – see Section 2.2 above, although this is likely to be less of a problem than at gigahertz frequencies – or, at 22 and 38 MHz, because the thermal emission is absorbed (see Caswell 1967; Roger 1969). HB 3 and its surroundings are also imaged at 151-MHz in part of the 6C survey (Hales et al., 1993), with a resolution of arcmin, and by Vessey & Green (1998), with a resolution of arcmin. However, neither of these surveys image extended sources well, so have not been used to determine a flux density for HB 3.
Figure 3 shows the radio spectrum from the flux densities given in Table 1, with the least squares single power law fit to the observations. These results show that a single power law fits the data well, with no obvious flattening of the radio spectrum of HB 3 at high frequencies. Since the best fit straight line goes through all the error bars, this suggests that some of the errors have been overestimated. The least squares fit gives a spectral index – here defined in the sense that flux density scales with frequency as – of . From the discussion above, the flattening reported by Tian & Leahy (2005), and used by Urošević et al. (2007), seems to be due to contamination of the higher frequency RATAN-600 flux densities by thermal emission associated with W3, not thermal emission associated with the remnant.
It is generally difficult to derive accurate radio spectra for most Galactic SNRs, due to the potential confusion with other Galactic sources, and also variations in the Galactic background. Ideally, reasonable resolution observations are needed over a wide range of frequencies, but in practice – as seen here in the case of HB 3 – these are generally not available at low frequencies (below a few hundred megahertz), nor at high frequencies (above a few gigahertz).
Acknowledgements
The research presented in this paper has used data from the Canadian Galactic Plane Survey, a Canadian project with international partners, supported by the Natural Sciences and Engineering Research Council. I am also grateful to all those who have been involved with writing the DRAO ‘export software’ package, particularly the madr and plot programs, which have been used for this work. I thank Stanislav Shabala for his translation from the Russian of the paper by Trushkin et al., and the referee for useful comments on the earlier version of this paper.
References
- Baars et al. (1977) Baars J. W. M., Genzel R., Pauliny-Toth I. I. K. & Witzel, A., 1977, A&A, 61, 99.
- Cao et al. (1997) Cao Y., Terebey S., Prince T. A. & Beichman C. A., 1997, ApJS, 111, 387.
- Caswell (1967) Caswell J. L., 1967, MNRAS, 136, 11.
- Conway et al. (1963) Conway, R. G., Kellermann, K. I. & Long, R. J., 1963, MNRAS, 125, 261.
- Dickel (1980) Dickel H. R., 1980, ApJ, 238, 829.
- Foster et al. (2006) Foster T., Kothes R., Sun X. H., Reich W. & Han J. L., 2006, A&A, 454, 517.
- Fürst et al. (1990) Fürst E., Reich W., Reich P. & Reif K., 1990, A&AS, 85, 691.
- Hales et al. (1993) Hales, S. E. G., Masson, C. R., Warner, P. J., Baldwin, J. E. & Green, D. A., 1993, MNRAS, 262, 1057.
- Kovalenko et al. (1994) Kovalenko A. V., Pynzar’ A. V. & Udal’tsov V. A., 1994, Astronomy Reports, 38, 95.
- Landecker et al. (1987) Landecker T. L., Dewdney P. E., Vaneldik J. F. & Routledge D., 1987, AJ, 94, 111.
- Leahy & Tian (2005) Leahy D. & Tian W., 2005, A&A, 440, 929.
- Normandeau et al. (1997) Normandeau M., Taylor A. R. & Dewdney P. E., 1997, ApJS, 108, 279.
- Rees (1990) Rees N., 1990, MNRAS, 243, 637.
- Reich et al. (2003) Reich W., Zhang X. & Fürst E., 2003, A&A, 408, 961.
- Reynolds & Ellison (1992) Reynolds S. P. & Ellison D. C., 1992, ApJ, 399, L75.
- Roger (1969) Roger R. S., 1969, ApJ, 155, 831.
- Roger et al. (1986) Roger, R. S., Costain, C. H. & Stewart, D. I., 1986, A&ASS, 65, 485.
- Roelfsema & Goss (1991) Roelfsema P. R. & Goss W. M., 1991, A&AS, 87, 177.
- Taylor et al. (2003) Taylor A. R., Gibson S. J., Peracaula M., Martin P. G., Landecker T. L., Brunt C. M., Dewdney P. E., Dougherty S. M., Gray A. D., Higgs L. A., Kerton C. R., Knee L. B. G., Kothes R., Purton C. R., Uyanıker B., Wallace B. J., Willis A. G. & Durand D., 2003, AJ, 125, 3145.
- Tian & Leahy (2005) Tian W. W. & Leahy D., 2005, A&A, 436, 187.
- Tian & Leahy (2006) Tian W. W. & Leahy D. A., 2006, A&A, 451, 991.
- Trushkin et al. (1987) Trushkin S. A., Vitkovskij V. V. & Nizhelskij N. A., 1987, Astrofizicheskie Issledovaniia Izvestiya Spetsial’noj Astrofizicheskoj Observatorii, 25, 84.
- Urošević et al. (2007) Urošević D., Pannuti T. G. & Leahy D., 2007, ApJ, 655, L41.
- Velusamy & Kundu (1975) Velusamy T. & Kundu M. R., 1974, A&A, 32, 375.
- Vessey & Green (1998) Vessey, S. J. & Green, D. A., 1998, MNRAS, 294, 607.
- Williams et al. (1967) Williams, P. J. S., Kenderdine, S. & Baldwin, J. E., 1967, MemRAS, 70, 53.