Methods for determining AGB mass loss rates based on radio data
Abstract
In the radio regime the mass-loss rate of AGB stars is best probed using molecular (and atomic) line emission arising in the CSE formed by the stellar wind. The numerical modelling of the circumstellar emission where intricate interplays between physical and chemical processes take place, is a challenge. The derived mass-loss rates depend crucially on the assumptions in the circumstellar model, of which some can be constrained if enough observational data exist. Therefore, a reliable mass-loss-rate determination for an individual star requires, in addition to a detailed radiative transfer analysis, good observational constraints in the form of multi-line observations and radial brightness distributions. Of the methods used to estimate mass-loss rates from galactic AGB stars those based on radiative transfer modelling of CO line emission are most commonly used and possibly also the most accurate. Typically, CO multi-transitional observations can constrain the mass-loss rate to better than 50%, within the adopted circumstellar model. Comparison with complementary methods, such as estimates based on dust radiative transfer modelling coupled with a dynamical model, are consistent within a factor of three.
Stockholm Observatory, AlbaNova University Center, SE-10691, Sweden
1. Introduction
Mass loss is the single most important process during the final evolution of low- and intermediate-mass stars on the asymptotic giant branch (AGB). Its existence and overall characteristics, e.g., magnitude, geometry and kinematics, are well established. However, much of its finer details, e.g., degree of asymmetry, non-homogeneity, and temporal variation are essentially unknown. This is unfortunate since even a modest mass-loss-rate change by a factor of two will have a profound effect on the evolution of the star, its nucleosynthesis, and its return to the interstellar medium. The mass loss creates a circumstellar envelope (CSE) of gas and dust around the star. The low temperature of the central star allows the formation of a wide variety of molecular species in its atmosphere, and the expanding gas is therefore mainly in molecular form. The chemistry in the CSE itself can be very rich and it depends on the C/O-ratio, the thickness of the envelope, and the strength of the ambient ultraviolet radiation field.
Presented here is a short overview of various methods for estimating mass-loss rates based on observations in the radio regime. Special attention will be given to CO line observations which has been considered, when supplemented by detailed radiative transfer modelling, as a very (perhaps the most) reliable AGB mass-loss-rate estimator. Uncertainties involved in the modelling procedure will be discussed.
2. Probing the mass-loss rate
The discussion in this section will be limited to the more commonly used methods in deriving mass loss rates for AGB stars based on observations of spectral line emission in the radio regime. Although, radio continuum observations could in principle be used to drive dust mass-loss rates, and through the use of a dynamical model the gas mass-loss rates, they are mainly only included as part of more extensive multi-wavelength SED modelling which is usually better constrained from observations in the infra-red (and optical) part of the spectrum. In Sect. 4.2 a comparison between gas mass-loss rates derived from CO line emission and dust continuum emission is provided.
2.1. HI 21 cm line emission
Hydrogen is the most abundant element in the material expelled from an AGB star. Molecular hydrogen (H2) is difficult to observe since it has no allowed electric dipole rotational transitions and its (weaker) quadrupolar transitions lie in a spectral range in the infra-red that is not accessible from the ground. The atomic hydrogen (HI) line at 21 cm could potentially be a useful probe of the gaseous envelopes around AGB stars. HI is also hard to ionize which would trace the CSE to large spatial scales. However, chemical models predict the gas in the wind to be atomic only when the central star has an effective temperature higher than about 2500 K (e.g. Glassgold & Huggins 1983). HI can also be produced from photodissociation of H2 by the interstellar radiation field at large radial distances from the star (Gussie et al. 1995). There are some observational difficulties in that the emission is inherently weak and that HI emission from the interstellar medium provides an intense background from which the circumstellar contribution needs to be separated.
Mass-loss rates based on HI 21 cm line observations are still very uncertain. This is partly because the HI abundance distribution may be complicated but there is also evidence that the AGB wind interacts with the ISM at large radial scales. Current HI mass-loss rate estimates show a correlation with those obtained from other methods, such as CO line observations, but the discrepancy for an individual source can be as large as an order of magnitude (Le Bertre & Gérard 2004; Gérard & Le Bertre 2006).
2.2. CO line observations
CO is usually the most abundant circumstellar molecule after H2 and multi-transition CO line observations, when supplemented by a detailed excitation analysis, are commonly regarded as one of the most accurate methods for determining mass-loss rates on the AGB. The CO molecule is relatively easy to excite even in low temperature low density regions and, like H2, self-shileds against the interstellar uv-radiation field which combines to make it an excellent probe of the circumstellar medium.
Several surveys of the mass-loss properties of AGB stars have been performed using CO line emission (e.g., Loup et al. 1993; Bieging & Latter 1994; Kahane & Jura 1994; Groenewegen et al. 1999; Hiriart & Kwan 2000; Schöier & Olofsson 2001; Olofsson et al. 2002; Ramstedt et al. 2006; Teyssier et al. 2006). It is found that the derived mass-loss-rate distribution has a median value of 2 10-7 M⊙ yr-1 with no obvious dependence on the photospheric C/O-ratio (see Fig. 1a). The mass-loss rates correlate well with the expansion velocity of the CSEs (Fig. 1b) and there are some indication that carbon stars generally have larger expansion velocities than S-stars and M-type AGB stars (Fig. 1c). The observed and derived properties of AGB CSEs and their correlation with stellar properties such as, e.g., luminosity and effective temperature lend support to the common concensus that these stellar winds are driven by radiation pressure on dust grains and that pulsation may play an important role (Schöier & Olofsson 2001; Bergeat & Chevallier 2005).
Single-dish observations in the radio regime generally do not spatially resolve the CSEs around AGB stars. The first systematic survey of AGB molecular envelopes at high spatial resolution was performed by Neri et al. (1998) using CO 1 0 line emission using the Plateu de Bure interferometer. They concluded that the CSEs generally have an overall spherical symmetry and expand isotropically at near constant expansion velocity. These results have further stimulated the continued use and development of the ”standard model” described in Sect. 3.
2.3. Maser emission
Together with CO observations, maser line emission from molecules such as OH and H2O (and to a lesser extent SiO) has commonly been used to derive mass-loss rates for AGB stars. This procedure is biased toward AGB stars in which the photospheric C/O-ratio is 1 which allows for the formation of high abundances of H2O and its photodissociation product OH. The excitation conditions requires the maser emission to emanate from a region relatively close to the central star allowing for detailed studies of the inner part of the CSE where the mass-loss is initiated and the wind accelerated. Maser lines are usually very bright and can be used to study AGB stars at larger (extragalactic) distances (e.g., van Loon et al. 2001).
Mass-loss rate estimates based on maser emission are inherently more uncertain than those obtained from CO measurements. Detailed radiative transfer modelling indicates that the maser strengths are very sensitive to changes not only in the chemistry, density, temperature, and velocity structures of the gas but also in the exact composition of the dust particles present in the wind (e.g., Goldreich & Scoville 1976; Babkovskaia & Poutanen 2006).
3. The standard model
The numerical modelling of CSEs, where intricate interplays between physical and chemical processes take place, is a challenge. This applies, in particular, to the important inner regions of the CSEs, where very currently few observational constraints are available and our knowledge is very limited. Atomic and molecular line emission in the radio regime predominately probe the outer envelope regions where many of these complexities can be neglected and a fairly simple, yet reasonably realistic, CSE can be assumed. Here a brief summary of the assumptions used in the ”standard model” often adopted when estimating mass-loss rates from CO line observations in the radio regime. As an example a best fit model for the high mass-loss rate carbon star LP And is shown in Fig. 2. In Sect. 4 some of the uncertainties involved in this modelling procedure will be discussed.
3.1. Basic assumptions
The most commonly adopted starting point for detailed modelling is to assume the CSEs to be spherically symmetric, to be produced by a constant mass-loss rate, and to expand at a constant velocity. The density structure, , (as a function of distance, , from the central star) can then be derived from the conservation of mass
| (1) |
where is the hydrogen gas mass loss rate and is the gas expansion velocity taken from the observed line profiles. It is further assumed that the hydrogen is in molecular form in the region probed by the CO emission (Glassgold & Huggins 1983). In the CO excitation analysis a CO/H2 abundance ratio needs to be adopted. Typically the assumed ratio is in the range 2 10-4 1 10-3 with M-type AGB stars in the lower end and carbon stars in the upper end (e.g., Cherchneff 2006).
The CO molecules are generally not excited according to local thermodynamic equilibrium (LTE) in the regions of the envelope which contribute significantly to the observed emission. The common approach is instead to assume that statistical equilibrium is prevailing. The excitation analysis then requires a detailed knowledge of collisional rate coefficients between CO and H2 molecules. Fortunately, CO-H2 is a relatively well studied system (see summary in Schöier et al. 2005b) and calculated collisional rate coefficients currently exist for temperatures in the range 5 400 K and involve energy levels up to 29 and 20 for collisions with para-H2 and ortho-H2, respectively. Extrapolations up to a collisional temperature of 2000 K involving energy levels up to 40, adequate for AGB CSEs, are provided by Schöier et al. (2005b) and available for download though the on-line database LAMDA (www.strw.leidenuniv.nl/moldata). In AGB CSEs an ortho-to-para ratio of 3 is usually adopted when weighting together collisional rate coefficients for CO in collisions with ortho- and para-H2. Generally, and in particular for low mass-loss-rate objects, it is important that the excitation analysis also includes radiative excitation through the first vibrationally excited ( 1) state at 4.6 m (see Sect. 4.1). The models also include both a central source of radiation and the cosmic microwave background radiation at 2.7 K. The central radiation emanates from the star itself, which may be approximated by a blackbody. In some sources, where a prominent infrared-excess is observed, fitting the spectral energy distribution with two blackbodies provide a first approximation to the radiation field that the CSE is subjected to. Models that include an extended dust component in the CO excitation analysis may also be constructed (e.g., Schöier et al. 2002).
The size of the CO envelope is an important parameter, and the derived mass loss rate will depend on this (Sect. 4.1). If no radial brightness distributions exist the size of the circumstellar CO envelope can be estimated using the modelling presented in Mamon et al. (1988). It includes photodissociation, taking into account the effects of dust-, self- and H2-shielding, and chemical exchange reactions.
3.2. The energy balance equation
Once the level populations are known the kinetic gas temperature can be calculated in a self-consistent way by solving the energy balance equation (e.g., Goldreich & Scoville 1976),
| (2) |
where is the adiabatic index, the Boltzmann constant, the total heating rate per unit volume, and the total cooling rate per unit volume. The first term on the right hand side is the cooling due to the adiabatic expansion of the gas. Additional cooling is provided by mainly molecular line emission from CO, calculated from the derived level populations. In addition, HCN could be an important coolant in the inner parts of the envelope of carbon stars and H2O in the case of M-type AGB stars.
The mechanism responsible for the observed mass loss is probably radiation pressure acting on small dust grains, which in turn are coupled to the gas. The radiation pressure on the dust grains will give them a drift velocity, , relative to the gas (Gilman 1972; Goldreich & Scoville 1976) As a result of the dust-gas drift, kinetic energy of the order of will be transfered to the gas each time a particle collides with a dust grain. This is assumed to provide the dominating heating of the gas. Additional heating is provided by, e.g., the photoelectric effect (Huggins et al. 1988) that is important in the cool, tenuous, outer parts of CSEs around (in particular) high mass loss rate stars.
When solving the energy balance equation several free parameters describing the dust, i.e., via the dust-gas collisional heating, are introduced. These are highly uncertain, but affect the derived line intensities. For example, Schöier & Olofsson (2001) define a new parameter that contains most of the these uncertainties,
| (3) |
where is the dust-to-gas mass-loss-rate ratio, the density of a dust grain, the radius of a dust grain. The -parameter can be constrained if enough observational constraints are available (see Sect. 4.1).
4. Error analysis
A full, detailed, error analysis of the estimated mass loss rates is not possible due to the relatively large number of free parameters entering the model. Instead, some of the more important parameters may be varied in order to illustrate the sensitivity of the model, and to be able to get a rough estimate of the errors involved in the mass loss rate estimates.
4.1. Sensitivity tests
Detailed sensitivity tests within the adopted circumstellar model (see Sect. 3) have been performed by several authors (Kastner 1992; Groenewegen 1994; Schöier & Olofsson 2001; Olofsson et al. 2002). In Fig. 3 chi-square contour plots for three example stars (W Ori, R For, and LP And), produced by varying the mass loss rate and the -parameter, illustrating the accuracy in the determination of these two adjustable parameters when other parameters are held fixed (except for the CO outer envelope radius which is allowed to vary according to Mamon et al. 1988).
LP And is a high mass-loss-rate object where the excitation of 12CO is dominated by collisions. Consequently, the line intensities are very sensitive to the temperature structure, i.e., the -parameter. In the high mass loss rate regime the line intensities are also insensitive to the adopted mass loss rate since an increase in leads to more cooling ( while ), which compensates for the increase of molecular density. This ”saturation”-effect of the line intensities for high mass loss rates has been noted before in other models where the cooling by CO is treated in a self-consistent manner (Sahai 1990; Kastner 1992). W Ori, is a low mass loss rate object with low optical depths in the lowest rotational transitions. In the low mass-loss-rate regime the line intensities scale roughly linearly with . As expected the radiation emitted by the central star plays an important role in the excitation and the CO line intensities are less sensitive to the temperature structure (-parameter). R For presents an intermediate case between LP And and shares properties of both the low and the high mass-loss-rate stars. An intermediate mass-loss-rate model is generally more sensitive to the temperature structure than the radiation field, thus resembling the high mass loss rate objects. However, as in the low mass loss rate regime the line intensities scale roughly linearly with .
In additional tests, Schöier & Olofsson (2001) noted that the assumed envelope size does not significanly affect the derived mass loss rate in the high mass loss rate regime since the density is too low to excite the CO molecules effectively (the lines are sub-thermally excited) in the cool outer parts of the envelope (cf., Fig. 2), i.e., the emission is excitation limited. In contrast, for low mass-loss-rate objects the size of the envelope is important when determining the mass loss rate, i.e., the emission is photodissociation limited (at least for the lowest transitions). Schöier & Olofsson (2001) made tests which show that for typical envelope parameters the transition from photodissociation- to excitation-limited emission lies at 5 10-7 M⊙yr-1 for the transition. Higher -lines sample hotter and denser gas, located closer to the star, and are therefore less sensitive to the choice of the envelope size.
In summary, it is concluded that within the adopted circumstellar model the estimated mass loss rates are accurate to about 50% (neglecting errors introduced by the uncertain CO abundance and the distance estimates) when good observational contraints are available, but one should keep in mind that the causes of the uncertainty varies with the mass loss rate.
4.2. Comparison between various authors and methods
A rough way to estimate the errors involved is to compare with the results obtained from other self-consistent models. Schöier & Olofsson (2001) and recently Teyssier et al. (2006) present comparisons of derived mass-loss rates from detailed modelling found in the literature for a large number of sources. They usually find a very good agreement, within 30 %, when adjustments for differences in adopted CO abundance and distance have been made. For an individual star, however, the discrepancy can be as large as a factor of three.
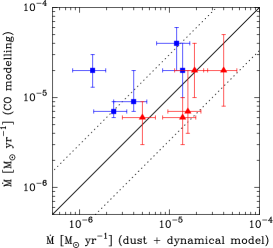
Dust radiative transfer modelling when coupled with a dynamical model of the wind can provide an independent estimate, to that of CO, of the gas mass-loss rate. In Fig. 4 derived gas mass-loss rates obtained from these two complementary methods are compared for a sample of intermediate- to high mass-loss-rate objects (Ramstedt et al. 2007, in prep.). It is found that the two methods are generally consistent within a factor of three. Possible systematic effects here are the adopted CO fractional abundance and dust properties.
4.3. Departures from the standard model
The sucessful modelling of the vast majority of AGB stars, assuming a spherically symmetric CSE, suggests that pronounced axi- or non-symmetric mass loss is not a common phenomenon among AGB stars. However, there are cases where clear bipolar outflows have been detected such as the carbon star V Hya (e.g., Hirano et al. 2004).
A small fraction ( 10%) of all carbon stars have detached molecular shells produced during a relatively short period of intense mass loss thought to be related to thermal pulses (e.g., Olofsson et al. 1996). To be able to put constraints on the mass loss and its variation with time, high spatial resolution observations are needed. Radial brightness distributions also reveal smaller modulations of the mass-loss rate for a number of AGB stars (e.g., Schöier & Olofsson 2001; Teyssier et al. 2006; see also Fig. 5). Moreover, an interacting wind scenario where the AGB wind sweeps up the ISM needs to be taken into account when interpreting mass-loss rate modulations (e.g., Le Bertre & Gérard 2004; Schöier et al. 2005a) and the degree of clumpiness of the circumstellar medium needs to be fully investigated.
5. Conclusions
The mass loss rate determination for AGB stars depends crucially on a number of assumptions in the CSE model. A reliable mass loss rate determination requires, in addition to a detailed radiative transfer analysis, good observational constraints in the form of multi-transition observations and radial brightness distributions. A standard CSE model, assuming a single smooth expanding wind produced by a continuous mass loss, can explain multi-transition single-dish line observations in the majority of AGB stars and objects with clear deviations from the basic model assumptions can easily be identified. However, in order to investigate small deviations in terms of mass-loss rate modulations (typically lower than a factor of two), departure from spherical symmetry, or the degree of clumpiness, high-spatial-resolution interferometric observations are required. Such new observations are already becoming available and reveal the composition of AGB circumstellar envelopes are usually pathcy and clumpy to some degree also at larger radial scales from the central star. The next generation of radiative transfer codes, as well as dynamical and chemical models of circumstellar envelopes, need to take such effects into account.
Acknowledgments.
F.L.S. acknowledges financial support from the Swedish research council.
References
- Babkovskaia & Poutanen (2006) Babkovskaia, N. & Poutanen, J. 2006, A&A, 447, 949
- Bergeat & Chevallier (2005) Bergeat, J. & Chevallier, L. 2005, A&A, 429, 235
- Bieging & Latter (1994) Bieging, J. H. & Latter, W. B. 1994, ApJ, 422, 765
- Cherchneff (2006) Cherchneff, I. 2006, A&A, in press
- Gérard & Le Bertre (2006) Gérard, E. & Le Bertre, T. 2006, AJ, 132, 2566
- Gilman (1972) Gilman, R. C. 1972, ApJ, 178, 423
- Glassgold & Huggins (1983) Glassgold, A. E. & Huggins, P. J. 1983, MNRAS, 203, 517
- Goldreich & Scoville (1976) Goldreich, P. & Scoville, N. 1976, ApJ, 205, 144
- González Delgado et al. (2003) González Delgado, D., Olofsson, H., Kerschbaum, F., et al. 2003, A&A, 411, 123
- Groenewegen (1994) Groenewegen, M. A. T. 1994, A&A, 290, 531
- Groenewegen et al. (1999) Groenewegen, M. A. T., Baas, F., Blommaert, J. A. D. L., et al. 1999, A&AS, 140, 197
- Gussie et al. (1995) Gussie, G. T., Taylor, A. R., Dewdney, P. E., & Roger, R. S. 1995, MNRAS, 273, 790
- Hirano et al. (2004) Hirano, N., Shinnaga, H., Dinh-V-Trung, et al. 2004, ApJ, 616, L43
- Hiriart & Kwan (2000) Hiriart, D. & Kwan, J. 2000, ApJ, 532, 1006
- Huggins et al. (1988) Huggins, P. J., Olofsson, H., & Johansson, L. E. B. 1988, ApJ, 332, 1009
- Kahane & Jura (1994) Kahane, C. & Jura, M. 1994, A&A, 290, 183
- Kastner (1992) Kastner, J. H. 1992, ApJ, 401, 337
- Le Bertre & Gérard (2004) Le Bertre, T. & Gérard, E. 2004, A&A, 419, 549
- Loup et al. (1993) Loup, C., Forveille, T., Omont, A., & Paul, J. F. 1993, A&AS, 99, 291
- Mamon et al. (1988) Mamon, G. A., Glassgold, A. E., & Huggins, P. J. 1988, ApJ, 328, 797
- Neri et al. (1998) Neri, R., Kahane, C., Lucas, R., Bujarrabal, V., & Loup, C. 1998, A&AS, 130, 1
- Olofsson et al. (1996) Olofsson, H., Bergman, P., Eriksson, K., & Gustafsson, B. 1996, A&A, 311, 587
- Olofsson et al. (2002) Olofsson, H., González Delgado, D., Kerschbaum, F., & Schöier, F. L. 2002, A&A, 391, 1053
- Ramstedt et al. (2006) Ramstedt, S., Schöier, F. L., Olofsson, H., & Lundgren, A. A. 2006, A&A, 454, L103
- Sahai (1990) Sahai, R. 1990, ApJ, 362, 652
- Schöier et al. (2005a) Schöier, F. L., Lindqvist, M., & Olofsson, H. 2005a, A&A, 436, 633
- Schöier & Olofsson (2001) Schöier, F. L. & Olofsson, H. 2001, A&A, 368, 969
- Schöier et al. (2002) Schöier, F. L., Ryde, N., & Olofsson, H. 2002, A&A, 391, 577
- Schöier et al. (2005b) Schöier, F. L., van der Tak, F. F. S., van Dishoeck, E. F., & Black, J. H. 2005b, A&A, 432, 369
- Teyssier et al. (2006) Teyssier, D., Hernandez, R., Bujarrabal, V., Yoshida, H., & Phillips, T. G. 2006, A&A, 450, 167
- van Loon et al. (2001) van Loon, J. T., Zijlstra, A. A., Bujarrabal, V., & Nyman, L.-Å. 2001, A&A, 368, 950