On the Photometric Redshift Estimates for FR II Radio Galaxies 111 Astronomy Letters, Vol. 31, No. 4, 2005, pp. 219-224. Original Russian Text Copyright 2005 by Verkhodanov, Kopylov, Pariiskii, Soboleva, Temirova. Translated from Pisma v Astronomicheskii Zhurnal, Vol.31, No.4, 2005, pp.243-249.
Abstract
Using the photometric data on FR II radio galaxies obtained in the Big Trio Program and data from other sources, we confirmed the stable correlation between the spectroscopic and photometric redshifts up to determined from the evolutionary synthetic spectra of elliptical galaxies. This is a confirmation for the theoretical predictions of the existence of a stellar population at high redshifts and its subsequent evolution corresponding to the population of giant elliptical galaxies.
Key words: radio galaxies, photometry, redshifts.
2005 Pleiades Publishing, Inc.
1 Introduction
The photometric redshifts that were first used by Baum back in 1962 (Baum 1962) still remain an important tool for studying the distant Universe (see, e.g., Botzler et al. 2004; Rocca-Volmerange et al. 2004; Vanzella et al. 2004; Budavari et al. 2003). Being measured from the spectral energy distribution, they are of paramount importance as the next-to-last selection step in searching for distant objects (Bunker et al. 2003; Franx et al. 2003; Idzi et al. 2004), especially with the emergence of full sky surveys such as SDSS (Abazajian et al. 2004) where the photometric classification is also used (Padmanabhan et al. 2004). The photometric zbecome a more powerful selection factor in searching for distant radio galaxies in combination with the radio-astronomical selection based on the spectral indices and morphology (Pariiskii et al. 1996).
Morphological signatures of radio galaxies, namely, type-II (FR II) objects in the classification by Fanaroff and Riley (1974), help to reveal distant objects for several reasons:
(1) these are intense and relatively young (compared to FR I) radio sources visible at any ;
(2) they have a formed radio structure, which is circumstantial evidence that the source has a reserve of time for the formation of its stellar population;
(3) the FR II radio galaxies have more intense emission lines than the FR I galaxies (Baum et al. 1995), which facilitates their spectroscopic studies.
In general, relatively close () FR II radio galaxies are identified with giant elliptical galaxies with high radio luminosities and old, homogeneous stellar populations. Therefore, this type of objects is convenient to use for photometric studies in radio cosmology (Pariiskii 2001). Note that the age and composition of the stellar population in radio galaxies can also be determined from the absorption lines and the continuum formed by this stellar population. However, the sensitivity is insufficient to detect such lines in the spectra of many distant radio galaxies. Besides, the measurement and identification procedure with the determination of the correct weight for each line isfairlycomplex. Using the continuum makes it possible to apply our knowledge about the composition and age of a radio galaxy’s stellar population based on evolutionary models.
Currently available models predict the fast formation (within 1 Gyr) of such systems even at (Pipino and Matteucci 2004), which allows photometric methods to be used to study them. The efficiency of selecting such galaxies by radio- astronomical methods, starting from moderate red shifts (), was confirmed by several teams (Pedani 2003). The combined Hubble diagram for radio galaxies and field galaxies (Jarvis et al. 2001; De Breuck et al. 2002) shows that the radio galaxies have the highest luminosities at any redshift, 0 ¡z¡5.2 (Reuland et al. 2003). In addition, the radio galaxies have supermassive black holes whose mass is generally proportional to that of the stellar bulge (; Magorrian et al. 1998), which is further evidence for the presence of a formed stellar population. The formation of radio galaxies at redshifts gives the already formed stellar populations at in the CDM models. Thus, when selecting distant radio galaxies, we effectively
single out giant elliptical galaxies that can be used for photometric studies. The above factors show the possibility of using the photometric technique to determine the redshifts from the stellar population for FR II radio galaxies at .
The most recent theoretical calculations (see, e.g., Rocca-Volmerange et al. 2004) indicate that evolutionary models of the spectra for elliptical galaxies can be applied even to radio galaxies with , when gE galaxies with a mass of have already been formed.
Nevertheless, the presence of intense emission lines (e.g., H, C IV, He II) in the spectra of several distance radio galaxies that were formed by various ionization mechanisms (Maxfield et al. 2002) near jets and “hot spots” raises the question of whether the evolutionary spectra of elliptical galaxies correspond to those of radio galaxies and, as a result, whether the photometric technique can be used to estimate the redshifts of radio galaxies.
In this paper, we consider the relation for two samples of FR II radio galaxies that we drew in our previous papers (Pariiskii et al. 1996; Verkhodanov et al. 1999, 2000a, 2000b) using the popular PEGASE (Projet d’Etude des Galaxies par Synthese Evolutive) evolutionary model of the stellar population (Fioc and Rocca-Volmerange 1997; Le Borgne and Rocca-Volmerange 2002). Apart from this model, we can use the GISSEL (Galaxy Isochrone Synthesis Spectral Evolution Library) model (Bruzual and Charlot 1993, 1996; Bolzonella et al. 2000), which yields similar results for the photometric redshifts. The files with the spectral energy distributions (synthetic spectra) for both evolutionary models of the stellar population can be found at http://sed.sao.ru (Verkhodanov et al. 2000).
2 The redshift estimation procedure
We took into account the absorption in our Galaxy using maps from Schlegel et al. (1998) written in the form of FITS files.
Before using the model curves, we smoothed them with filters by applying the following algorithm (Verkhodanov et al. 2002):
where is the initial model SED curve, is the model SED curve smoothed with the -th filter, is the transmission curve of the -th filter “compressed” by a factor of when “moving” along the wavelength axis of the SED curve, and is the point number in the filter transmission curve. We constructed the two-dimensional (, filter) array of smoothed synthetic stellar spectra from the SED curves formed in this way for the subsequent calculations.
We estimated the redshifts and ages of the stellar populations by choosing the optimal positions of the photometric magnitudes obtained in various bands during the observations of radio galaxies in the smoothed SED curves. We used the computed and tabulated SED curves for different ages. The algorithm of choosing the optimal positions of the data points in the curve (Verkhodanov et al. 1996)
consisted in shifting the observational points along the wavelength and intensity axes of the SED curves. In this way, we found the position at which the sum of the squares of the deviations of the data points from the corresponding smoothed curves was at a minimum; i.e., we actually calculated the minimum of the value:
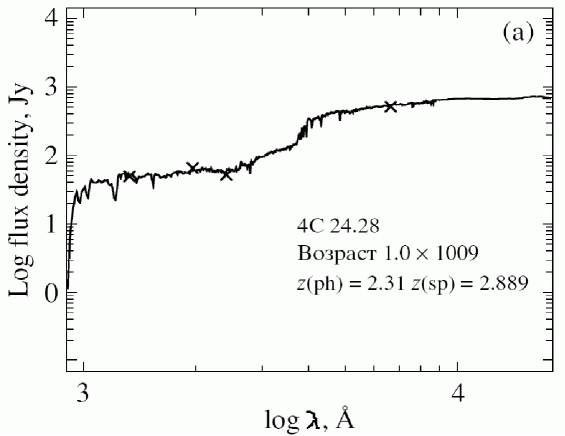
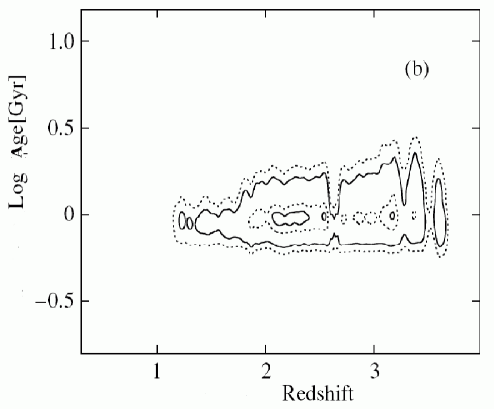
where is the observed magnitude in the kth filter, is the model magnitude for a given spectral energy distribution in the -th filter at given , is a free coefficient, and is the measurement error. The redshift was determined from the shift in the positions of the observed magnitudes at their best positions in the SED curves from the “rest frame” position. From the whole set of curves for different ages, we chose those for which the sum of the squares of the residuals for the observational data of radio galaxies was at a minimum. Figure 1 shows an example of applying the described technique to the radio galaxy 4C 24.28 or, more specifically, the two-dimensional section of the three-dimensional likelihood function dependent on the following parameters: the redshift, the age, and the flux density, along with the positions of the photometric points in the SED curve corresponding to the maximum of the likelihood function.
We checked the validity of our redshift (and age) estimates by two methods. First, we took the synthetic spectra obtained by smoothing the SED curves for different ages with filters. This procedure enabled us to model the CCD observations for five filters. Subsequently, we chose the data points corresponding to the VIJHK filters, for example, at the redshift
, and the evolutionary spectra with ages of 1 and 5 Gyr. For each age, we performed two magnitude estimation tests: with fixed and unfixed redshift. These tests lead us to conclude that both the age and the redshift are determined reliably. However, there is a possibility of falling on the neighboring age curve, which gives an error of 200 Myr, and the result for unfixed is also affected by the quantization in wavelength in the SED curves (the error in reaches 6%).
In the second case, we explored the possibilities of determining the redshifts and ages of the stellar
| Name | ||
|---|---|---|
| 3C 13 | 1.35 | 1.54 |
| 3C 65 | 1.176 | 1.17 |
| 3C 68.2 | 1.575 | 1.37 |
| MRC 0316-257 | 3.142 | 2.64 |
| MRC 0406-244SE | 2.427 | 1.86 |
| 4C 41.17 | 3.8 | 4.20 |
| 3C 184 | 0.994 | 1.04 |
| 3C 194 | 1.185 | 2.07 |
| 3C 239 | 1.781 | 0.86 |
| 3C 241 | 1.617 | 1.59 |
| B21056+39 | 2.171 | 2.53 |
| 4C 34.34 | 2.40 | 1.08 |
| 3C 266 | 1.275 | 0.74 |
| 3C 267 | 1.142 | 1.17 |
| 4C 26.38S | 2.609 | 2.61 |
| 4C 39.37 | 3.225 | 3.73 |
| 3C 280 | 0.996 | 0.70 |
| B21256+36 | 1.13 | 1.12 |
| 4C 24.28 | 2.889 | 2.31 |
| 3C 294 | 1.779 | 2.36 |
| 53W091 | 1.55 | 1.17 |
| 3C 368 | 1.132 | 1.17 |
| 4C 40.36 | 2.267 | 1.96 |
| 4C 48.48 | 2.348 | 1.95 |
| MRC 2025-218 | 2.63 | 2.39 |
| 3C 437 | 1.48 | 1.60 |
| 4C 28.58 | 2.905 | 3.17 |
| PK 2353-018 | 1.028 | 1.10 |
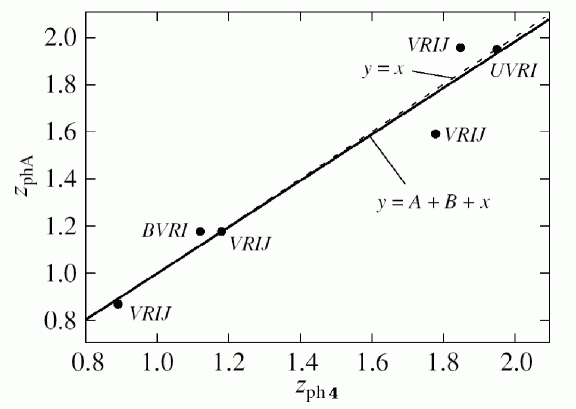
populations in the parent galaxies from multicolor photometry. For this purpose, we selected about 40 distant radio galaxies with known redshifts and with published magnitudes at least in three filters (Verkhodanov et al. 1998b, 1999). First, we determined only the ages of the stellar populations of the parent galaxies at fixed known redshifts from the collected photometric data. Then, we searched for the optimal model SED curve with the simultaneous determination of the redshift and the age of the stellar population. Subsequently, we compared the values obtained. Using this method, we estimated both the galaxy’s age and its redshift based on the given models (see also Verkhodanov et al. 1998a, 1999). It is clear from general considerations that the reliability of the result at high redshifts depends significantly on the availability of infrared data (up to the Kband), since our fitcovers the range of fast change in the spectrum (a jump) before the optical SED range; thus, we can determine the position of our data reliably, with a pronounced maximum in the likelihood curve. Indeed, in testing the reliability of our procedure using the available measurements when keeping only three points, one of which is in the Kband , we obtain the same result in the likelihood function as that obtained from four or five points. If, however, the infrared range is not used, then the result is found to be more uncertain. However, as we showed previously (Verkhodanov et al. 1999), the case of four closely spaced filters, as in our case of BVRIphotometry, yields a good result in the check sample of six objects (Fig. 2) that matches the result obtained by using all filters, including the infrared band. Note that this set of filters works stably at medium redshifts (), which closely corresponds to the sample of radio galaxies in the “Big Trio” Program.
3 The samples of objects
3.1 Radio Galaxies with
As was mentioned above, to test our technique and to estimate the redshifts and ages of stellar systems, we drew our sample of distant () FRII radio galaxies with spectral indices and with redshifts up to (Verkhodanov et al. 1998b, 1999) from the data obtained by other authors.
It should be noted that the published photometric data are highly inhomogeneous. They were obtained not only by different authors, but also on different instruments and with different filters. The measurements for the same object were not always made with the same apertures, etc. Therefore, after the final selection, only 42 of the 300 radio galaxies from the primary sample remained. Most of the objects were not included in the sample, because they have the properties of quasars, which severely complicates the use of the SED procedure for standard elliptical galaxies. From the remaining objects, we chose only the radio galaxies with an FR II structure (28 galaxies, Table 1).
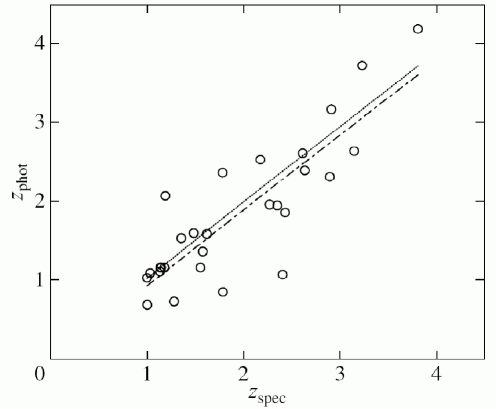
Figure 3 shows the “spectroscopic redshift — photometric redshift” relation for FR II radio galaxies with . The correlation coefficient calculated from
| Name | Notes | |||||
|---|---|---|---|---|---|---|
| J0105+0501 | 1.05 | 79/25 | 22.8 | 3.14 | 3.5 | FR II ? |
| J0444+0501 | 1.09 | 214/69 | 22.7 | 2.73 : | 2.35 | FR II |
| J0209+0501 | 1.16 | 89/33 | 18.5 | 0.285 | 0.38 | Pointlike |
| J0457+0452 | 1.12 | 201/56 | 19.4 | 0.482 | 0.41 | FR I |
| J0908+0451 | 0.92 | 301/109 | 19.6 | 0.525 | 0.48 | FR II |
| J1124+0456 | 0.94 | 935/400 | 17.8 | 0.284 | 0.36 | FR II |
| J1155+0444 | 1.0 | 141/54 | 18.6 | 0.289 | 0.33 | FR II |
| J1333+0451 | 1.3 | 42/11 | 18.1 | 1.405 | 1.04 | FR II QSR |
| J1339+0445 | 1.07 | 119/41 | 22.6 | 0.74 | 0.67 | FR II Triple |
| J1626+0448 | 1.26 | 191/46 | 22.9 | 2.656 | 2.30 | FR II |
| J1722+0442 | 0.99 | 763/300 | 20.7 | 0.604 | 1.0 | FR II |
| J2029+0456 | 0.69 | 142/53 | 21.7 | 0.78 | 0.81 | FR II |
| J2224+0513 | 0.93 | 346/107 | 21.3 | 0.96 | 0.93 | FR II |
all of the data in Table 1 is 0.85. If we discard the outlying data attributable to random errors, where is much higher than (the objects 3C 239, 3C 266, 4C 34.34), then the correlation coefficient becomes 0.91.
3.2 Radio Galaxies from the RC Catalog
We drew our second sample from FR II radio galaxies with steep spectra discovered in the RATAN–600 “Kholod” survey (Parijskij et al. 1991, 1992) using multicolor photometry to estimate the color redshifts and the ages of the parent galaxies’ stellar systems (Parijskij et al. 1996; Verkhodanov et al. 2002). In the “Big Trio” observations (Parijskij et al. 1996, 1998), the BVRI magnitudes were measured for about 60 radio galaxies, and it was found that although their color ages had a large dispersion, the redshifts could be estimated reliably.
Subsequently, 20 objects were observed spectroscopically with the SCORPIO instrument at the 6 m BTA telescope (Afanasiev et al. 2002, 2003). Their measurements (Kopylov et al. 1995a, 1995b; Parijskij et al. 1996, 1998) and photometric estimates based on BTA observations (Parijskij et al. 1996; Verkhodanov et al. 2002a, 2002b) were obtained before spectroscopy by Afanasiev et al. (2002, 2003) and are collected in Table 2.
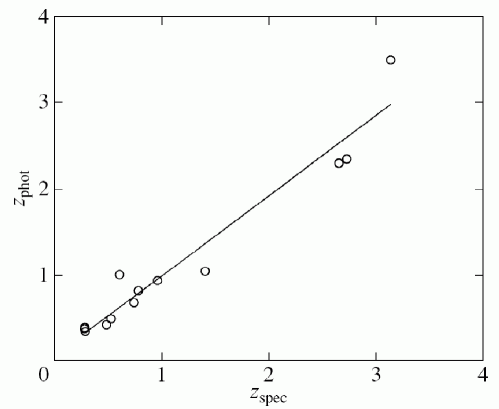
As we see from Table 2, the measurements confirm our photometric estimates (Fig. 4) even for some of the quasars. The correlation coefficient estimated from the observations of Kholod radio galaxies is 0.92.
4 Conclusions
Using the photometric data for FR II radio galaxies with steep spectra obtained as part of the “Big Trio” Program and data from other sources in the astronomical literature, we have confirmed the stable correlation between the spectroscopic and photometric redshifts up to determined from the evolutionary synthetic spectra of elliptical galaxies. The technique that we have used since 1995 (Parijskij et al. 1996) confirms its efficiency in selecting distant radio galaxies and investigating their evolutionary properties.
The fact that the photometric estimates for FR II radio galaxies are close to direct measurements suggests that the continuum optical spectra of radio galaxies can be described by stellar models, while the evolutionary models of elliptical galaxies used correspond to the stellar population of distant radio galaxies and are generally evidence of its existence at high redshifts. This conclusion allows us to further use the photometric methods based on evolutionary models with a high degree of confidence to study FR II radio galaxies and to estimate cosmological parameters (Verkhodanov and Parijskij 2003; Starobinsky et al. 2004).
5 Acknowledgements
O.V. Verkhodanov and A.I. Kopylov are grateful to the Russian Foundation for Basic Research (project no. 02-07-90038) for partial support of this work. Yu.N. Pariiskii was supported by grants from the “Integration” and “Astronomy” Programs and the Russian Foundation for Basic Research. We wish to thank the referee for remarks that improved the paper.
References
- 1 K. Abazajian, J. K. Adelman-McCarthy, M. A. Agueros, et al. (SDSS collaboration), Astron. J. 128, 502 (2004).
- 2 V. L. Afanasiev et al., Preprint No. 139, SPb filial SAO RAN (St. Petersburg branch of Spec. Astrophys. Obs., Russ. Acad. of Sci., 2002).
- 3 V. L. Afanasiev et al.,Astron. Zh. 80, 409 (2003) [Astron. Rep. 47, 377 (2003)].
- 4 W. A. Baum, Proc. IAU Symp.15,Problemsof Extra-Galactic Research Ed.byG.C.McVittie (Macmillan Press, New York, 1962), p. 390.
- 5 S. A. Baum,E.L. Zirbel, and C.P.O’Dea, Astrophys. J. 451, 88 (1995).
- 6 M. Bolzonella, J.-M. Miralles, and R. Pelló, Astron. Astrophys. 363, 476 (2000); astro-ph/0003380.
- 7 C. S. Botzler, J. Snigula, R. Bender, et al., Mon. Not. R. Astron. Soc. 349, 425 (2004).
- 8 G. Bruzual and S. Charlot, Astrophys. J. 405, 538 (1993).
- 9 G. Bruzual and S. Charlot, 1996, anonymous@ftp://gemini.tuc.noao.edu/pub/charlot/bc96
- 10 T. Budavari, A.J.Connolly,A.S. Szalay, et al., Astron. Astrophys. Suppl. Ser. 202, 1901 (2003).
- 11 A. J. Bunker, E. R. Stanway, R. S. Ellis, et al., Astron. Astrophys. Suppl. Ser. 202, 1110 (2003).
- 12 K. Chambers and S. Charlot, Astrophys. J. 348,L1 (1990).
- 13 C. De Breuck, W. van Breugel, S. A. Stanford, et al.), Astron. J. 123, 637 (2002).
- 14 B. L. Fanaroff and J. M. Riley, Mon. Not. R. Astron. Soc. 167, 31p (1974).
- 15 M. Fioc and B. Rocca-Volmerange, Astron. Astrophys. 326, 950 (1997).
- 16 M. Franx, I. Labbe, G. Rudnick, el al., Astrophys. J. 587, L79 (2003).
- 17 M. J. Jarvis, S. Rawlings, S. Eales, et al., Mon. Not. R. Astron. Soc. 326, 1585 (2001).
- 18 R. Idzi, R. Somerville, C. Papovich, et al., Astrophys. J. 600, L115 (2004).
- 19 A. I. Kopylov, V. M. Goss, Yu.N.Pariiskii, et al., Astron. Zh. 72, 613 (1995) [Astron. Rep. 39, 543 (1995)].
- 20 A. I. Kopylov, V. M. Goss, Yu.N.Parijskij, et al., Astron. Zh. 72, 437 (1995) [Astron. Rep. 39, 383 (1995)].
- 21 D. Le Borgne and B. Rocca-Volmerange, Astron. Astrophys. 386, 446 (2002).
- 22 J. Magorrian, S. Tremaine, D. Richstone, et al.,Astron. J. 115, 2285 (1998).
- 23 L. Maxfield, H. Spinrad and D. Stern, Astron. J. 123, 2321 (2002).
- 24 E. Moy and B. Rocca-Volmerange, Astron. Astrophys. 383, 46 (2002).
- 25 N. Padmanabhan, T. Budavari, D. J. Schlegel, et al., Mon. Not. R. Astron. Soc., (2004) (submitted); astroph/0407594.
- 26 Yu.N.Parijskij, Proc. NATO Advanced Study Inst., Current Topics in Astrofundamental Physics: the Cosmic Microwave Background Ed. by Norma G. Sanchez (Kluwer Acad. Publ., 2001), p. 219.
- 27 Yu.N.Parijskij, W.M.Goss, A. I. Kopylov, et al., Bull. Spec.Astrophys.Obs. 40, 5 (1996).
- 28 Yu.N.Pariiskii, A. I. Kopylov, V. M. Goss, et al., Astron. Zh. 75, 483 (1998) [Astron. Rep. 42 425 (1998)].
- 29 Yu.N.Parijskij, W.M. Goss, A. I. Kopylov, et al., Astron. Astrophys. Trans. 19, 297 (2000).
- 30 M. Pedani, New Astron. 8, 805 (2003).
- 31 A. Pipino and F. Matteucci, Mon. Not. R. Astron. Soc. 347, 968 (2004).
- 32 M. Reuland, W. van Breugel, H. Röttgering, et al., Astrophys. J. 592, 755 (2003).
- 33 B. Rocca-Volmerange and B. Guiderdoni, Astron. Astrophys. Suppl. Ser. 75, 93 (1988).
- 34 B. Rocca-Volmerange, D. Le Borgne, C. De Breuck, et al., Astron. Astrophys. 415, 931 (2004).
- 35 D. Schlegel, D. Finkbeiner, and M. Davis, Astrophys. J. 500, 525 (1998).
- 36 A. A. Starobinsky, Yu. N. Parijskij, and O. V. Verkhodanov, Tr. Gos. Astron. Inst. Shternberga LXXV, 198 (2004).
- 37 E. Vanzella, S. Cristiani, A. Fontana, et al.,Astron. Astrophys. 423, 761 (2004).
- 38 O. V. Verkhodanov, Bull. Spec. Astrophys. Obs. 41, 149 (1996).
- 39 O. V. Verkhodanov, A. I. Kopylov, Yu. N. Parijskij, et al., Bull. Spec.Astrophys.Obs. 48, 41 (1999); astroph/9910559.
- 40 O. V. Verkhodanov, A. I. Kopylov, Yu. N. Parijskij, et al.,Astron. Zh. 79, 589 (2002) [Astron. Rep. 46, 531 (2002)].
- 41 O. V. Verkhodanov, A. I. Kopylov, O. P. Zhelenkova, et al., Atsron. Astrophys. Trans. 19, 62 (2000); astroph/9912359, http://sed.sao.ru.
- 42 O. V. Verkhodanov, Yu.N.Parijskij, N. S. Soboleva, et al., Bull. Spec.Astrophys.Obs. 52, 5 (2002); astroph/0203522.
- 43 O. V. Verkhodanov and Yu. N. Parijskij, Bull. Spec. Astrophys. Obs. 55, 66 (2003).
Translated by N. Samus’