A Census of the Carina Nebula – II. Energy Budget and Global Properties of the Nebulosity
Abstract
The first paper in this series took a direct census of energy input from the known OB stars in the Carina Nebula, and in this paper we study the global properties of the surrounding nebulosity. This detailed comparison may prove useful for interpreting observations of extragalactic giant H ii regions and ultraluminous infrared galaxies. We find that the total IR luminosity of Carina is about 1.2107 L⊙, accounting for only about 50–60% of the known stellar luminosity from Paper I. Similarly, the ionizing photon luminosity derived from the integrated radio continuum is about 71050 s-1, accounting for 75% of the expected Lyman continuum from known OB stars. The total kinetic energy of the nebula is about 81051 ergs, or 30% of the mechanical energy from stellar winds over the lifetime of the nebula, so there is no need to invoke a supernova (SN) explosion based on energetics. Warm dust grains residing in the H ii region interior dominate emission at 10-30 m, but cooler grains at 30–40 K dominate the IR luminosity and indicate a likely gas mass of 106 M⊙. We find an excellent correlation between the radio continuum and 20-25 m emission, consistent with the idea that the 80 K grain population is heated by trapped Ly photons. Similarly, we find a near perfect correlation between the far-IR optical depth map of cool grains and 8.6 m hydrocarbon emission, indicating that most of the nebular mass resides as atomic gas in photodissociation regions and not in dense molecular clouds. Synchronized star formation around the periphery of Carina provides a strong case that star formation here was indeed triggered by stellar winds and UV radiation. This second generation appears to involve a cascade toward preferentially intermediate- and low-mass stars, but this may soon change when Car and its siblings explode. If the current reservoir of atomic and molecular gas can be tapped at that time, massive star formation may be rejuvinated around the periphery of Carina much as if it were a young version of Gould’s Belt. Also, when these multiple SNe occur, the triggered second generation will be pelted repeatedly with SN ejecta bearing short-lived radioactive nuclides. Carina may therefore represent the most observable analog to the cradle of our own Solar System.
keywords:
H ii regions — ISM: individual (NGC 3372) — stars: formation1 INTRODUCTION
The Carina Nebula (NGC3372) is the nearest massive star-forming region that satisfies three criteria which distinguish it from other Galactic giant H ii regions: 1) it harbors the most extreme grouping of massive stars within a few kpc of the Sun, including 70 O stars initially (some, like Car, have now moved off the main sequence) that are in the process of creating a giant superbubble, 2) it is young enough that active star formation is still ongoing within a few parsecs of these massive stars, and 3) unlike any comparable massive cluster in our Galaxy, our sightline to it suffers little interstellar extinction, allowing it to be studied across the electromagnetic spectrum and not just at infrared (IR) and radio wavelengths. This last point is critical, because it offers the potential to construct a relatively complete picture of the massive star-forming environment and the stellar content. The first two indicate that Carina is our nearest suitable analog of more extreme regions like 30 Doradus. Finally, unlike many Galactic regions, the distance to Carina (2.3 kpc) is known to within a few percent from the expansion parallax of Carinae’s circumstellar nebula (see Smith 2006b, 2002a; Allen & Hillier 1993), so that the properties one derives are reliable.
In this paper we aim to assess the total energy budget of the region and the global properties of the large-scale nebulosity. In a previous paper (Smith 2006a; hereafter Paper I) we compiled the total energy input from the known stellar population, including both radiation and mechanical energy from stellar winds. Thus, with the energy input known, we can evaluate the efficiency with which stellar radiation is reprocessed by the gas and dust. Carina is an ideal laboratory for comprehensive multiwavelength studies of an environment much like that where our own solar system may have formed, where young protoplanetary disks will be bombarded by supernova ejecta. It also represents the early stages of the birth of an OB association, and it is an environment where this young OB association is triggering the birth of a second generation of stars as they destroy their own natal giant molecular cloud.
Our goals here are twofold. First, we wish to evaluate the global energy budget of the entire Carina Nebula by examining its overall, average observed properties, much as if it were an unresolved extragalactic giant H ii region. We can then compare this nebular energy budget with the known stellar energy input (Paper I). This provides a check on the validity of deriving stellar properties using similar observations of more distant H ii regions where the stars cannot be counted individually (e.g., Kennicutt 1984, 1998), as well as the most extreme examples of star formation in ultraluminous infrared galaxies (ULIRGs). Second, we examine large-scale correlations between various tracers of ionized gas, polycyclic aromatic hydrocarbons (PAHs), and warm and cold dust properties, providing more complete insight to the global structure of giant H ii regions.
2 MULTIWAVELENGTH OBSERVATIONS
2.1 Visual-Wavelength Images
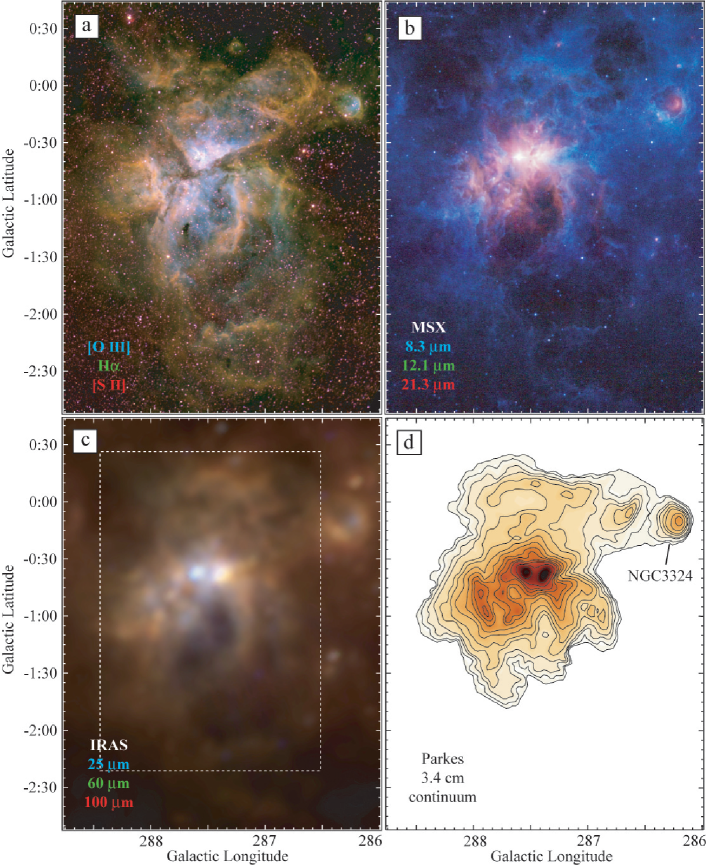
We incorporate wide-field optical images of the Carina region taken through narrowband filters transmitting [O iii] 5007, H, and [S ii] 6717,6731, as well as images through the broadband and filters. The images were already presented and discussed briefly by Smith et al. (2000), and were obtained in 1999 April as part of the Mount Stromlo and Siding Spring Observatory (MSSSO) H survey (Buxton et al. 1998). See Smith et al. (2000) for more details. Figure 1 shows a three-color version of the [O iii] + H + [S ii] image. The H filter is contaminated by emission from [N ii] 6583, but this effect is less than 5% over the brightest parts of the nebula (Smith et al. 2004b). While the [N ii]/H ratio rises in ionization fronts at the edges of the nebula, these faint outer regions contribute little to the total H flux. The narrowband images used here were flux calibrated in ergs s-1 cm-2 arcsec-2 (integrated over each filter bandwidth) by matching counts in diffuse regions near the Keyhole nebula to the observed surface brightness in the same regions in flux-calibrated images of the Keyhole obtained with HST/WFPC2 (see Smith et al. 2004b). The calibrated images have been corrected for an average interstellar extinction of =0.4 and =4.8 indicated by nebular gas in that part of the inner Carina Nebula (Smith 2002b; Smith et al. 2004b), but obviously this does not correct for patches of local extinction by dark clouds.
2.2 Mid-IR: MSX
The Carina Nebula was observed by the Midcourse Space Experiment (MSX) satellite, which is a Ballistic Missile Defense Organization satellite launched in 1996 April, equipped with a 33cm diameter telescope and IR imager called SPIRIT III. Details of the instrumentation are given by Egan et al. (1998), while a description of the astronomical experiments is given by Price (1995). A brief initial discussion of the MSX observations of Carina was already given by Smith et al. (2000), but a more thorough analysis will be undertaken here. We consider observations of Carina obtained in four filters: Band A (=6.8–10.8 ), Band C (=11–15.3 ), Band D (=13–16.5 ), and Band E (=17.5–27.5 ). In general, for extended regions, Band A is dominated by PAH emission features, while Band E is dominated by thermal continuum emission from hot dust grains. Band E also includes a broad 21.3 emission feature, presumably caused by silicate emission, which is strong in the inner Carina Nebula (Chan & Onaka 2000) and the supernova remnant Cas A (Arendt et al. 1999). The effective spatial resolution in these images is about 18″ or better.
Several individual image tiles for each filter were obtained from the archive at the Infrared Processing and Analysis Center (IPAC) and mosaiced together to produce a wide-field image of the entire region. The resulting mosaic images in each filter were then spatially aligned with the optical images, resulting in a pixel scale of 1235 and a total field of view of 2.84 square degrees, as shown in Figure 1. The original image data were calibrated in irradiance units of W m-2 ster-1. In order to measure the total flux from the region, we converted these to Jy arcsec-2 using the bandwidth of each filter.
2.3 Far-IR: IRAS
As with the MSX data, we used the IPAC archive to retrieve several tiled images obtained by the Infrared Astronomical Satellite (IRAS). We mosaiced together the individual tiles into a large image in each of the four IRAS bands (12, 25, 60, and 100 ), and then spatially aligned these to the optical and MSX images. The result is shown in Figure 1. We did not use higher-resolution IRAS images at 60 and 100 from the IRAS Glaxy Atlas because we are most interested in global properties, and we need accurate absolute fluxes to investigate dust color temperatures and optical depths from image ratios at various wavelengths.
2.4 Radio Data
In order to measure the total radio continuum flux as a proxy for the ionizing flux in the nebula, we need a radio continuum map that covers the whole Carina region with single-dish data. This is because flux at low spatial frequencies is lost in interferometric data like that from the Molonglo Observatory Synthesis Telescope (MOST) presented by Whiteoak (1994), although we will use those data for investigating the multiwavelength morphology.
To date, the best single-dish radio continuum map of Carina is still the 3.4cm continuum map made over 30 years ago by Huchtmeier & Day (1975). This map, obtained with the 64m Parkes telescope, has an effective spatial resolution of 26, comparable to the IRAS data. Unfortunately, the data were not available to us in digital form. Therefore, we used a crude technique to digitize the contour map published by Huchtmeier & Day (1975) into a FITS file (i.e. we drew a grid over the original contour map, and read-off the intensity in each pixel, interpolating when necessary). This yielded a map of the 3.4cm intensity over most of the nebula, shown in Figure 1, which can then be used to measure the integrated 3.4cm flux and the spatial distribution of free-free radio emission. This map is missing some low surface brightness emission in the outer nebula, which can be seen in the H image but is below the lowest radio contour level. This low-level emission should contribute less than 10% of the total flux, which is less than the uncertainty.
Additional radio data will be considered later in this paper as well. To examine the spatial distribution of 0.843 GHz radio continuum emission at higher spatial resolution (roughly 30″), we will examine the MOST maps from Whiteoak (1994), as mentioned above. These data were obtained from the online Molonglo Galactic Plane Survey (MGPS) made with the MOST telescope.111www.physics.usyd.edu.au/astrop/most. To compare the distribution of molecular gas in giant molecular clouds, we will use the emission maps of Carina obtained by the recent 12CO(1–0) NANTEN survey of Yonekura et al. (2005), which have an effective beam size of 27.
3 INTEGRATED NEBULAR PROPERTIES
To evaluate the global mass and energy budget of Carina, we wish to measure the total IR luminosity, the total free-free radio continuum emission, and the total H flux emitted by the entire nebula. We begin with thermal dust emission.
3.1 The SED and the Total IR Luminosity
We regard the presence of the exceedingly bright object Carinae as anomalous compared to most giant H ii regions, since Car is in a very brief eruptive evolutionary phase. Therefore, we subtracted its direct influence from the total integrated fluxes. Since nearly all of its stellar radiation is reprocessed by circumstellar dust and escapes in the IR (Smith et al. 2003b), radiation from Car no longer contributes to the radiative energy budget of the H ii region. This is appropriate, since in many of the images Car itself is saturated, and thus, the global integrated flux including Car would be incorrect anyway. Before summing the total observed flux for each filter within the box in Figure 1, we used imedit in iraf to carefully interpolate over Carinae, removing its flux from each image. This process was admittedly subjective because of possible confusion between Car and the diffuse source Car ii (the Keyhole Nebula) at some wavelengths. However, the integrated IR to radio spectral energy distribution (SED) of Car is known well (e.g., Cox et al. 1995; Morris et al. 1999; Smith et al. 2003b; Brooks et al. 2005), providing an independent check on our results, and the complex structure of the Keyhole region including Car has been observed at higher resolution at optical to radio wavelengths (Brooks et al. 1998, 2000, 2001, 2005; Cox & Bronfmann 1995; Smith 2002b; Whiteoak 1994), which helps minimize confusion. This subtraction is important in H and in the mid-IR at 8–30 , where Car itself contributes nearly half of the total flux from the Carina Nebula. However, at the more critical far-IR and radio wavelengths of interest here, Car’s contribution is minimal anyway, as it provides less than 3% and 0.5% of the total emission at 60 and 100 , respectively.
| () | I.D. | Units | Flux | Error |
|---|---|---|---|---|
| 0.501 | [O iii] | erg s-1 cm-2 | 2.12(-7) | 5% |
| 0.656 | H | erg s-1 cm-2 | 6.40(-7) | 5% |
| 8.3 | MSX A | Jy | 1.54(4) | 10% |
| 12.1 | MSX C | Jy | 4.26(4) | 10% |
| 14.7 | MSX D | Jy | 3.49(4) | 10% |
| 21.3 | MSX E | Jy | 9.55(4) | 10% |
| 12 | IRAS 1 | Jy | 4.26(4) | 10% |
| 25 | IRAS 2 | Jy | 1.53(5) | 10% |
| 60 | IRAS 3 | Jy | 8.75(5) | 10% |
| 100 | IRAS 4 | Jy | 1.43(6) | 10% |
| 34000 | Parkes | Jy | 1.43(3) | 20% |
Table 1 lists integrated fluxes at each wavelength for the entire Carina Nebula, summed over the region within the dashed rectangular box in Figure 1. This includes most of the observed filaments associated with Carina, but attempts to exclude the emission from the nearby H ii region NGC3324. The total fluxes have been sky subtracted by sampling a region of blank sky at the bottom of the images, but subtraction of the irregularly varying diffuse emission from the Galactic plane itself was problematic. This was the main source of uncertainty quoted in the last column of Table 1. By sampling nearby regions in the Galactic plane immediately adjacent to Carina, we found that this diffuse emission may contribute as much as 5% at the shorter mid-IR wavelengths, and possibly as much as 10% of the total flux at 60 and 100 . The fluxes in Table 1 have therefore been reduced by these fractions.222The high precision to which the 12.1 m MSX flux matches the 12 m IRAS flux is fortuitous. However, even general agreement despite the differences in resolution and sensitivity reassures us that our method of measuring the integrated flux is sound. The H and [O iii] images were background subtracted before taking the total flux by fitting a surface polynomial to the background Galactic plane emission. These two images were also continuum subtracted before measuring the total flux using a scaled version of the R band image for H and an average of the R and B band images for [O iii]. Continuum subtraction was not perfect, but the difference in total line flux before and after continuum subtraction was 3% in both filters.
The observed total fluxes from Carina are plotted in Figure 2, which shows the IR-to-radio SED of the whole nebula. It is striking how similar the SED of Carina is to that of a typical ULIRG (e.g., Sanders & Mirabel 1996). A fit to this SED is shown by the solid curve, using emission from three optically thin greybody (i.e. emissivity ) components at T=220, 80, and 35 K, plus a simple component from optically thin thermal bremsstrahlung radio continuum emission. We chose 3 specific dust temperatures because this is the minimum number that can account for the observed SED’s shape, but it is possible that the spectrum at mid-IR wavelengths can be approximated by a range of temperatures. However, decomposing the SED into additional components would not significantly alter the estimate of the total luminosity and dust mass (Table 2). Fluxes in the 8.3, 12–12.1, and 21.3 filters are allowed to be somewhat above this fit because they may contain strong emission from PAH and silicate emission features at 8.6, 9.7, 11.3, and 22 . These emission features suggest that the 220 K component in Figure 2 and Table 2 does not truly represent continuum emission from hot grains. Hence, the 220 K component’s dust mass in Table 2 is listed in parentheses. In any case, the shorter IR wavelengths are unimportant in the mass budget.

| T(K) | L/L⊙ | Md/M⊙ |
|---|---|---|
| 35 | 7.6106 | 9590 |
| 80 | 3.1106 | 28 |
| 220 | 1.1106 | (0.23) |
| Total | 1.18107 | 9620 |
The luminosities for each of these three component fits and the total are listed in Table 2. As long as the dust grains are small (0.2 ), the dust mass required to emit this IR luminosity can be expressed independently of the grain radius and emissivity (see Smith & Gehrz 2005), so that
| (1) |
where is the Stefan-Boltzmann constant. This relation was used to derive the dust masses for each component in Table 2, assuming a typical grain density of about 3 g cm-3. Given our assumption of optically thin emission, the true dust mass may be higher than that given in Table 2 if additional mass can be hidden in dense cloud cores that are optically thick even at far-IR wavelengths. However, given that the peak value of the 60 optical depth is only 0.005 and the average is much lower than that (see §4.1 and Fig. 4b), any optically thick clumps must constitute a tiny fraction of the solid angle of the nebula, so that the bulk of the far-IR emission is, in fact, dominated by optically thin emitting dust. Optically thick cores may cause submillimeter or millimeter emission in excess of the 35 K component in Figure 2, and future observations will be useful in that regard. However, preliminary analysis of a 1mm survey of the brightest parts of the nebula (K. Brooks et al. in prep.; see Brooks et al. 2005), with a 2 sensitivity equivalent to a 10 M⊙ core at 10 K, suggest an accumulated gas mass in such cold cores of no more than 5,000 M⊙. Similarly, Yonekura et al. (2005) detected 15 cores in C18O emission, with a combined mass of only 2.6103 M⊙. Also, the near-perfect correlation between the 60 optical depth and the 8.6 PAH emission (see §4.1) argues that optically thick cores contribute little to the global 60-100 emission from Carina.
The total integrated IR luminosity from these three dust components amounts to 1.2107 L⊙ at a distance of 2.3 kpc. Thus, dust absorbs and reprocesses 50–60% of the available bolometric luminosity from all stars in Carina, which is 2107 L⊙ (Paper I).333Excluding Car’s luminosity of 5106 L⊙ (Smith et al. 2003b). Most of Car’s radiation escapes in the mid-IR, which has already been subtracted directly from our data.
The coolest 35 K component, probably dominated by heating from FUV photons, contributes about 65% of the IR luminosity or about 40% of the total luminosity. This suggests that about 20% of the FUV radiation escapes through holes in the nebula or is processed by PAH emission, if 0.5 (see Paper I). The 35 K component dominates the emission seen at far-IR wavelengths, in agreement with earlier studies of the far-IR emission from smaller sections of the nebula that inferred dust temperatures of 30–40 K (Harvey et al. 1979; Ghosh et al. 1988).
The warmer 220 and 80 K components that dominate at shorter wavelengths absorb and re-emit the remaining 35% of the IR luminosity, corresponding to only 20% of the total stellar luminosity. As noted earlier, the 220 K population may be erroneous, as would be its associated dust mass estimate, since the shorter mid-IR wavelengths may be dominated by diffuse PAH emission. However, the 80 K component probably represents warm grains surviving in the interior of the H ii region. Throughout most of the nebula, they are heated stochastically by Ly photons, and therefore, ultimately by Lyman continuum photons (see §4.1). Close to the O stars, direct heating of dust by stellar UV continuum radiation may also be important. These 20-25 m emitting grains are often seen as filamentary structures seen in the MSX band-E image (Fig. 1b); they may reside in dense swept-up shells where the O star winds confront the phoevaporative flows from ionization fronts.
3.2 The Mass Budget
The cool 35 K component dominates the mass of emitting dust in the nebula. While the warmer components make a substantial contribution to the luminosity, they are irrelevant to the total dust mass. The total mass revealed by thermal dust emission is about 9600 M⊙ (Table 2). The uncertainty in this dust mass is large, perhaps of order 20% because of potential errors in background subtraction and uncertain grain properties.444The mass estimate is dominated by the 35 K component in Fig. 2). This component can’t be hotter or more luminous, but there could be additional mass hidden in cool grains that we are not sensitive to because we do not yet have a global estimate of the submm luminosity of the nebula, as noted earlier.
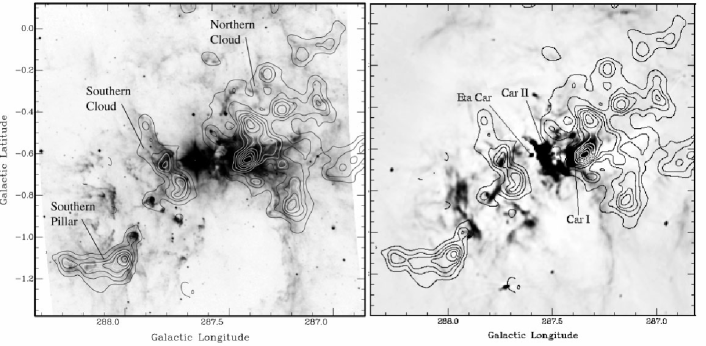
The total mass of molecular gas in the Carina region is estimated to be 6.7105 M⊙ from the Columbia CO survey of the Galactic plane (Grabelsky et al. 1988). The relevant molecular mass is even less than this, since this value was estimated over a region larger than the box in Figure 1. Yonekura et al. (2005) give a smaller value of 3.5105 M⊙. As explained below in §4, we favor an interpretation where the mass traced by the far-IR dust emission is probably mixed-in with warm atomic gas in PDRs behind ionization fronts because it has a different spatial distribution than the CO clouds (Fig. 3). Thus, the gas:dust mass ratio inferred from comparing molecular gas and dust is erroneous because the warm emitting dust and the CO gas trace different components of the nebula.
Instead, if we assume that the far-IR emission from 35 K dust traces warm atomic gas in PDRs, then a typical gas:dust mass ratio of 100 there would indicate a total gas mass of 106 M⊙. This, in turn, would indicate that the warm gas in PDRs dominates over molecular clouds in the total mass budget of the nebula. Brooks et al. (2003), however, find that most of the gas-phase carbon is in CO, so a large reservoir of additional mass may be present that is not traced by the warm 35 K dust. The gas currently in the molecular phase is less than about one-third of the total mass budget. Thus, adding the molecular and PDR mass together, about 1-2106 M⊙ in the nebula may still be available for further star formation, providing that it can be swept up into dense enough clouds (see §4.4).
What is the mass ratio between this gas and the stars in Carina? A complete stellar census is not yet available, but perhaps we can draw preliminary conclusions by scaling from a well studied region like the Orion Nebula Cluster (ONC). Hillenbrand & Hartman (1998), for example, find a total number of stars of 2260 and a total stellar mass of 1800 M⊙ for members of the ONC. Now, the number of stars in the ONC with masses above about 10 M⊙ is 6 and the number of O-type stars is 2, while for the first-generation exposed clusters in Carina the corresponding numbers are 127 and 70 (Paper I). This is certainly not a complete census for Carina since there are many early B stars not included in Paper I, and some O stars may still be obscured (e.g., Sanchawala et al. 2007). Scaling from Orion, then, we find likely values for the total number of first-generation stars in Carina of about 5-8104, harboring a total stellar mass of 4-6104 M⊙. Errors may be as much as a factor of 2 with this crude method, but are likely to be an underestimate if wrong. We undertook a more detailed analysis where we scaled the Trapezium mass function of Muench et al. (2002) so that the slope at high masses agreed with a mass function from the spectral types in Paper I, and then integtrated over a range of 0.08-150 M⊙ to get the total mass, but this produced similar results with similar uncertainty. In any case, the total stellar mass in the first generation stars in Carina is securely above 2104 M⊙, placing it among the most massive stellar groupings in the Galaxy. This is in agreement with its large Lyman continuum luminosity.
It would appear from this value for the total stellar mass that the global star formation efficiency in Carina has been less than 10%. However, two important considerations suggest that this would likely be a severe underestimate, and that the star formation efficiency of the first generation clusters could be as high as 30-50%. First, the total gas mass is derived for a very large region, and likely contains mostly pristine gas that did not participate in the formation of the first generation star clusters like Tr14 and 16. The mass of gas which has been expelled from the inner region of the nebula that was formerly the molecular cloud core is unclear, but it is probably a small fraction of the total nebular mass. Second, the stellar census is surely incomplete, because it ignores the vast number of second generation stars that are now forming or have recently formed around the periphery of the nebula, which may be comparable to the first generation. An ongoing analysis of Spitzer data (Smith et al., in prep.) suggests that the South Pillar region alone contains well over 104 new stars. Thus, a census of this younger second generation will be quite interesting.
3.3 The Kinetic Energy Budget, Diffuse X-rays, and a Previous Supernova?
If we take the mass of warm atomic gas inferred in the previous section at face value as the dominant mass component, we can evaluate the total kinetic energy budget of the nebula. We found a total gas mass of 106 M⊙ from the cool dust mass for an assumed normal gas:dust mass ratio of 100.
High-resolution spectroscopic observations of ionized gas in Carina over the past decades have repeatedly established a ubiquitous line splitting of 35–40 km s-1 across the entire region (e.g., Meaburn et al. 1984; Azcarate et al. 1981; Deharveng & Maucherat 1975; Walborn & Hesser 1975; Smith et al. 2004a). If we then take 20 km s-1 as representative of the bulk expansion velocity of the developing superbubble cavity (Smith et al. 2000), the implied total kinetic energy of the nebula would be of order 81051 ergs. This agrees well with the value of 91051 ergs estimated on different grounds by Smith et al. (2000); it was the energy needed to sweep up the cavity to the observed size assuming a homogeneous ambient medium.
Although the large kinetic energy budget of the nebula allows for input from one or more past supernovae, there is no need to invoke a previous supernova to account for it. The present kinetic energy of the nebula we derive here is only 30% of the available kinetic energy of 2.61052 ergs supplied by stellar winds throughout the 3 Myr lifetime of the nebula (Paper I). Thus, the observed kinetic energy budget gives no evidence to alter the view that the Carina Nebula is in an early phase of its expansion still dominated by stellar winds and radiation pressure.555There is one interesting caveat here, however. Recent studies of UV spectra of O stars (e.g., Fullerton et al. 2006; Bouret et al. 2005) suggest that their winds are highly clumped and that their mass-loss rates may be lower than the rates adopted in Paper I, which were from estimates based on moderate clumping factors (Repolust et al. 2004). If the mass-loss rates are indeed reduced much further than assumed in Paper I, then the input mechanical energy from stellar winds may become comparable to the observed expansion energy of the nebula. This is supported by the lack of any evidence for significant non-thermal radio continuum emission from the nebula. It is also in agreement with Brooks et al. (2003), who find that stellar winds alone can account for the kinematics of the molecular-line data. In that case, the diffuse soft X-ray emission in Carina (Seward et al. 1979; Seward & Chlebowski 1982) could arise from a shock between stellar winds expanding from O stars in Tr14 and Tr16 as they collide with the evaporative PDR flow from the surrounding molecular clouds. The intricate structure of the evaporating pillars would make the geometry of this shocked material very irregular, causing strong variations along adjacent lines of sight, while still being present across the whole region. Thus, it is plausible that the high-velocity absorption components (e.g., Walborn et al. 2007, 1984; Walborn & Hesser 1975; Danks et al. 2001) may result within these wind interaction regions as well.
3.4 Tracers of the Ionized Gas
The total flux of free-free radio continuum emission is often taken as a diagnostic of the total Lyman continuum luminosity of an H ii region, because it avoids potentially large uncertainties in extinction. The total number of H-ionizing photons absorbed by the gas can be expressed as
| (2) |
where is the assumed electron temperature in units of 104 K, is the observed flux density in Jy at frequencey , and is the distance in kpc. In equation (2), we have assumed that the n(He)/n(H) abundance is 0.1, that the volume of the He+ region is half of the H+ region, and that the fraction of He recombination photons that can ionize H is =0.65 (e.g., Simpson & Rubin 1990). In that case, the factor (1+He+/[H++He+])-1 is 0.969; it would be 0.939 with equal volumes for the He+ and H+ zones, changing our value for QH by an insignificant 3%.
From Table 1, we measure a total 3.4 cm (8.82 GHz) flux of =1430 Jy for the whole nebula, integrated over the large rectangular area in Figure 1. Assuming Te=104 K in equation 2, this flux translates to a total Lyman continuum photon luminosity of 6.91050 s-1. This can be compared to our estimate in Paper I of the total Lyman continuum output of the known OB stars in Carina of =9.11050 s-1. Thus, it would appear from this analysis that roughly 25% of the ionizing photons may be able to leak out of Carina.666Note, however, that this is the observed value only at the present time, when the dusty Homunculus nebula and Car’s dense wind quench the UV output of Car and its putative companion (see Paper I). In the recent past (before 1843), the total ionizing flux output of the stars in Carina may have been as high as =11.51050 s-1 (Paper I). The ionizing output in this previous state may be relevant even to present observations, since the recombination timescale in the outer parts of the nebula would be about 50 yr for a typical electron density at ionization fronts of a few 103 cm-3 (Smith et al. 2004b), while the light travel time to some outer parts of the nebula is comparable. This escape fraction will need to be larger if there remains a significant number of hot stars in Carina that are obscured at visual wavelengths and were not included in the census in Paper I.
Also using radio continuum observations, Brooks et al. (2001) estimated the number of H-ionizing photons absorbed locally by the radio sources Car I and Car II (associated with Tr14 and Tr16, respectively). Comparing these values to the expected Lyman continuum output from each cluster in Paper I, it appears that Car I absorbs 5.5% of Tr14’s ionizing radiation, while Car II absorbs much less than 1% of the ionizing photons from Tr16. This tells us that the vast majority of ionizing radiation from these clusters escapes to large distances in the nebula. It also means that Tr14 is more involved in dense gas than Tr16, providing another clue that it may be somewhat younger than Tr16.
The total H luminosity that escapes the nebula (corrected for the average interstellar extinction but not local non-uniform extinction from dark clouds within the nebula) is about 105 L⊙, and the escaping luminosity in the [O iii] 5007 line is about 3104 L⊙. This H luminosity is about 1/3 that of 30 Doradus (Kennicutt 1984).
In studies of extragalactic H ii regions and star forming galaxies, the total H luminosity is also used to derive the number of hydrogen ionizing photons. Following Kennicutt (1998),
| (3) |
where LHα is the luminosity in the H emission line. For our measured value of L105 L⊙ for the total H line luminosity in Carina, we then have 31050 s-1. Thus, with standard assumptions the observed H flux appears to significanty underestimate the total Lyman continuum flux as measured from the radio continuum (about 40–50%), and it severely (factor of 3) underestimates the expected Lyman continuum luminosity from known O stars (Paper I). Perhaps this is because the H line suffers from severe non-uniform extinction. The required average extinction would be an additional 0.9 mag. We corrected the H flux for the small amount of average interstellar extinction toward Carina, but not for local extinction; we will see below in §4.2 that non-uniform local extinction is severe.
The ratio of the global [O iii] 5007 luminosity to that of H for the whole nebula is about 0.3. The observed and dereddened ratio of [O iii] 5007 to H in the brightest inner parts of the nebula is 1 (Smith et al. 2004b). This means that [O iii] is more centrally concentrated than H, and again, may be more heavily absorbed there due to non-uniform extinction, which is in fact the case as we discuss later in §4.2. This suggests caution when interpreting [O iii]/H ratios in extragalactic H ii regions. As noted in Paper I, the large ionizing photon luminosity places Carina among the most extreme star forming regions in our Galaxy, such as W49 and NGC3603, although not quite as extreme as the Arches cluster in the Galactic center or 30 Dor.
4 LARGE-SCALE MULTIWAVELENGTH MORPHOLOGY
4.1 Dust Distrubution
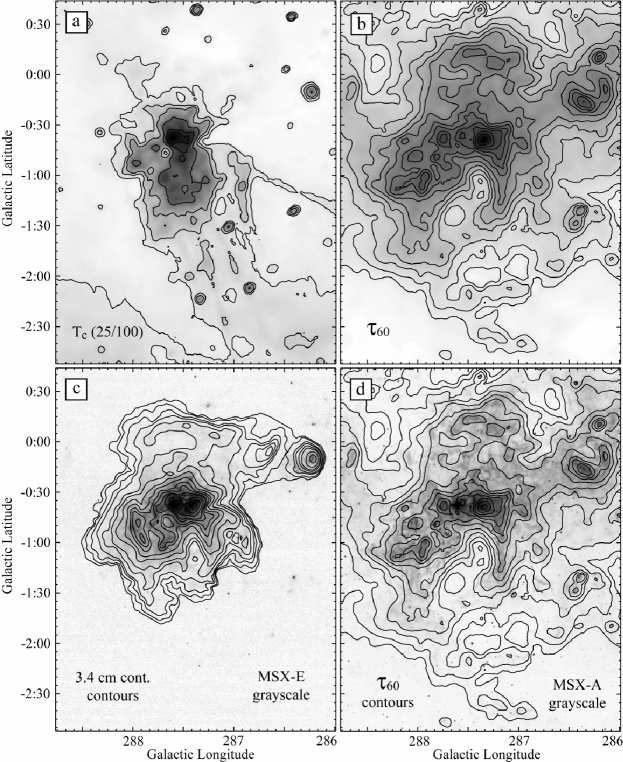
Figures 4 and 4 show the far-IR dust color temperature and 60 m emitting optical depth, respectively. The temperature map is made from a ratio of the 25 and 100 m IRAS images, while the optical depth map uses this temperature map and the 60 m IRAS image. As noted earlier, we did not use deconvolved images with enhanced resolution, because such images can lead to erroneous features in ratio images, and we are interested primarily in the large-scale distribution (note that we smoothed the 25 m map to match the spatial resolution of the longer wavelength data). For each pixel, the dust color temperature and optical depth were calculated in the usual way from ratio images (e.g., Smith et al. 2003b). However, we caution that the numerical values of T and in the maps are not necessarily the actual temperature or optical depth of grains in the nebula, since each line of sight may contain multiple grain populations at different temperatures. For example, the SED in Figure 2 shows that the 25 m flux is dominated by warm 80 K grains across much of the nebula, whereas the 100 m flux is dominated by cooler 35 K dust. Therefore, contour levels in Fig. 4 are average values, but are still useful in assessing trends in relative dust temperature and column density.
We find an excellent spatial correlation between the large-scale distribution of radio continuum and the 21.3 m Band E emission from MSX, shown in Figure 4c. This was noted on smaller scales by Rathborne et al. (2004) and Cox (2005) as well. This is consistent with the interpretation that warm grains in the interior of H ii regions are intermixed with and heated in situ by emission from the ionized gas itself. For the case B recombination that prevails in most H ii regions, Ly photons trapped in the nebula resonantly scatter many times before being absorbed by dust. Spitzer (1978) showed that for graphite grains bathed in ionized gas with 103 cm-3 and roughly Solar metallicity, the equilibrium temperature from the balance of absorption of trapped Ly photons and IR emission would be about 80 K. This is, coincidentally, the same temperature we derive for the warm component that dominates the SED at 20–30 m (Fig. 2). By comparison, a simple estimate indicates that grain-gas collisional energy gain or direct heating by stellar photons is less by at least two orders of magnitude over most of the nebula, although direct UV continuum heating may become important close to the O stars. Some grains in Carina show IR emission features similar to SNRs like Cas A (Chan & Onaka 2000), but there appears to be no need to invoke grain heating by a recent supernova to explain the luminosity or temperature of the warm grains.
In general, these results indicate that diffuse 20–30 m emission that occupies the interiors of similar shell structures can be taken as an excellent tracer of dust that is mixed with dense ionized gas in H ii regions. The association of warm grains with ionized gas explains the red emission in the interior of the nebula in the color MSX image in Figure 1, while PAH emission from the surfaces of molecular clouds is seen in blue/green at larger distances from the center. This pattern clearly holds true in the adjacent region NGC3324 as well (Fig. 1b), as does the good correlation between 20-25 m emission and radio continuum (Fig. 4c). This interpretation is probably applicable to H ii regions in general. Such features are common in 21.3 m MSX data or in 24 m images taken by Spitzer throughout the Galactic plane (e.g., Churchwell et al. 2006). It would be interesting to see if this type of feature is less obvious at lower metallicity, where the dust:gas ratio is lower.
As interesting, perhaps, is the near-perfect correlation over large scales between the 60 m optical depth and PAH emission shown in Figure 4, ignoring differences in spatial resolution between IRAS and MSX images. The only instances where this correlation is not obeyed are for point sources like Carinae, embedded protostars, and cool giants in the field. However, the 8.6 MSX Band-A emission from these unresolved sources is primarily due to continuum emission from warm circumstellar grains rather than PAH emission. This provides spatially-resolved confirmation that the cool 30–40 K dust that dominates the far-IR luminosity measured by IRAS – tracing the majority of the nebular mass – resides primarily in warm atomic zones in PDRs heated by the FUV radiation field, and not in colder molecular cloud cores. (The 100 m optical depth map is essentially the same as the 60 m optical depth.) The PAH and warm dust distributon is significantly different from that of the molecular cloud cores when examined at the level of detail seen in Figure 3. On larger size scales where the structure of PDRs is unresolved, The molecular gas and PAH+dust emission do trace one another because the PAH mission comes from the surfaces of molecular clouds. This similar structure on large sizes is due to the clumpy distribution of the gas, allowing FUV radiation to penetrate to large radii in between the clumps. This view is compatible with the large scale distribution of high density molecular gas seen in CO(43) and PDR emission seen in [C i] at 610 (Zhang et al. 2001).
Earlier we estimated that the difference between IR luminosity and the inferred stellar FUV luminosity in Paper I means that about 20% of this FUV luminosity escapes the nebula. From the large-scale distribution of dust in Figure 4, this may be largely an effect of the asymmetric and clumpy geometry. There is a large hole toward southern Galactic latitudes where a significant fraction of the FUV radiation may escape. It is even apparent in Fig. 4 that higher dust temperatures protrude in that direction.
4.2 Extinction Distribution and 3D Geometry
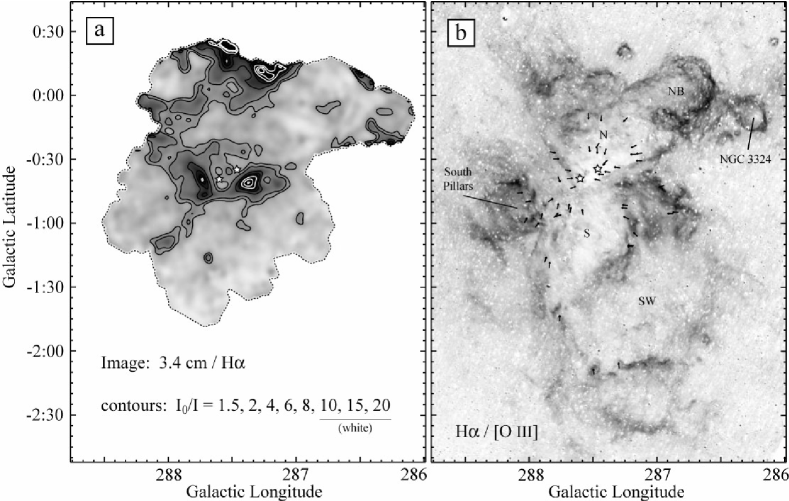
Figure 5 shows an image of local variations of extinction across the Carina Nebula, derived from a flux ratio image of 3.4 cm radio continuum (Fig. 1) to a smoothed version of the H image. The radio free-free emission and the intrinsic H emission should have the same spatial distribution, so dark regions in the grayscale image correspond to regions of higher visual-wavelength extinction. Thus, we take the radio image as representing an intrinsic surface brightness map of the nebula, , whereas H suffers significant extinction from dust at visual wavelengths, causing the apparent surface brightness to be very different. When we normalize these maps to have the same value in the brighter and less obscured regions of the nebula (where has a minimum value, set to 1), regions where ionized gas suffers substantial absorption from foreground clouds have larger values of . In all cases, the values of shown in Figure 5 may be underestimates, because this map gives the extinction averaged over the 26 beam of the 3.4cm image, whereas higher resolution optical images show complex small scale structure. The high values of near the top of Fig. 5 may be caused by low emission levels near edges of the field.
In the central regions of the nebula, the distribution of local extinction follows the general spatial distribution of the most prominent CO emission as seen in Figure 3, as well as that of the bright 8 m PAH emission at molecular cloud surfaces. The main concentrations of molecular gas in the Northern Cloud, the Southern Cloud, and the Southern Pillar are all clearly seen as local maxima in the extinction map in Figure 5. The Southern Pillar seems less prominent in the extinction map than in the CO map, suggesting that the bulk of the dust and molecular gas there may be behind much of the ionized gas along the line of sight. Some of the other pillars are known to be on the far side of the nebula as well, based on their line-of-sight extinction patterns or kinematic properties (Smith et al. 2004a, 2005b).
Part of the V-shaped dark dust lane that crosses the center of the nebula can be seen as a bridge between the Northern and Southern clouds in the extinction map, whereas this bridge is not clearly seen in the CO map. This indicates that the middle parts of this dust lane have fairly low column density compared to other parts of the clouds, with 2–3, corresponding to 6563 Å extinction of 0.75–1.2 mag. However, they figure prominently in optical images because they are on the near side of the nebula.
The strongest regions of extinction, corresponding to the Northern and Southern clouds, have peak values for of roughly 10 and 20, respectively, corresponding to extinctions at 6563 Å of 2.5 and 3.3 magnitudes. These regions suffering high extinction correspond to areas of strong intrinsic emission. This non-uniform extinction that blocks some of the brightest H emission in the center of the nebula is the qualitative explanation for why QH derived from the total H luminosity is smaller than QH derived from the radio continuum. Namely, even though we corrected the total H luminosity for interstellar extinction to Carina using average values of E(B–V) derived from optical spectra (e.g., Smith et al. 2004b), this method did not correct for the non-uniform extinction in the nebula, which is severe in some places. This is because the optical spectra one uses to derive the average extinction are dominated by the emission from bright and relatively unobscured regions. This may present a potential problem for interpreting observations of very distant unresolved H ii regions.
4.3 Large Scale Flows, Shocks, and Bubbles
Figure 5 shows an image of the flux ratio of H to [O iii] 5007 across the entire Carina Nebula. Ignoring obvious artifacts from bright stars, this gives an excellent view of the large-scale shell structures that define the boundaries of the nebula. Aside from the South Pillar region (see Smith et al. 2000), we draw attention to four main cavities/shells in Carina. The large cavities labeled N and S in Figure 5, seen to the north and south of the main Tr14 and Tr16 clusters, are the two halves of what appears to be the main bipolar cavity of the nebula. Additional shells are the northern blister (NB) and the large south-west shell (SW). There are additional shells as well to the SW direction, as noted by Smith et al. (2000). These shells are reminiscent of the main structural components of 30 Dor (e.g., Wang & Helfand 1991).
OB stars in Carina are distributed around the region, unlike concentrated super star clusters such as NGC3603 and the Arches cluster in the Galactic center (Crowther & Dessart 1998; Figer et al. 1999). However, we can gain some insight into which star clusters blew which bubbles by examining the detailed morphology of the nebula. Much as the proplyds in Orion all point toward C Ori (e.g., Bally et al. 2000), Carina contains many dust pillars and cometary clouds, like those discussed by Smith et al. (2003a; 2004b), pointing toward the source of ionization or stellar winds that shaped them. Using unambiguous head-tail structures and well-defined dust pillars as tracers, we measured coordinates and position angles for several “directional indicators” throughout the Carina Nebula as seen in H images from the same dataset used by Smith et al. (2003a). For each of these directional indicators, we plot an arrow in Figure 5 over the H/[O iii] image of the nebula. We find that arrows in the southern S shell, including the South Pillar region, generally point toward Carinae and Tr16 (the lower left of the two stars in Fig. 5), as do most features along the V-shaped dust lane that bisects the nebula. This includes a few objects that point toward Tr16, even though they are projected along the line of sight to Tr14 (see Smith et al. 2003a). Objects within the N bubble, on the other hand, point predominantly toward Tr14. Thus, it is clear that Tr16 has more influence on the southern parts of the nebula, while the younger Tr14 cluster currently dominates the excavation to the north.777There are, of course, some localized exceptions to these general trends due to projection effects along the line of sight, especially in the brightest inner regions of the nebula. A more detailed examination of such directional indicators and locations of nearby OB stars may illuminate the role of individual stars in shaping their surroundings on various size scales, compared to integrated effects from the larger clusters.
The feature labeled NB in Figure 5 is strange. It is a nearly circular shell-like region, but does not appear to contain any bright OB stars at its center that drive its expansion. Yet, it has a very high [S ii]/H ratio (not shown here, except in the color image in Fig. 1a) that may indicate shock excitation (e.g., Hartigan et al. 1999). We speculate that NB may mark a position where a blister is forming; as the main front advances toward northern Galactic latitudes, it may penetrate through a localized cavity, injecting hot plasma from the H ii region’s interior through the hole. Consequently, a blister at the edge of the H ii region will inflate and the reservoir will eventually pop. The NB feature may be a young version of the larger bubble to the south-west (SW in Fig. 5), which appears to have already broken out to larger distances. The detailed kinematics of these features have not yet been investigated.
4.4 Large-Scale Triggered Star Formation and Carina’s Future Prospects
The South Pillars and other adjacent regions of dense nebular material around the periphery of the Carina Nebula (Smith et al. 2000) show clear signs of feedback from massive stars at the center of the nebula, with numerous dust pillars that point inward (Fig. 5; see also Smith et al. 2000; Walborn et al. 2002; Rathborne et al. 2002). The morphology in images (Fig. 1) gives the impression that the remnants of a giant molecular cloud are being overrun and shredded by the advancing stellar winds and UV radiation from the stars in Tr16 and Tr14 (we do not know what, if anything, triggered the formation of the first generation clusters Tr14 and Tr16). Whether or not the formation of the second generation has been triggered by first generation feedback is not immediately obvious, because one cannot determine from morphology alone whether the advancing front triggered the formation of stars, or if it is simply uncovering dense clumps that would have formed stars anyway. However, we explain here how the scale and character of star formation in Carina may help resolve this ambiguity.
There are several indications that many of the new second-generation stars forming in these South Pillars have ages of 105 yr or less. The clearest evidence so far comes from young massive outflows and young clusters. The infamous HH666 jet (Smith et al. 2004a) is a parsec-scale outflow from one of these pillars, showing signs of powerful bursts of episodic mass loss, hinting at a very early evolutionary phase undergoing FU Orionis outbursts (Calvet et al. 2000). The embedded class I phase implied by the SED of its driving source HH666IRS is only expected to last 105 yr. Similarly, most of the stars in the spectacular “Treasure Chest” cluster (Smith et al. 2005b) found in another pillar appear to lie on isochrones with ages 105 yr, and the cluster itself has one of the highest disk fractions known among any embedded cluster. There are several other IR sources and young clusters embedded in pillars in Carina (Rathborne et al. 2002, 2004) that have not been studied as thoroughly, but are likely to show similar signs of youth.
This recent star formation in the South Pillars is seen across a region more than half a degree (more than 20 pc) in spatial extent. The sound crossing time for this region is 18 to 20 Myr or more at a speed of 1 km s-1 in molecular clouds. In fact, there are (less vigorous) signs of the youngest phases of star formation around the entire periphery of the Carina Nebula cavity across a much larger region of several degrees on the sky (Smith et al. 2000).
The earliest phases of star formation are seen to exist simultaneously across a region where the sound crossing time is more than an order of magnitude longer than the duration of these earliest phases. Therefore, an external agent is required to synchronize these events. The signal for cloud cores to collapse simultaneoulsy must propagate at a speed much faster than the sound speed in a molecular cloud. Since these sources are all seen near the ionized cavity walls and PDRs of the Carina Nebula, the advancing ionization-shock front is the likely culprit. Alternatively, if star formation were constant and ongoing across the whole Carina Molecular Cloud complex, we might also expect the youngest population to appear as if it were synchronized (there would be a range of ages present, which would always include some fraction of stars in the youngest observable phases). However, in that scenario, the stars in the youngest phases should be distributed randomly about the cloud — they should not be found preferentially near the heads of dust pillars that are facing inward to the massive stars in the core of the nebula, as observed. Thus, it is the unique combination of suggestive morphology and the large spatial scale across which this occurs in Carina that provides a strong case that these second-generation stars have been directly triggered.
On a global scale, the relative importance of this triggered second generation compared to the first generation stars in Tr14 and Tr16 is not yet clear. The most massive star currently known in this second-generation South Pillar region is CPD–592661, which is an O9 V star at the center of the Treasure Chest cluster (Smith et al. 2005b; Walsh 1984). The pillar containing the Treasure Chest cluster is the brightest of the South Pillars at thermal-IR to mm wavelengths (Smith et al. 2000; Rathborne et al. 2002; K. Brooks et al., in prep.). Yonekura et al. (2006) have identified a few additional molecular cores that may be good candidates for sites of massive star formation. While obscured regions at the periphery of Carina may hide additional late O and early B stars (e.g., Sanchawala et al. 2007), it is unlikely that the South Pillars have recently given birth to large clusters of very massive early O-type stars comparable to Tr14 and Tr16. Thus, as star formation cascades to preferentially lower masses, it would appear to be “petering out” in this second generation that is triggered by stellar winds and radiation from the first one. If true, then the current ongoing star formation is adding mostly low- and intermediate-mass stars to the fledgeling OB association, but not very massive stars. The mass functions in the two regions may be different, but would combine to form the average mass function of the entire OB association. Whether or not this has a significant influence upon the global initial mass function (IMF) from the region depends on the total mass of stars added in the second generation, which has not yet been assessed. Detailed study of this newly-recognized second generation in the South Pillars is just beginning, but Carina provides a unique laboratory to investigate this phenomenon.
How long this apparent gentle cascade toward lower-mass star formation continues into the future is another matter, however. The massive object Carinae gives us a constant reminder that the most massive stars in the region are just now reaching the ends of their lives. Its impending demise will be followed by a dozen or so additional supernovae in the next million years, when the WNL, O3, and O4 stars in Carina explode (Paper I). This will suddenly inject 1052 to 1053 ergs of mechanical energy into the region, which is likely to sweep up all remaining nebular mass into dense clouds and trigger further star formation on a massive scale. In §3 we estimated that the available reservoir of nebular mass is at least 1–2106 M⊙, which is enough to rejuvinate massive star formation in the region. At the present time, the majority of the nebular mass is untapped for star formation because it is in the atomic gas phase in PDRs that are warmed by UV radiation from the central clusters. Less than 30-40% is in molecular clouds that can form stars. In this way, UV emission currently regulates star formation.
However, after the most luminous stars explode, the UV radiation field will drop precipitously, because it is the few most massive members that dominate the FUV luminosity (Paper I). Their supernova shocks will sweep this mass into a dense shell that will no longer be warmed by a strong UV field, and should therefore be more efficient at forming giant molecular clouds and massive stars. Essentially, the disapperance of the UV source plus the shock waves that sweep up the gas conspire to enhance the formation of giant molecular clouds. When this conspiracy unfolds, the new generation of massive star formation is likely to produce a ring of OB clusters around the fossil OB association left from Tr14 and Tr16 — much like the Gould’s Belt and Lindblad ring around the fossil Cas-Tau association in the Solar neighborhood (Blaau 1991). Thus, the Carina Nebula may provide us with a unique snapshot of an earlier phase in the history of our part of the Galaxy. Specifically, the current phase of second-generation star formation in Carina may be directly relevant for understandiing the origin of young stars near the Sun which reside in the interior of Gould’s Belt.
There is more to this tale as well. When these multiple supernovae from Car and its siblings occur, the young stars in the second generation at the periphery of the Carina Nebula will have their disks and envelopes pelted by supernova ejecta. This will happen soon. The supernova ejecta will include short-lived radioactive nuclides such as 60Fe and 26Al, which are found in abundance in meteorites in our Solar System, indicating that the Sun formed in close proximity to a supernova (Desch & Ouellete 2005; Hester et al. 2004; Tachibana & Huss 2003). An additional clue that the Sun formed close to massive stars is the clear outer edge of the Kuiper belt (Allen et al. 2001; Jewitt et al. 1998), since truncated outer edges are a common property of externally-evaporated disks in H ii regions, such as the famous objects seen in silhouette in the Orion Nebula (Bally et al. 2000; McCaughrean et al. 1998; McCaughrean & O’Dell 1996; Smith et al. 2005a). However, regions like Orion with protoplanetary disks existing close to just a single young O-type star also have significant obstacles to acquiring these short-lived radioactive nuclides. Namely, while these first-generation stars may be very close to the supernova, they need to wait 3 Myr or more (about 10 Myr in the case of Orion) before the massive star explodes, during which time their gaseous disks will be mostly evaporated. The stars with protoplanetary disks that are close enough to C Ori also represent a tiny (1%) fraction of the surrounding cluster.
These difficulties are alleviated in two important ways in the South Pillars of Carina and similar regions of ongoing star formation at the borders of giant H ii regions. First, this second generation of stars that has been triggered by the first is located within a few parsecs of hot massive stars that are already poised to explode, so there will be no significant delay between the formation of these second-generation stars and the arrival of ejecta from the supernovae. Because the second generation stars are still young and have large protoplanetary disks, they are able to cast a wider net to trap the short-lived radioactive nuclides, as in the “aerogel” model of Desch & Ouellete (2005). Second, instead of just one supernova like in Orion, Carina will have dozens of supernovae in just a few million years (there were initially 70 or more O type stars in Carina; Paper I). These two properties make a place like the South Pillars a much more likely analog of the cradle of the Solar System than Sun-like stars forming in first generation clusters (like the protoplanetary disks in the Trapezium of Orion, for example). The probability of this happening depends in part on the 60Fe yield of SNe from very massive stars like Carinae, which is poorly constrained (e.g., Smith et al. 2007). It also depends on the veracity of star formation in regions like the South Pillars, and is of considerable interest for understanding our own origins. For this reason, detailed measurements of the disk fraction, mass function, total mass, and other properties of stars forming in the South Pillars is an important goal for future observational studies.
5 SUMMARY AND CONCLUSIONS
We have investigated the energy budget and the global properties of the Carina Nebula on the largest scales of 3° (across 100–120 pc). Furthermore, we have compared these large-scale properties integrated over the whole nebula with the census of energy input from OB stars in Paper I (Smith 2006a). (Note that in all estimates here, the radiative energy input and the escaping IR luminosity of the evolved star Carinae have been excluded, because Car’s own circumstellar dust shell processes most of its bolometric luminosity.) The main conclusions are summarized here.
1. The integrated IR luminosity of the Carina Nebula measured in IRAS and MSX data is 1.18107 L⊙. Dust processes about 50–60% of the known radiative luminosity of the OB stars in Carina measured in Paper I.
2. From the integrated 3.4 cm radio continuum flux, we infer a total Lyman continuum photon luminosity of QH=6.91050 s-1. This is 75% of the ionizing photon luminosity we derived from a census of Carina’s known OB stars in Paper I. Some of the Lyman continuum must therefore escape along with the stellar bolometric luminosity or must get absorbed by dust within the H ii region.
3. Using the H luminosity as a diagnostic of the ionizing flux, we measured a smaller value of QH=31050 s-1. This is less than half of that inferred from the radio continuum and 1/3 of the total from stars. The H luminosity is significantly absorbed by strong non-uniform extinction that is ignored in a standard average reddening correction.
4. Warm dust at 80 K, which dominates the integrated SED at 20–30 m, resides in the interior of the H ii region cavity. These are probably large grains mixed with ionized plasma that are heated in situ by trapped Ly from the ionized gas. This warm dust contributes about 1/3 of the total IR luminosity, but contains a negligible fraction of the total dust mass. Based on the similarity of the radio continuum and MSX Band-E images, we find that diffuse 20-25 m emission is an excellent tracer of warm dust mixed with ionized gas inside H ii regions.
5. Cooler dust at 30–40 K dominates the far-IR emission, the total IR luminosity, and the total dust mass of the nebula. From the 35 K component fit to the SED, we measure a total dust mass of 104 M⊙, indicating a likely gas mass associated with this dust of 106 M⊙ or more.
6. With this total mass and the ubiquitous 20 km s-1 expansion seen across the nebula, we infer a total kinetic energy in moving gas of at least 81051 ergs. This is only 30% of the available mechanical energy from stellar winds during the 3 Myr lifetime of the nebula. Therefore, on energy grounds, there is no need to invoke a previous SN to explain the kinematics of the region.
7. We find a near-perfect correlation between the 60 m optical depth and PAH emission seen in the MSX band-A image. The only violations of this correlation are point sources with warm circumstellar dust. The PAH emission and 60 m optical depth have a different spatial distribution than the largest molecular clouds traced by CO emission. The total gas mass traced by 35 K dust in PDRs outweighs the total gas mass in molecular clouds. Since these two components have different spatial distributions, we conclude that most of the mass in the nebula resides in atomic gas in PDRs instead of dense molecular clouds, and is therefore not currently participating in star formation. However, the atomic and molecular gas added together provide a substantial reservoir of 1–2106 M⊙ for future star formation.
8. The large sound crossing time of several Myr for the South Pillars is much longer than the 105 yr duration of the earliest phases of star formation, seen to be synchronized throughout the region. This provides a strong case that much of the ongoing star formation in Carina is indeed triggered, instead of just occurring spontaneously and then being uncovered by the advancing ionization front.
9. The triggered second-generation of star formation appears to lack the same scale of high-mass star formation that gave rise to the massive first-generation clusters like Tr14 and Tr16. This implies that star formation triggered by stellar winds and UV radiation has a cascading effect, biased toward lower masses. Determinig if this is indeed true and how it affects the IMF will be an important aspect of future research in this region. We suspect that the large number of sequential supernovae to occur in the near future may conspire with the lack of FUV radiation from those same stars to rejuvinate massive star formation, given the large reservoir of atomic and molecular mass still available.
10. Regions like the South Pillars, where a second generation of young stars has been triggered at the periphery of a giant H ii region, will soon be bombarded with supernova ejecta. We argue that these are the best candidates for analogs of the type of environment where the Sun formed, given current constraints from meteoritic evidence of short-lived radioactive nuclides. Dozens of sequential supernovae in a short time plus the lack of a delay time between their birth and the arrival of the supernova ejecta allow for more efficient injection of short-lived radioactive nuclides in these second-generation triggered regions, as compared to environments like the Trapezium in Orion.
ACKNOWLEDGMENTS
We thank the ATNF Distinguished Visitor Program, providing us with an opportunity to collaborate in person in Australia. We acknowledge fruitful discussions with John Bally, Hans Zinnecker, Ed Churchwell, Gus Muench, Norm Murray, and Jonathan Williams. Partial support was provided by NASA through grant HF-01166.01A from the Space Telescope Science Institute, which is operated by the Association of Universities for Research in Astronomy, Inc., under NASA contract NAS 5-26555.
References
- [] Allen, D.A., & Hillier, D.J. 1993, PASA, 10, 338
- [] Allen, R.L., Bernstein, G.M., & Malhotra, R. 2001, ApJ, 549, L241
- [] Arendt, R.G., Dwek, E., & Moseley, S.H. 1999, ApJ, 521, 234
- [] Azcarate, I.N., Cersosimo, J.C., & Colomb, F.R. 1981, Rev. Mex. AA, 6, 269
- [] Bally, J., O’Dell, C.R., & McCaughrean, M.J. 2000, AJ, 119, 2919
- [] Blaauw, A. 1991, in The Physics of Star Formation and Early Stellar Evolution, ed. C.J. Lada & N.D. Kylafis (Dordrecht: Kluwer), 125
- [] Bouret, J.C., Lanz, T., & Hillier, D.J. 2005, A&A, 438, 301
- [] Brooks, K.J., Burton, M.G., Rathborne, J.M., Ashley, M.C.B., & Storey, J.W.V. 2000, MNRAS, 319, 95
- [] Brooks, K.J., Cox, P., Schneider, N., Storey, J.W.V., Poglitsch, A., Geis, N., & Bronfman, L. 2003, A&A, 412, 751
- [] Brooks, K.J., Garay, G., Nielbock, M., Smith, N., & Cox, P. 2005, ApJ, 634, 436
- [] Brooks, K.J., Storey, J.W.V., & Whiteoak, J.B. 2001, MNRAS, 327, 46
- [] Brooks, K.J., Whiteoak, J.B., & Storey, J.W.V. 1998, PASA, 15, 202
- [] Buxton, M., Bessell, M., & Watsson, R. 1998, PASA, 15, 24
- [] Calvet, N., Hartmann, L., & Strom, S.E. 2000, Protostars & Planets IV, 377
- [] Chan, K.W., & Onaka, T. 2000, ApJ, 533, L33
- [] Churchwell, E.B., et al. 2006, ApJ, 649, 759
- [] Cox, P. 1995, RevMexAA Ser. Conf., 2, 105
- [] Cox, P., & Bronfman, L. 1995, A&A, 299, 583
- [] Cox, P., Mezger, P.G., Sievers, A., Najarro, F., Bronfman, L., Kreysa, E., & Haslam, G. 1995, A&A, 297, 168
- [] Crowther, P.A., & Dessart, L. 1998, MNRAS, 296, 622
- [] Danks, A.C., Walborn, N.R., Vieira, G., Landsman, W.B., Gales, J., & Garcia, B. 2001, ApJ, 547, L155
- [] Deharveng, L., & Maucherat, M. 1975, A&A, 41, 27
- [] Desch, S.J., & Ouellete, N. 2005, LPSC, 36, 1327
- [] Egan, M.P., Shipman, R.F., Price, S.D., Carey, S.J., Clark, F.O., & Cohen, M. 1998, ApJ, 494, L199
- [] Figer, D.F., Kim, S.S., Morris, M., Serabyn, E., Rich, R.M., & McLean, I.S. 1999, ApJ, 525, 750
- [] Fullerton, A.W., Massa, D.L., & Prinja, R.K. 2006, ApJ, 637, 1025
- [\citeauthoryearGhosh et al.Ghosh et al.1988] Ghosh, S.K., Iyengar, K.V.K., Rengarajan, S.N., et al. 1988, ApJ, 330, 928
- [\citeauthoryearGrabelsky et al.Grabelsky et al.1988] Grabelsky, D.A., Cohen, R.S., Bronfman, L., & Thaddeus, P. 1988, ApJ, 331, 181
- [] Hartigan, P., Morse, J.A., Tumlinson, J., Raymond, J., & Heathcote, S. 1999, ApJ, 512, 901
- [\citeauthoryearHarvey, Hoffmann, & CampbellHarvey et al.1979] Harvey, P.M., Hoffmann, W.F., & Campbell, M.F. 1979, ApJ, 227, 114
- [] Hester, J.J., Desch, S.J., Healy, K.R., & Leshin, L.A. 2004, Science, 304, 1116
- [] Hillenbrand, L.A., & Hartmann, L.W. 1998, ApJ, 492, 540
- [\citeauthoryearHuchtmeier & DayHuchtmeier & Day1975] Huchtmeier, W.K., & Day G.A. 1975, A&A, 41, 153
- [] Jewitt, D., Luu, J.X., & Trujillo, C. 1998, AJ, 115, 2125
- [] Kennicutt, R.C., 1984, ApJ, 287, 116
- [] Kennicutt, R.C., 1998, ARAA, 36, 189
- [] McCaughrean, M.J., & O’Dell, C.R. 1996, AJ, 111, 1977
- [] McCaughrean, M.J., et al. 1998, ApJ, 492, L157
- [] Meaburn, J., Lopez, J.A., & Keir, D., 1984, MNRAS, 211, 267
- [] Morris, P., et al. 1999, Nature, 402, 502
- [] Muench, A.A., Lada, E., Lada, C.J., Alves, J. 2002, ApJ, 573
- [] Price, S.D., 1995, Space Science Rev., 74, 81
- [] Rathborne, J.M., Burton, M.G., Brooks, K.J., Cohen, M., Ashley, M.C.B., & Storey, J.W.V. 2002, MNRAS, 331, 85
- [] Rathborne, J.M., Brooks, K.J., Burton, M.G., Cohen, M., & Bontemps, S. 2004, A&A, 418, 563
- [] Repolust, T., Puls, J., & Herrero, A. 2004, A&A, 415, 349
- [] Sanchawala,K., et al. 2007, ApJ, 656, 462
- [] Sanders, D.B., & Mirabel, I.F. 1996, ARAA, 34, 749
- [] Seward, F.D., & Chlebowski, T. 1982, ApJ, 256, 530
- [] Seward, F.D., et al. 1979, ApJ, 234, L55
- [] Simpson, & Rubin, R. 1990, ApJ, 354, 165
- [] Smith, N. 2002, MNRAS, 337, 1252
- [] Smith, N. 2002, MNRAS, 331, 7
- [] Smith, N. 2006a, MNRAS, 367, 763 (Paper I)
- [] Smith, N. 2006b, ApJ, 644, 1151
- [] Smith, N., & Gehrz, R.D. 2005, AJ, 129, 969
- [] Smith, N., Bally, J., & Morse, J.A. 2003, ApJ, 587, L105
- [] Smith, N., Bally, J., & Brooks, K.J. 2004a, AJ, 127, 2793
- [] Smith, N., Bally, J., Licht, D., & Walawender, J. 2005a, 129, 382
- [] Smith, N., Barbá, R.H., & Walborn, N.R. 2004b, MNRAS, 351, 1457
- [] Smith, N., Egan, M.P., Carey, S., Price, S.D., Morse, J.A., & Price, P.A. 2000, ApJ, 532, L145
- [] Smith, N., Gehrz, R.D., Hinz, P.M., Hoffmann, W.F., Hora, J.L., Mamajek, E.E., & Meyer, M.R. 2003b, AJ, 125, 1458
- [] Smith, N., et al. 2007, ApJ, in press (astro-ph/0612617)
- [] Smith, N., Stassun, K.G., & Bally, J. 2005b, AJ, 129, 888
- [] Spitzer, L.J. 1978, Physical Processes in the Interstellar Medium (New York: Wiley-Interscience)
- [] Tachibana, S., & Huss, G.R. 2003, ApJ, 588, L41
- [] Walborn, N.R. 2002, in ASP Conf. Ser. 267, 111
- [] Walborn, N.R., & Hesser, J.E. 1975, ApJ, 199, 531
- [] Walborn, N.R., Heckathorn, J.N., & Hesser, J.E. 1984, ApJ, 276, 524
- [] Walborn, N.R., Smith, N., Howarth, I.D., Vieira-Kober, G., Gull, T.R., & Morse, J.A. 2007, PASP, 119, 156
- [] Walsh, J.R. 1984, A&A, 138, 380
- [] Wang, Q., & Helfand, D.J. 1991, ApJ, 370, 541
- [\citeauthoryearWhiteoakWhiteoak1994] Whiteoak J.B.Z. 1994, ApJ, 429, 225
- [\citeauthoryearYonekura et al.Yonekura et al.2005] Yonekura Y., Asayama S., Kimura K., et al. 2005, ApJ, 634, 476
- [] Zhang, X., Lee, Y., Bolatto, A., & Stark, A.A. 2001, ApJ, 553, 274