Eight new T4.5–T7.5 dwarfs discovered in the UKIDSS Large Area Survey Data Release 1 ††thanks: Based on observations made with the United Kingdom Infrared Telescope, operated by the Joint Astronomy Centre on behalf of the U.K. Particle Physics and Astronomy Research Council.
Abstract
We present eight new T4.5–T7.5 dwarfs identified in the UKIRT Infrared Deep Sky Survey (UKIDSS) Large Area Survey (LAS) Data Release 1 (DR1). In addition we have recovered the T4.5 dwarf SDSS J020742.91000056.2 and the T8.5 dwarf ULAS J003402.77005206.7. Photometric candidates were picked up in two-colour diagrams over 190 deg2 (DR1) and selected in at least two filters. All candidates exhibit near-infrared spectra with strong methane and water absorption bands characteristic of T dwarfs and the derived spectral types follow the unified scheme of Burgasser et al. (2006). We have found 6 new T4.5–T5.5 dwarfs, one T7 dwarf, one T7.5 dwarf, and recovered a T4.5 dwarf and a T8.5 dwarf. We provide distance estimates which lie in the 15–85 pc range; the T7.5 and T8.5 dwarfs are probably within 25 pc of the Sun. We conclude with a discussion of the number of T dwarfs expected after completion of the LAS, comparing these initial results to theoretical simulations.
keywords:
Stars: brown dwarfs — techniques: photometric — techniques: spectroscopic — Infrared: Stars — surveys1 Introduction
The advent of large-scale sky surveys has revolutionised our knowledge of ultracool dwarfs (defined here as dwarfs with spectral types later than M7). The first spectroscopic brown dwarfs were confirmed in 1995: Gl229B, a T dwarf orbiting an M dwarf (Nakajima et al., 1995) and Teide 1 in the Pleiades open cluster (Rebolo et al., 1995). Ten years on, about 500 L dwarfs with effective temperatures (Teff) between 2200 and 1400 K (Basri et al., 2000; Leggett et al., 2000) have now been identified, along with around 100 T dwarfs with lower temperatures (T1400–700 K; Golimowski et al., 2004; Vrba et al., 2004). The full catalogue of L and T dwarfs is available on the DwarfArchives.org webpage111http://spider.ipac.caltech.edu/staff/davy/ARCHIVE/, a webpage dedicated to L and T dwarfs maintained by C. Gelino, D. Kirkpatrick, and A. Burgasser.. There are currently 46 T5 or later dwarfs and 17 T7–T8 dwarfs known (two of them are marked as peculiar), at the time of writing. The spectral classification of T dwarfs follows the unified scheme by Burgasser et al. (2006) and is based on the strength of methane and water absorption bands present in the near-infrared. This sample of ultracool dwarfs is now large enough to characterise the binary properties of brown dwarfs (Close et al., 2002; Burgasser et al., 2003; Bouy et al., 2003; Burgasser et al., 2006; Liu et al., 2006; Burgasser, 2007) and investigate the influence of gravity and metallicity on their spectral energy distributions (Kirkpatrick, 2005).
The UKIRT Infrared Deep Sky Survey (UKIDSS; Lawrence et al., 2006) is a new infrared survey conducted with the UKIRT Wide Field Camera (WFCAM). The survey is now well underway with (at the time of writing) three ESO-wide releases: the Early Data Release (EDR) in February 2006 (Dye et al., 2006), the Data Release 1 (DR1) in July 2006 (Warren et al., 2007a) and the Data Release 2 in March 2007 (Warren et al., 2007b). The Large Area Survey (LAS) will cover 4000 deg2 in down to a 5 sensitivity limit of 19.5 mag in each of two epochs (J20 mag when the epochs are combined) with a typical baseline of 2yr.
The two major science drivers of the LAS are the discovery of extremely cool brown dwarfs (with spectral types even later than the coolest objects discovered in the Two Micron All Sky Survey (2MASS) and the Sloan Digital Sky Survey (SDSS)), and the discovery of high-redshift quasars ( 6). New record-breaking low- dwarfs could require a new spectroscopic class beyond T (e.g. Burrows et al., 2003) which has been pre-emptively called Y (following Kirkpatrick et al., 1999). So far UKIDSS has succeeded on both fronts; Venemans et al. (2007) report the discovery of a quasar, and the discovery of two T dwarfs in the EDR (Kendall et al., 2007) has been followed by the identification of the latest T-type brown dwarf yet found (Warren et al., 2007c).
In this paper we report the discovery of eight T4.5–T7.5 dwarfs extracted from 190 deg2 released in the LAS DR1. We also derive kinematic properties for SDSS J020742.91000056.2 (hereafter SDSS0207), a T4.5 dwarf discovered by Geballe et al. (2002) and recovered in our search. In Section 2 we describe the photometric selection of late-T dwarfs from two-colour diagrams. In Section 3 we present the spectroscopic follow-up observations conducted with the Gemini and UKIRT telescopes, and classify each object based on the Burgasser et al. (2006) scheme. In Section 4 we discuss the number of T dwarfs that our study suggests will be discovered in the complete LAS, and compare it with the predictions of Deacon & Hambly (2006). Finally, we summarise our results and give our conclusions in Section 5.
2 Selection of T dwarf candidates
This section describes the photometric search carried out for late-T and possible Y dwarf candidates in the LAS, which is based on our current knowledge of the photometric properties of T dwarfs from 2MASS and SDSS, as well as on theoretical models. In addition to the traditional filters, a new filter centered at 1.03 (0.98–1.08) microns was specifically designed and installed in WFCAM to ease the selection and separation of high-redshift quasars and cool brown dwarfs in the LAS colour-colour diagrams (Warren & Hewett, 2002). Figure 1 shows (,) for candidate and confirmed L and T dwarfs found in DR1, as well as model-predicted typical colours, and typical colours of point sources in a WFCAM tile.
Known T dwarfs found by 2MASS exhibit neutral to blue near-infrared colours with decreasing effective temperature (Burgasser et al., 2002) and a rather constant (Hewett et al., 2006). SDSS discoveries (e.g. Geballe et al., 2002) show that T dwarfs are red in the optical () and optical-to-infrared () colours. the latter also being a good indicator of (Knapp et al., 2004). Hence the combination of the SDSS and the UKIDSS LAS should produce T and possibly Y dwarfs that are several magnitudes fainter than the 2MASS completeness limit.
Current atmosphere models predict blue near-infrared colours ( and ) for dwarfs cooler than the known T dwarfs, but differ on the optical-to-infrared colour: the cloud-free Cond models (Allard et al., 2001; Baraffe et al., 2003), the more recent Settl models (Allard et al. 2007, in prep.) and the models of Marley et al. (2002) all imply colours that are bluer than those of the known late-T dwarfs, for 700–400 K. However, Burrows et al. (2003) and Tsuji et al. (2004) predict redder colours for these temperatures (Leggett et al., 2005; Hewett et al., 2006). Our initial search focussed on the redder sources, and a subsequent search for bluer objects yielded only one very late T dwarf, presented in a separate paper (Warren et al., 2007c).

| Name | RA | dec | ||||
|---|---|---|---|---|---|---|
| ULAS J002422.94002247.9 | 00 24 22.94 | 00 22 47.9 | 19.590.15 | 18.160.07 | 18.240.16 | 18.05 |
| ULAS J003402.77005206.7 | 00 34 02.77 | 00 52 06.7 | 18.900.10 | 18.140.08 | 18.500.22 | 17.94 |
| ULAS J020336.94010231.1 | 02 03 36.94 | 01 02 31.1 | 19.060.10 | 18.040.05 | 18.310.12 | 18.130.17 |
| SDSS J020742.91000056.2 | 02 07 42.91 | 00 00 56.2 | 17.940.03 | 16.750.01 | 16.790.04 | 16.710.05 |
| ULAS J082707.67020408.2 | 08 27 07.67 | 02 04 08.2 | 18.290.05 | 17.190.02 | 17.440.05 | 17.520.11 |
| ULAS J090116.23030635.0 | 09 01 16.23 | 03 06 35.0 | 18.820.05 | 17.900.04 | 18.460.13 | 18.21 |
| ULAS J094806.06064805.0 | 09 48 06.06 | 06 48 05.0 | 20.030.14 | 18.850.07 | 19.460.22 | 18.62 |
| ULAS J100759.90010031.1 | 10 07 59.90 | 01 00 31.1 | 19.820.12 | 18.670.07 | 18.770.18 | 18.17 |
| ULAS J101821.78072547.1 | 10 18 21.78 | 07 25 47.1 | 18.900.08 | 17.710.04 | 17.870.07 | 18.120.17 |
| ULAS J223955.76003252.6 | 22 39 55.76 | 00 32 52.6 | 19.940.17 | 18.860.09 | 18.87 | 18.18 |
| 18.850.05a | 19.100.10a | 18.880.06a | ||||
| a UKIRT/UFTI Photometry | ||||||
2.1 Sample selection
Our basic search methodology was to extract from the UKIDSS LAS DR1 a sample of point-sources with the colours of late-T dwarfs, guided by the known and modelled colours, and then to cross-match with the SDSS (where possible) to obtain optical-to-infrared colours.
We have constructed a Structured Query Language (SQL) query to extract a list of reliable late-T dwarf candidates from the WFCAM Science Archive222located at http://surveys.roe.ac.uk/wsa/ (WSA; Hambly et al. 2007, in prep.). Further details regarding the SQL statements are provided in Appendix A. We search for point sources detected in at least and , and use other post-processing flags to avoid galaxies and fast moving objects. In addition, we have limited our search to the = 14–19 magnitude range, to avoid saturated sources and maximise the completeness of our sample. Furthermore, we have imposed colour cuts of 0.5 and 0.0 to focus on late-T dwarfs and potentially cooler objects. Finally, images were checked to insure that the candidates were real and unaffected by artefacts. The location of the new T dwarfs in the (,) two-colour diagram is displayed in Fig. 1.
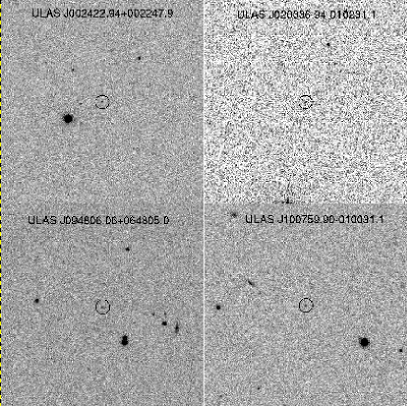
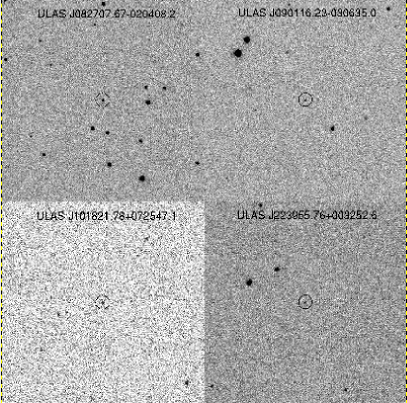
For the 150 deg2 of the UKIDSS LAS DR1 with SDSS data, only those LAS-selected candidates which had , or were undetected by SDSS, were retained. Candidates in the second category were also subject to the further requirement that they were not within a few arcsec of a brighter point-source – whilst such pairs are almost always separated in UKIDSS, the fainter source often remains unregistered in SDSS, leading to appreciable numbers of false -band drop-outs. Having applied all these automated filters, we were left with a total of 19 objects, 10 of which were quickly revealed to be spurious by visual inspection leaving a final list of just 9 viable T dwarf candidates. Of these, one (ULAS J022200.43002410.5) is awaiting further investigation, one is a known T4.5 dwarf (SDSS J020742.91000056.2, Geballe et al. 2002), and one is a new UKIDSS T8.5 dwarf (ULAS J003402.77005206.7, Warren et al. (2007c)). The remaining six have been confirmed as new T dwarfs. Finding charts are shown in Fig. 2, their basic observational properties are summarised in Table 1, and a brief statistical analysis of the sample is given in Section 4.3.
For the 40 deg2 of the UKIDSS LAS DR1 outside the SDSS DR5 footprint, we rejected sources with optical counterparts in the United States Naval Observatory (USNO) catalogues. However the magnitude limit of these catalogues is so bright that several hundred candidates remained, requiring cross-correlation with other optical catalogues or visual inspection. Not all of these objects have been followed up, but spectra were obtained of two of the most promising, ULAS J082707.67020408.2 and ULAS J090116.23030635.0, both of which were confirmed as T dwarfs. Their basic parameters are listed in Table 1 and finding charts are given in Fig. 2.
2.2 Additional photometry
Additional optical and near-infrared photometry was obtained with UKIRT and the New Technology Telescope (NTT) for one T dwarf, ULAS J223955.76003252.6 (hereafter ULAS2239). Details of these observations are given below.
ULAS2239 was observed at UKIRT on UT 2006 September 03, using the UKIRT Fast-Track Imager (UFTI; Roche et al., 2003). The Mauna Kea Observatories , and filters were used (MKO; Tokunaga, Simons & Vacca, 2002), and the data calibrated using UKIRT Faint Standards; the photometric system should be identical to the WFCAM system (Leggett et al., 2006). The night was photometric with 0.6 arcsec seeing. Individual exposure times on target were one minute, and the total exposure time was nine minutes at , 18 minutes at and 27 minutes at , dithering the dwarf on a 33 grid with 10 arcsec offsets. Photometry was measured using a two arcsec diameter aperture and is presented in Table 1.
In addition, we obtained -band photometry (filter ) for ULAS2239 with the ESO Multi-Mode Instrument (EMMI), at the NTT, on the night beginning 2006 August 18. The total exposure time was 15 minutes. The filter/detector combination is referred to here as and is similar to the SDSS . Using the measured CCD sensitivity curve, and the filter transmission curve, we followed the procedure used by Hewett et al. (2006) to establish the colour relation , for O to M dwarf stars. The offset to the Vega system is . Photometry in and of SDSS DR5 sources in the field was converted to , and the brightness of the source was measured by relative photometry using a fixed aperture, with the result . For a T6 dwarf .

| Name | H2O- | CH4- | H2O- | CH4- | CH4- | Template | Adopted |
|---|---|---|---|---|---|---|---|
| ULAS J002422.94002247.9 | 0.291 (T4.5) | 0.382 (T5.5) | 0.423 (T3.5) | 0.547 (T4) | 0.195 (T5.5) | T4.5 | T4.50.5 |
| ULAS J003402.77005206.7 | 0.012 (T8.5) | 0.144 (T8.5) | 0.133 (T8.5) | 0.096 (T8) | 0.091 (T7) | T8–T8.5 | T8.50.5 |
| ULAS J020336.94010231.1 | 0.288 (T4.5) | 0.429 (T4.5) | 0.328 (T5.5) | 0.410 (T5) | 0.245 (T4.5) | T4.5–T5 | T5.00.5 |
| SDSS J020742.91000056.2 | — (—) | — (—) | 0.391 (T4) | 0.565 (T4) | 0.282 (T4) | T4.0 | T4.00.5 |
| ULAS J082707.67020408.2 | 0.213 (T5.5) | 0.384 (T5.5) | 0.300 (T6) | 0.384 (T5.5) | 0.238 (T4.5) | T5–T5.5 | T5.50.5 |
| ULAS J090116.23030635.0 | 0.075 (T7.5) | 0.226 (T7) | 0.118 (T8) | 0.186 (T7) | 0.198 (T5) | T7–T7.5 | T7.50.5 |
| ULAS J094806.06064805.0 | 0.087 (T7) | 0.215 (T7.5) | 0.254 (T6.5) | 0.222 (T7) | 0.115 (T6.5) | T7.0 | T7.00.5 |
| ULAS J100759.90010031.1 | 0.177 (T5.5) | 0.321 (T6) | 0.303 (T6) | 0.345 (T5.5) | 0.191 (T5.5) | T5.5 | T5.50.5 |
| ULAS J101821.78072547.1 | 0.304 (T4.5) | 0.437 (T4.5) | 0.376 (T4.5) | 0.451 (T4.5) | 0.151 (T6) | T5.0 | T5.00.5 |
| ULAS J223955.76003252.6 | 0.195 (T5.5) | 0.324 (T6) | 0.258 (T6.5) | 0.356 (T5.5) | 0.187 (T5.5) | T5.5–T6 | T5.50.5 |
3 Spectroscopic follow-up
3.1 Gemini/GNIRS spectroscopy
The Gemini Near-Infrared Spectrograph (GNIRS; Elias et al., 2006) on Gemini South was used to make quick response observations, through programme GS-2006B-Q-36. All photometric candidates were confirmed as T dwarfs with spectral types later than T4. GNIRS was used in cross-dispersed mode with the 32l/mm grism, the 1.0 arcsec slit (position angle of 0∘) and the short camera, to obtain 0.9–2.5m R500 (per resolution element) spectra. Triggered observations were made on the nights of 2006 August 26, October 12, 20, 27, and 2007 January 04, 20 with total integration time for each observation of 16 minutes. In each case the target was nodded three arcsec along the slit in an “ABBA” pattern using individual exposure times of 240 s. Calibrations were achieved using lamps in the on-telescope calibration unit. A0 and early F stars were observed as spectroscopic standards, either directly before or after the target observations, at an airmass that closely matched the mid-point airmass of the target in order to remove the effects of telluric absorption. The observing conditions included some patchy cloud (i.e. cloud cover70 per cent-ile), seeing from 0.5–1.4 arcsec, and humidity ranging from 10–50%.
Data reduction was initially done using tasks in the Gemini GNIRS IRAF Package. Files were prepared and corrected for offset bias using NSPREPARE and NVNOISE, and order separation achieved with NSCUT. Each order was then median stacked at the A and B positions, and a difference image obtained using GEMARITH. Flat-field correction was not necessary since variations across the six arcsec slit are less than 0.1%. S-distortion correction and wavelength calibration were performed interactively using the telluric star spectra and Argon arc lamp spectra, with NSAPPWAVE, NSSDIST and NSWAVE. Further reduction was carried out using custom IDL routines. Apertures (1.5 arcsec wide) were centred on the spectra at the A and B positions, and the sky residuals were fit (and subtracted) using a surface constructed via a series of least-squares linear fits across the slit (excluding pixels within the apertures), with one fit for each spatial pixel row. Spectra were then extracted by summing within the A and B position apertures and combining. Noise spectra were also determined using a combination of the sky noise (between the A and B position spectra), and the photon noise associated with the spectra themselves. The target spectra were flux-calibrated on a relative scale using the telluric standard spectra (after appropriate interpolation across any hydrogen lines in the standards) with an assumed black body function for =10000 K and 7000 K for A0 and early F tellurics respectively. The spectral orders were then trimmed of their noisiest portions, and the spectra normalised to unity at 1.27 microns (the average level from 1.265–1.275 microns). Although the shape of each spectrum will be correct, the absolute flux calibration is best determined by scaling the spectra to match the WFCAM photometry. We find that a single scaling factor reproduces the observed magnitudes within the 2–10% WFCAM photometric uncertainties, except for the magnitudes of ULAS J020336.94010231.1 and ULAS J101821.78072547.1 which the spectra suggest are 1.5 and 2.5 brighter than the WFCAM measurements, respectively. The final smoothed spectra of the eight new T dwarfs observed with GNIRS are displayed in Fig. 3.
3.2 UKIRT/UIST spectroscopy
SDSS0207 was observed at UKIRT on UT 2006 September 04, using the UKIRT Imager Spectrometer (UIST; Ramsay Howat et al., 2004). The HK grism was used with the four pixel slit, giving a resolution R=550. Individual exposure times on target were 240 s, and the total exposure was 64 minutes, nodding the target along the slit by 12 arcsec. The instrument calibration lamps were used to provide accurate flat-fielding and wavelength calibration. The F5V star HD 5892 was observed prior to the target to remove the effects of telluric absorption, and to provide an approximate flux calibration. More accurate absolute flux calibration was achieved by scaling the spectra to the and magnitudes measured in the LAS. The final spectrum of SDSS0207 is shown in Fig. 4.

3.3 Spectral classification
For each spectrum we calculated the five near-infrared spectral indices H2O-, CH4-, H2O-, CH4- and CH4- as defined in Burgasser et al. (2006). We also compared the data by eye to template spectra for T dwarfs defined by Burgasser et al. as standards for the T4, T5, T6, T7 and T8 types. The results for the new T dwarfs with GNIRS spectra are given in Table LABEL:tab_dT:SpT. For the recovered SDSS0207, we derive a type of T4.00.5, in agreement with Geballe et al. (2002) and Burgasser et al. (2006) who derive T4.50.5. Some scatter is present in the spectral indices given in Table LABEL:tab_dT:SpT. The GNIRS exposures were designed to provide only a rough spectral type for potential late-T dwarfs, and so can yield somewhat noisy spectra, especially in the -band. Consequentially, the direct comparison with templates has been given more weight than the spectral indices in the assignment of spectral types, and the adopted uncertainty in Table LABEL:tab_dT:SpT reflects the range in type implied by this comparison.
The comparison to the spectral templates, together with modelled trends with gravity and metallicity (as shown for example by Liu et al. (2007), and Leggett et al. 2007, ApJ, submitted) allow us to identify dwarfs that may have a metallicity or a gravity different from the solar-neighbourhood sample that defines the templates. Leggett et al. (2007, ApJ, submitted; their Figure 3) shows that, for late-T dwarfs, increasing gravity suppresses the -band flux due to increased pressure-induced H2 opacity (and vice-versa), while decreasing metallicity also increases the H2 opacity and suppresses , but has the additional signature of broadening the 1 micron -band flux peak. Searching for these signatures, we find that most of our sample appear to be typical of the solar-neighbourhood, so that metallicity is likely to be solar, and gravity is likely to be given by =5.0. The exceptions are (see Fig. 3): ULAS J020336.94010231.1 which appears to be a low-gravity object based on the high -band flux; ULAS J090116.23030635.0 which appears to be a high-gravity object based on the low -band flux; and ULAS J101821.78072547.1 which appears to be metal-rich based on the high -band flux and narrow -band flux peak. ULAS J223955.76003252.6 may have a somewhat low gravity, however the spectrum is very noisy for this very faint dwarf. Fig. 3 also suggests that the -band flux of ULAS J100759.90010031.1 is suppressed, but the spectrum is compromised by data spikes at 2.0 and 2.2 microns, and the spectral energy distribution is in fact very similar to the templates if these regions are ignored.
4 Discussion
4.1 Properties of SDSS J020742.83000056.2
Our search criteria recovered one T dwarf found by the SDSS group (SDSS0207 — T4.5; Geballe et al., 2002). Geballe et al. (2002) reported magnitudes for SDSS0207 of 16.63, 16.66 and 16.62, with uncertainties of 0.05 mag. Observations were obtained with UKIRT/UFTI and are described in Leggett et al. (2002). Although the WFCAM magnitudes (Table 1) are 0.1 magnitudes fainter, the two datasets agree to 2 and are thus reasonably consistent. The second epoch LAS could be used to investigate photometric variability in the T dwarfs. The derived spectral types (T4.5 in the discovery paper and T4 here are in agreement within the classification uncertainties.
This object has known proper motion (0.1560.011 arcsec/yr) and parallax (0.0350.001 arcsec; Vrba et al., 2004). We are able to estimate its proper motion from the 3 year baseline between the SDSS (2002 September 04) and LAS (2005 November 26) observations. We have measured 0.142 and 0.085 arcsec/yr in right ascension and declination, respectively, yielding a total proper motion of 0.1660.020 arcsec/yr consistent with the value given in Vrba et al. (2004). SDSS observations can thus provide a first epoch comparison for UKIDSS, improving the prospects for identifying sources with significant proper motion in the second-epoch -band LAS observations.
4.2 Distances
To estimate the distances of the new T dwarfs we considered three relationships between spectral type and absolute magnitude: those published by Vrba et al. (2004), Knapp et al. (2004), and Liu et al. (2006). The first was derived using 19 T0–T8 dwarfs with measured parallaxes. Knapp et al. (2004) supplied a fifth-order polynomial fit to 42 spectroscopically confirmed T dwarfs. Liu et al. (2006) employed the same procedure as Knapp et al. (2004) but excluded known and possible binaries from the fit to take into account the higher frequency of binary systems among objects with L/T transition colours (e.g. Burgasser et al., 2006; Liu et al., 2006). The exclusion of binaries results in a relation with fainter absolute magnitudes and smaller inferred distances, for early-mid T dwarfs. The values derived using the three relationships are given in Table LABEL:tab_dT:Dist.
For our final distance estimates we chose those derived using the most recent spectral-type–MJ relation (Liu et al., 2006). The uncertainties in our distance estimates were computed by assuming a dispersion of 0.5 mag in the spectral type–absolute magnitude relation. The adopted mean distances and their associated intervals are quoted in Table LABEL:tab_dT:Dist. These distances assume single objects; if any of these sources are in fact multiple systems, they would be more distant by 40%, assuming an unresolved binary with components of comparable brightness.
These spectroscopic distances show that the LAS is detecting late-T dwarfs out to 80 pc (see also Kendall et al., 2007, the discovery of ULAS J14520655, a T4.5 dwarf at around 80 pc, shown in our Figure 1 as a diamond). Also, note that the T7.5 dwarf ULAS J090116.23030635.0, and the T8.5 dwarf ULAS J003402.77005206.7 (Warren et al., 2007c), may lie within the 25 pc limit of the catalogue of nearby stars (Gliese & Jahreiss, 1995), and thus represent an important addition to the list of nearby cool brown dwarfs.
Assuming the same spectral type-absolute magnitude relationship, we derive a spectroscopic distance of 28 pc (23–36 pc) for SDSS0207, in good agreement with the parallax distance of 280.8 pc (Vrba et al., 2004). This object is of interest as it populates the bump seen for the L-T sequence in the spectral type–MJ diagram for late-L to mid-T dwarfs (Burgasser et al., 2006; Liu et al., 2006). Although this bump is known to be partially caused by unresolved binarity, it also appears to be intrinsic to the atmospheric physics of the L-T transition.
| Name | V04 | K04 | L06 | Adopted |
|---|---|---|---|---|
| ULAS J002422.94002247.9 | 54.4 | 62.4 | 53.1 | 42–67 |
| ULAS J003402.77005206.7 | 14–21 | |||
| ULAS J020336.94010231.1 | 47.6 | 54.5 | 48.3 | 38–61 |
| ULAS J082707.67020408.2 | 29.2 | 33.1 | 30.8 | 24–39 |
| ULAS J090116.23030635.0 | 22.3 | 28.3 | 26.0 | 21–33 |
| ULAS J094806.06064805.0 | 41.4 | 41.4 | 47.7 | 38–60 |
| ULAS J100759.90010031.1 | 57.9 | 65.6 | 60.9 | 48–77 |
| ULAS J101821.78072547.1 | 40.9 | 46.6 | 41.5 | 33–52 |
| ULAS J223955.76003252.6 | 62.8 | 71.5 | 66.1 | 52–83 |
4.3 Expected numbers of late-T dwarfs in the LAS
In this section we try to estimate the observed number density of late-T (T4; T 1300 K) dwarfs from our spectroscopic follow-up and compare it with predictions by Deacon & Hambly (2006). Quantification of completeness is difficult at this early stage at the faint end of the survey. However, we expect our sample to be complete down to = 18.5 mag and possibly = 19 mag because all late-T dwarfs will be detected in the passband.
This paper reports ten T dwarfs, with spectral type T4 and later, extracted from a total area of 190 deg2 (DR1). Of these, seven are brighter than = 18.5 mag. To compare directly with the numbers quoted in Table 1 of Deacon & Hambly (2006), we need to scale our numbers to 4000 deg2 (the full LAS coverage after seven years of operation) and take into account the final depth of the survey ( 20 mag) after two epochs. We assume here a uniform and constant distribution of ultracool dwarfs which is reasonable, because an extra magnitude of depth for late-T dwarfs will not probe the scale height of the disk.
Consequently, for the bright sample with 18.5 mag, we should find 74000/190 multiplied by a factor of 8 to account for the volume difference, yielding a total of 117934 late-T dwarfs. If we take into account all T dwarfs reported here, we estimate a total of (104000/190)4 = 84229 T dwarfs in the full LAS. These values match the predicted numbers from the simulations of Deacon & Hambly (2006) for a mass function with a slope between = 1.0 and = 0.5 (in Salpeter units or = d/d ; 676–1060 late-T dwarfs, defined in Deacon & Hambly (2006) as dwarfs with 1300 (K) ). This result is also in agreement with the derivations of = 0.70.7 for M 0.08 M⊙ by Kroupa (2001) and conclusions drawn by Allen et al. (2005) from their Bayesian approach ( = 0.60.7 for M 0.04–0.1 M⊙). Similar results are found for the low-mass end of the IMF in young open clusters (e.g. Orionis; González-García et al., 2006).
However, uncertainties in the expected number of T dwarfs and the slope of the mass function remain large on both the observational and theoretical sides. Malmquist related biases have not been taken into consideration for example, but contribute significant uncertainty. For instance, earlier T dwarfs could be detected out to greater distance than some mid-late Ts, and our colour selections are poorly suited for identifying these. Furthermore, there will be a bias favouring unresolved binary systems, as they are brighter than single T dwarfs and detectable at greater distance. The Deacon & Hambly numbers do not account for this bias, but it will be inherent in our sample. A more extensive spectroscopic follow-up of L and T dwarf candidates from the LAS is necessary to disentangle the various possible shapes of the IMF.
5 Conclusions
We have presented the spectroscopic confirmation of eight new T4.5–T7.5 dwarfs identified over the entire LAS area released in the first UKIDSS data release, together with the recovery of a T4.5 dwarf already discovered in the SDSS, and a T8.5 reported by (Warren et al., 2007c). The spectral classification is based on the unified T-dwarf classification scheme of Burgasser et al. (2006). In addition, we have estimated distances for all of our sources using recent spectral type–absolute magnitude relationships. The two latest and coolest dwarfs among the new T dwarfs identified in the LAS DR1, the T7.5 and the T8.5, might be within the 25 pc limit of nearby stars. Although our spectroscopic follow-up is limited, our estimates of the number density of T dwarfs agree with other studies.
We have demonstrated the capabilities of the UKIDSS LAS and expect to achieve the main scientific drivers set for the survey. The LAS will be able to detect T dwarfs out to 80 pc and L dwarfs much further, enabling the study of the scale height of field brown dwarfs. Also, the second-epoch coverage in will provide proper motions for a large number of candidate L and T dwarfs identified in the LAS, and allow us to identify fainter and more distant objects.
Acknowledgments
NL was a postdoctoral research associate funded by the UK PPARC at the University of Leicester where part of this work was carried out. SKL is supported by the Gemini Observatory, which is operated by the Association of Universities for Research in Astronomy, Inc., on behalf of the international Gemini partnership. MCL acknowledges support for this work from NSF grants AST-0407441 and AST-0507833 and an Alfred P. Sloan Research Fellowship. This research has made use of the Simbad database of NASA’s Astrophysics Data System Bibliographic Services (ADS). Research has benefitted from the M, L, and T dwarf compendium housed at DwarfArchives.org and maintained by Chris Gelino, Davy Kirkpatrick, and Adam Burgasser. The United Kingdom Infrared Telescope is operated by the Joint Astronomy Centre on behalf of the U.K. Particle Physics and Astronomy Research Council. Based on observations obtained at the Gemini Observatory (program GS-2006B-Q-36), which is operated by the Association of Universities for Research in Astronomy, Inc., under a cooperative agreement with the NSF on behalf of the Gemini partnership: the National Science Foundation (United States), the Particle Physics and Astronomy Research Council (United Kingdom), the National Research Council (Canada), CONICYT (Chile), the Australian Research Council (Australia), CNPq (Brazil) and CONICET (Argentina). The SDSS is managed by the Astrophysical Research Consortium for the Participating Institutions. The Participating Institutions are the American Museum of Natural History, Astrophysical Institute Potsdam, University of Basel, University of Cambridge, Case Western Reserve University, University of Chicago, Drexel University, Fermilab, the Institute for Advanced Study, the Japan Participation Group, Johns Hopkins University, the Joint Institute for Nuclear Astrophysics, the Kavli Institute for Particle Astrophysics and Cosmology, the Korean Scientist Group, the Chinese Academy of Sciences (LAMOST), Los Alamos National Laboratory, the Max-Planck-Institute for Astronomy (MPIA), the Max-Planck-Institute for Astrophysics (MPA), New Mexico State University, Ohio State University, University of Pittsburgh, University of Portsmouth, Princeton University, the United States Naval Observatory, and the University of Washington.
References
- Allard et al. (2001) Allard F., Hauschildt P. H., Alexander D. R., Tamanai A., Schweitzer A., 2001, ApJ, 556, 357
- Allen et al. (2005) Allen P. R., Koerner D. W., Reid I. N., Trilling D. E., 2005, ApJ, 625, 385
- Baraffe et al. (2003) Baraffe I., Chabrier G., Barman T. S., Allard F., Hauschildt P. H., 2003, A&A, 402, 701
- Basri et al. (2000) Basri G., Mohanty S., Allard F., Hauschildt P. H., Delfosse X., Martín E. L., Forveille T., Goldman B., 2000, ApJ, 538, 363
- Bouy et al. (2003) Bouy H., Brandner W., Martín E. L., Delfosse X., Allard F., Basri G., 2003, AJ, 126, 1526
- Burgasser (2007) Burgasser A. J., 2007, ApJ, 658, 617
- Burgasser et al. (2006) Burgasser A. J., Geballe T. R., Leggett S. K., Kirkpatrick J. D., Golimowski D. A., 2006a, ApJ, 637, 1067
- Burgasser et al. (2002) Burgasser A. J., et al. 2002, ApJ, 564, 421
- Burgasser et al. (2006) Burgasser A. J., Kirkpatrick J. D., Cruz K. L., Reid I. N., Leggett S. K., Liebert J., Burrows A., Brown M. E., 2006b, ApJS, 166, 585
- Burgasser et al. (2003) Burgasser A. J., Kirkpatrick J. D., Reid I. N., Brown M. E., Miskey C. L., Gizis J. E., 2003, ApJ, 586, 512
- Burrows et al. (2003) Burrows A., Sudarsky D., Lunine J. I., 2003, ApJ, 596, 587
- Close et al. (2002) Close L. M., Siegler N., Potter D., Brandner W., Liebert J., 2002, ApJL, 567, L53
- Deacon & Hambly (2006) Deacon N. R., Hambly N. C., 2006, MNRAS, 371, 1722
- Dye et al. (2006) Dye S., Warren S. J., Hambly N. C., Cross N. J. G., Hodgkin S. T., Irwin M. J., Lawrence A., Adamson A. J., 37 co-authors 2006, MNRAS, 372, 1227
- Elias et al. (2006) Elias J. H., Joyce R. R., Liang M., Muller G. P., Hileman E. A., George J. R., 2006, in Ground-based and Airborne Instrumentation for Astronomy. Edited by McLean, Ian S.; Iye, Masanori. Proceedings of the SPIE, Volume 6269, pp. (2006). Design of the Gemini near-infrared spectrograph
- Geballe et al. (2002) Geballe T. R., et al. 2002, ApJ, 564, 466
- Gliese & Jahreiss (1995) Gliese W., Jahreiss H., 1995, Nearby Stars, Preliminary 3rd Version, 5070
- Golimowski et al. (2004) Golimowski D. A., et al. 2004, AJ, 127, 3516
- González-García et al. (2006) González-García B. M., Zapatero Osorio M. R., Béjar V. J. S., Bihain G., Barrado Y Navascués D., Caballero J. A., Morales-Calderón M., 2006, A&A, 460, 799
- Hewett et al. (2006) Hewett P. C., Warren S. J., Leggett S. K., Hodgkin S. T., 2006, MNRAS, 367, 454
- Kendall et al. (2007) Kendall T. R., et al. 2007, A&A, 466, 1059
- Kirkpatrick (2005) Kirkpatrick J. D., 2005, ARA&A, 43, 195
- Kirkpatrick et al. (1999) Kirkpatrick J. D., et al. 1999, ApJ, 519, 802
- Knapp et al. (2004) Knapp G. R., et al. 2004, AJ, 127, 3553
- Kroupa (2001) Kroupa P., 2001, MNRAS, 322, 231
- Lawrence et al. (2006) Lawrence A., et al. 2006, astro-ph/0604426
- Leggett et al. (2005) Leggett S. K., Allard F., Burgasser A. J., Jones H. R. A., Marley M. S., Tsuji T., 2005, in Favata F., et al. eds, Proceedings of the 13th Cambridge Workshop on Cool Stars, Stellar Systems and the Sun, held 5-9 July, 2004 in Hamburg, Germany. Edited by F. Favata et al. ESA SP-560, European Space Agency, 2005., p.143 Vol. 13, Spectral classification beyond M.
- Leggett et al. (2006) Leggett S. K., et al. 2006, MNRAS, 373, 781
- Leggett et al. (2000) Leggett S. K., et al. 2000, ApJL, 536, L35
- Leggett et al. (2002) Leggett S. K., et al. 2002, ApJ, 564, 452
- Liu et al. (2007) Liu M. C., Leggett S. K., Chiu K., 2007, ApJ, 660, 1507
- Liu et al. (2006) Liu M. C., Leggett S. K., Golimowski D. A., Chiu K., Fan X., Geballe T. R., Schneider D. P., Brinkmann J., 2006, ApJ, 647, 1393
- Marley et al. (2002) Marley M. S., Seager S., Saumon D., Lodders K., Ackerman A. S., Freedman R. S., Fan X., 2002, ApJ, 568, 335
- Nakajima et al. (1995) Nakajima T., Oppenheimer B. R., Kulkarni S. R., Golimowski D. A., Matthews K., Durrance S. T., 1995, Nat, 378, 463
- Ramsay Howat et al. (2004) Ramsay Howat S. K., et al. 2004, in Moorwood A. F. M., Iye M., eds, Ground-based Instrumentation for Astronomy. Edited by Alan F. M. Moorwood and Iye Masanori. Proceedings of the SPIE, Volume 5492, pp. 1160-1171 (2004). The commissioning of and first results from the UIST imager spectrometer. pp 1160–1171
- Rebolo et al. (1995) Rebolo R., Zapatero-Osorio M. R., Martín E. L., 1995, Nat, 377, 129
- Roche et al. (2003) Roche P. F., et al. 2003, in Iye M., Moorwood A. F. M., eds, Instrument Design and Performance for Optical/Infrared Ground-based Telescopes. Edited by Iye, Masanori; Moorwood, Alan F. M. Proceedings of the SPIE, Volume 4841, pp. 901-912 (2003). UFTI: the 0.8 - 2.5 m fast track imager for the UK infrared telescope. pp 901–912
- Tokunaga et al. (2002) Tokunaga A. T., Simons D. A., Vacca W. D., 2002, PASP, 114, 180
- Tsuji et al. (2004) Tsuji T., Nakajima T., Yanagisawa K., 2004, ApJ, 607, 511
- Venemans et al. (2007) Venemans B. P., McMahon R. G., Warren S. J., Gonzalez-Solares E. A., Hewett P. C., Mortlock D. J., Dye S., Sharp R. G., 2007, MNRAS, 376, L76
- Vrba et al. (2004) Vrba F. J., et al. 2004, AJ, 127, 2948
- Warren & Hewett (2002) Warren S., Hewett P., 2002, in Metcalfe N., Shanks T., eds, ASP Conf. Ser. 283: A New Era in Cosmology WFCAM, UKIDSS, and z = 7 Quasars. p. 369
- Warren et al. (2007b) Warren S. J., et al. 2007b, astropH/0703037
- Warren et al. (2007a) Warren S. J., et al. 2007a, MNRAS, 375, 213
- Warren et al. (2007c) Warren S. J., et al. 2007c, submitted to MNRAS
Appendix A Selection procedure for T dwarf candidates in the UKIDSS Large Area Survey
The set of Structured Query Language (SQL) statements employed to extract lists of reliable point-sources with the colours of late-T dwarfs from the WFCAM Science Archive is detailed here. Sufficient reliability was obtained by demanding detection in at least the - and -bands ({Y,J_1}Class > -10), rejecting sources which were classified as noise in any band ({Y,J_1,H,K}Class != 0, note that this is different from a null detection which has Class = 9999), and requiring that inter-band positional offsets are no more than 0.7 arcsec to preclude asteroids which have moved appreciably between exposures. Point-sources were selected by demanding MergedClass = -1, and we rejected bright, potentially saturated sources (J_1AperMag3 >= 14.0 mag), in addition to applying a magnitude cut of mag. The principal T dwarf selection was simply a pair of colour cuts: and (YAperMag3 - J_1AperMag3 >= 0.5 and J_1AperMag3 - HAperMag3 <= 0.0), where, in the case of non-detections, the -band magnitude was replaced with the -band point-source limit calculated using the recipe given by Dye et al. (2006). The candidate list was further trimmed by removing potential cross-talk artefacts (Dye et al., 2006) by rejecting any object up to seven multiples of 51 arcsec away in right ascension or declination from a 2MASS point-source with mag.