Charged kaon lifetime at KLOE
Abstract
Abstract
Preliminary result on the charged kaon lifetime , obtained by the
KLOE experiment operating at DANE, the Frascati -factory, is
presented.
1 DANE and KLOE
The DANE e+e- collider operates at a total energy W = 1020 MeV, the mass of the (1020)-meson. Approximately -mesons are produced for each integradet luminosity of 1 pb-1. Since 2001, KLOE has collected an integrated luminosity of about 2.5 fb-1. Results presented below are based on 2001-02 data for about 450 pb-1. The KLOE detector consists of a large cylindrical drift chamber, DC, surrounded by a lead/scintillating-fiber electromagnetic calorimeter, EMC. The drift chamber [1], is 4 m in diameter and 3.3 m long. The momentum resolution is . Two track vertices are reconstructed with a spatial resolution of 3 mm. The calorimeter [3], composed of a barrel and two endcaps, covers 98% of the solid angle. Energy and time resolution are and . A superconducting coil around the detector provides a 0.52 T magnetic field. The KLOE trigger [5], uses calorimeter and drift chamber information. For the present analysis only the electromagnetic calorimeter (EMC) signals have been used. Two local energy deposits above threshold, MeV for the barrel and MeV for the endcaps, are required.
2 The tag mechanism
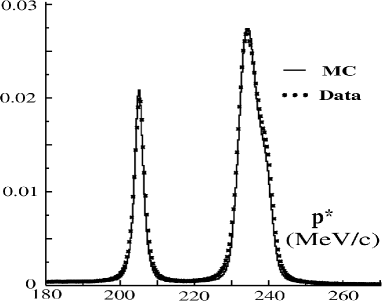
Most of the case in its center of mass -mesons decay into anti-collinear pairs. In the laboratory this remains approximately true because of the small crossing angle of the e+ and e- beams. Therefore the detection of a tags the presence of a of given momentum and direction. The decay products of the pair define two spatially well separated regions called the tag and the signal hemispeheres. Identified decays tag a beam and provide sample count, using the total number of tags as normalization. This procedure is a unique feature of a -factory and provides the means for measuring absolute branching ratios. Charged kaons are tagged using the two body decays and . Since the two body decays correspond to about 85% of the charged kaon decays [7] and since [7], there are about events/pb-1. The two body decays are identified as peaks in the momentum spectrum of the secondary tracks in the kaon rest frame and computed assuming for the particle (Fig. 1). In order to minimize the impact of the trigger efficiency, the taging kaon must provide the EMC trigger of the event, so called self-triggering tags. per pb-1.
3 Measurement of the charged kaon lifetime
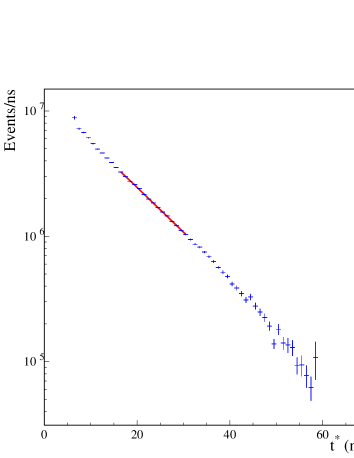
The measurement is performed using 230 pb-1 collected at peak. The data sample has been split in two uncorrelated subsamples, 150 pb-1 have been used for the measurement, the remaining 80 pb-1 have been used to evaluate the efficiencies. tags of both charges have been used. There are two methods available for the measurement: the kaon decay length and the kaon decay time. The two methods allow cross checks and studies of systematics; their resolutions are comparable. The method relying on the measurement of the charged kaon decay length requires first the reconstruction of the kaon decay vertex in the fiducial volume using only DC information: the signal is given by a , moving outwards in the DC with momentum MeV/c and having point of closest approach to the interaction point (IP) with cm and cm. The kaon decay vertex in the DC fiducial volume ( cm, cm) is required. Once the decay vertex has been identified the kaon track is extrapolated backward to the interaction point into 2 mm steps, taking into account the ionization energy loss to evaluate its velocity . Then the proper time is obtained from:
| (1) |
The efficiency has been evaluated directly from data. The control sample has been selected using calorimetric information only, selecting for a neutral vertex: two clusters in time fired by the photons coming from the decay. The proper time is fitted between 16 and 30 ns correcting for the efficiency. Resolution effects have been taken into account. The preliminary result we have obtained, which is the weighted mean between the and the lifetimes, is:
| (2) |
The evaluation of systematic uncertainties is sill preliminary, final numbers will be presented at the conference.
The second method relies on the measurement of the kaon decay time. We consider only events with a in the final state:
| (3) |
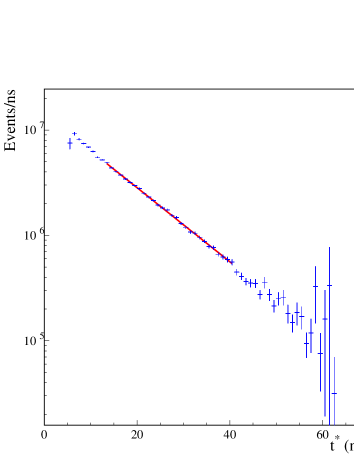
We can obtain the kaon time of flight using the time ot the EMC clusters of the photons from the decay. We require the backward extrapolation to the interaction point of the tagging kaon track and the forward extrapolation of the helix of the other kaon on the signal side. Stepping along the helix we look for the decay vertex without looking at the real kaon track. For each photon it is possible to measure the kaon proper decay time
| (4) |
The efficiency has been evaluated directly from data. The control sample has been selected using drift chamber information only, selecting the kaon decay vertex in the fiducial volume. The proper time is fitted between 13 and 42 ns correcting for the efficiency. Resolution effects have been taken into account. The weighted mean between the and the lifetimes gives as preliminary result:
| (5) |
The evaluation of systematic uncertainties is sill preliminary, final numbers will be presented at the conference. In order to evaluate the statistical correlation between the two methods we divide the data sample into five subsamples. For each subsample, and for each method, we evaluate the proper time distribution and its efficiency. The value of the correlation is
| (6) |
The weighted mean between the two charges and between the two methods is
| (7) |
References
- [1] M. Adinolfi et al., [KLOE Collaboration], The tracking detector of the KLOE experiment,
- [2] Nucl. Instrum. Meth A 488 2002 51
- [3] M. Adinolfi et al., [KLOE Collaboration], The KLOE electomagnetic calorimeter,
- [4] Nucl. Instrum. Meth A 482 2002 364
- [5] M. Adinolfi et al., [KLOE Collaboration], The trigger system of the KLOE experiment,
- [6] Nucl. Instrum. Meth A 492 2002 134
- [7] W.-M. Yao et al. (Particle Data Group Collaboration) Journal of Physics G 33, 1 2006