Hubble and Spitzer Observations of an Edge-on Circumstellar Disk around a Brown Dwarf11affiliation: Based on observations made with the NASA/ESA Hubble Space Telescope and the Spitzer Space Telescope. The Hubble observations are associated with proposal ID 10511 and were obtained at the Space Telescope Science Institute, which is operated by the Association of Universities for Research in Astronomy, Inc., under NASA contract NAS 5-26555. Spitzer is operated by the Jet Propulsion Laboratory at the California Institute of Technology under NASA contract 1407.
Abstract
We present observations of a circumstellar disk that is inclined close to edge-on around a young brown dwarf in the Taurus star-forming region. Using data obtained with SpeX at the NASA Infrared Telescope Facility, we find that the slope of the 0.8-2.5 µm spectrum of the brown dwarf 2MASS J04381486+2611399 cannot be reproduced with a photosphere reddened by normal extinction. Instead, the slope is consistent with scattered light, indicating that circumstellar material is occulting the brown dwarf. By combining the SpeX data with mid-infrared photometry and spectroscopy from the Spitzer Space Telescope and previously published millimeter data from Scholz and coworkers, we construct the spectral energy distribution for 2MASS J04381486+2611399 and model it in terms of a young brown dwarf surrounded by an irradiated accretion disk. The presence of both silicate absorption at 10 µm and silicate emission at 11 µm constrains the inclination of the disk to be , i.e. from edge-on. Additional evidence of the high inclination of this disk is provided by our detection of asymmetric bipolar extended emission surrounding 2MASS J04381486+2611399 in high-resolution optical images obtained with the Hubble Space Telescope. According to our modeling for the SED and images of this system, the disk contains a large inner hole that is indicative of a transition disk ( AU) and is somewhat larger than expected from embryo ejection models (-40 AU vs. -20 AU).
Subject headings:
accretion disks – planetary systems: protoplanetary disks – stars: formation — stars: low-mass, brown dwarfs — stars: pre-main sequence1. Introduction
Measurements of the properties of circumstellar accretion disks around young stars are important because they represent constraints on the initial conditions of planet formation. A unique set of measurements can be performed on a disk in the rare case in which it is seen close to edge-on. Because an edge-on disk occults the central star, scattered light from the disk surface dominates the total emergent flux at optical and near-infrared (IR) wavelengths, making it possible to spatially resolve the disk with high-resolution imaging (Burrows et al., 1996). At mid-IR wavelengths, the outer disk is seen in absorption against the star and inner disk, allowing spectroscopic measurements of the disk composition (Watson et al., 2004; Pontoppidan et al., 2005). The sample of edge-on disks discovered to date remains small. Some of the most notable examples are Orion 114-426 (McCaughrean & O’Dell, 1996), Haro 6-5B (Krist et al., 1998), HH 30 (Burrows et al., 1996), IRAS 04302+2247 (Lucas & Roche, 1997; Padgett et al., 1999), DG Tau B (Padgett et al., 1999), OphE-MM3, CRBR 2422.8-3423 (Brandner et al., 2000), HK Tau B (Stapelfeldt et al., 1998; Koresko, 1998), HV Tau C (Monin & Bouvier, 2000), LkH 263 C (Jayawardhana et al., 2002; Chauvin et al., 2002), 2MASS J1628137-243139 (Grosso et al., 2003), and PDS 144 (Perrin et al., 2006). Additional young stars in Taurus exhibit dust lanes that may also trace edge-on disks (Hartmann et al., 1999; Padgett et al., 1999).
Because young stars with edge-on disks are seen only in scattered light at optical and near-IR wavelengths, they appear much fainter than unocculted young stars at a given spectral type. Recent spectroscopic surveys of nearby star-forming regions have identified a number of objects that are subluminous in this manner (Fernández & Comerón, 2001; Luhman et al., 2003; Slesnick et al., 2004). One of these sources, 2MASS J04381486+2611399 in Taurus (henceforth 2M 0438+2611), appears to be a brown dwarf with a mass near 0.05 (Luhman, 2004). This brown dwarf also exhibits anomalous near-IR colors and strong forbidden line emission, which are characteristics that are frequently observed in stars with edge-on disks. To definitively establish whether 2M 0438+2611 has an edge-on disk, we have observed it with near- and mid-IR spectroscopy and high-resolution optical imaging. In this paper, we present these new data (§ 2) and fit them with the predictions of accretion disk models to constrain the inclination and other physical properties of the disk around 2M 0438+2611 (§ 3).
2. Observations and Analysis
2.1. Near-infrared Spectroscopy
To investigate the possibility that 2M 0438+2611 is seen in scattered light, we first obtained a low-resolution near-IR spectrum of it with SpeX (Rayner et al., 2003) at the NASA Infrared Telescope Facility (IRTF). These data were collected on the night of 2004 November 12. They were reduced with the Spextool package (Cushing et al., 2004) and corrected for telluric absorption (Vacca et al., 2003). The final spectrum extends from 0.8-2.5 µm and exhibits a resolving power of .
For most of the young brown dwarfs that we have observed in previous studies (e.g., Luhman et al., 2006), the differences in the slopes of their 0.8-2.5 µm spectra are consistent with differences in extinction. However, this is not the case for 2M 0438+2611, which has an anomalous slope that differs significantly from those of other objects, regardless of any correction for extinction using standard reddening laws (Rieke & Lebofsky, 1985; Cardelli et al., 1989). This behavior is illustrated in Figure 1, where we compare 2M 0438+2611 to a typical unreddened young brown dwarf with the same optical spectral type111For the standard spectrum, we use SpeX data for 2MASS 04442713+2512164 (henceforth 2M 0444+2512, Luhman, 2004) after dereddening it by , which is the extinction implied by a comparison to other young brown dwarfs and to dwarf standards. Based on that comparison, the SpeX data for 2M 0444+2512 do not exhibit excess emission from a disk. The standard was artificially reddened according to the reddening law of Cardelli et al. (1989) to the point that it has the same relative fluxes at 0.8 and 2.5 as 2M 0438+2611. However, the shape of this reddened spectrum between 0.8 and 2.5 differs significantly from that of 2M 0438+2611. An alternative demonstration of this effect is shown in Figure 1 through the quotient these two spectra, which departs from the constant value expected for normal reddening. Thus, reddening cannot explain the observed slope of 2M 0438+2611. Instead, relative to the flux at 0.8 µm, the spectrum of 2M 0438+2611 becomes redder more slowly with longer wavelengths than expected from standard extinction laws, which is consistent with the presence of (blue) scattered light in the spectrum. Meanwhile, the absence of significant residuals in the quotient of 2M 0438+2611 and the standard demonstrates the close match in the depths of the steam absorption bands, supporting the similarity in spectral types indicated by previous optical spectroscopy.
2.2. Mid-infrared Spectroscopy
Photometry at 2 µm from the Two-Micron All-Sky Survey (2MASS, Skrutskie et al., 2006), at 3-8 µm from the Infrared Array Camera (IRAC; Fazio et al., 2004) aboard the Spitzer Space Telescope (Werner et al., 2004), and at 1.3 mm from the 30 m telescope at the Institut de Radio Astronomie Millimétrique (IRAM) have previously revealed excess emission in 2M 0438+2611 that is indicative of circumstellar dust (Luhman, 2004; Luhman et al., 2006; Scholz et al., 2006). To better constrain the properties of this material, we obtained a mid-IR spectrum of 2M 0438+2611 on 2005 March 19 with the Spitzer Infrared Spectrograph (IRS; Houck et al., 2004) as a part of the Guaranteed Time Observations of the IRS instrument team. These observations (AOR 12705792) were performed with the short-wavelength, low-resolution module of IRS, providing data from 5.3-14 µm with a resolving power of . The spectrum was processed with the S14 pipeline at the Spitzer Science Center. The remaining reduction was performed with the methods that have been previously applied to IRS data for other low-mass members of Taurus (Furlan et al., 2005). We have also measured photometry at 24 µm for 2M 0438+2611 from archival images obtained with the Multiband Imaging Photometer for Spitzer (MIPS; Rieke et al., 2004). Using the methods described by Allen et al. (2007), we measured a flux of mJy from these MIPS data.
We present the spectra from SpeX and IRS and the photometry from 2MASS, IRAC, MIPS, and IRAM for 2M 0438+2611 in Figure 2. The IRAC and IRS data agree well with each other, while the 2MASS photometry and the SpeX data differ significantly in both color and flux level. The SpeX data are consistent with a smooth extension of the IRAC and IRS data, while the 2MASS measurements appear to be discontinuous from the latter. The IRAC and IRS observations were performed only 4 months after the SpeX observations, while the 2MASS data were obtained 6 years earlier. Thus, one explanation for the discrepancy in the 2MASS photometry relative to the other data is variability, which is plausible for any young star and is particularly likely for an object that is seen in scattered light because of changes in the geometry of the occulting material. Therefore, we exclude the 2MASS photometry for the purposes of modeling the spectral energy distribution (SED) of 2M 0438+2611 in § 3.
2.3. Optical Imaging
Because of the initial evidence indicating that the SED of 2M 0438+2611 might be dominated by scattered light at optical and near-IR wavelengths (Luhman, 2004, § 2.1), we sought to detect spatially resolved scattered light through high-resolution broad-band optical imaging with the Hubble Space Telescope. In addition, given the presence of forbidden line emission in optical spectra of this brown dwarf (Luhman, 2004), we performed narrowband imaging centered on [O I] at 6300 Å in an attempt to detect resolved line emission from a jet or an outflow. Using the Wide Field Planetary Camera (WFPC2) aboard Hubble, we obtained images of 2M 0438+2611 through the F675W, F791W, F850LP, and F631N filters on 2005 October 22. The target was placed near the center of the PC, which has a plate scale of pixel-1. Two images were taken in each filter, each with exposure times of 160 sec for F675W, F791W, and F850LP and 300 sec for F631N. Each pair of images at a given filter was combined to create a single image.
In the [O I] image, 2M 0438+2611 is unresolved and no extended emission is detected. Meanwhile, each of the three broad-band images reveal both a point source and spatially resolved emission, as shown in Figure 4. The extended emission is elongated and reaches 0.4- from one side of the point source at a position angle of . Analysis of these images with the point-spread-function of WFPC2 indicates that a small amount () of extended emission is present on the opposite side of the point source as well.
3. Disk Model
3.1. Model Parameters
We have modeled the SED of 2M 0438+2611 in Figure 2 following the procedures from D’Alessio et al. (1998, 1999, 2001, 2006). In short, we solve the equations for the disk vertical structure, assuming it is an -disk heated by viscous dissipation and by stellar irradiation. The relatively high flux at 1.3 mm of this object (Scholz et al., 2006) suggests the presence of grains that are larger than typical grains in the interstellar medium. At the same time, the presence of the 10 µm silicate band and the shape of the extinction of the stellar SED are indicative of small grains. Therefore, we have constructed a disk model in which a large fraction of the dust has settled in the midplane, growing to a maximum size of mm, while a small fraction of the dust remains in the upper layers in the form of small interstellar-like grains (D’Alessio et al., 2006). The dust is assumed to be segregated spheres of “astronomical” silicates and graphite with abundances and optical constants from Draine & Lee (1984) and Weingartner & Draine (2001) and a size distribution of where is the grain radius (Mathis, Rumpl, & Nordsieck, 1977). For the small grains in the upper layers, the minimum and maximum grain radii are µm and µm. For the large grains at the disk midplane, we use µm and mm. The dust-to-gas mass ratio of the small grains is parameterized in terms of , which is the ratio normalized by the standard interstellar value of . We have calculated models for . The dust-to-gas mass ratio of the large grains at the midplane is calculated assuming that the total mass in grains is conserved at each radius.
In our model, the dusty disk is truncated at a radius , where the inner wall of the disk receives radiation from the brown dwarf and accretion shocks at the stellar surface with a normal incidence. A natural explanation for a wall of this kind is that the silicates are sublimated inside (Dullemond et al., 2001; Muzerolle et al., 2004). In this case, the temperature at the inner edge of the disk is K. However, disks can be truncated at larger radii, corresponding to lower temperatures (i.e., transitional disks). Therefore, we have modeled the wall emission following the procedures of (D’Alessio et al., 2005), varying the temperature of the optically thin dust in the wall from 300 to 1400 K. We have adopted an accretion rate of for our disk model, which is similar to the value derived by Muzerolle et al. (2005) for 2M 0438+2611 through modeling of the profile of its H emission line.
Although the disk surface density, , is not an input parameter for our models, we are able to modify it through the viscosity parameter since for an -disk. When fitting the millimeter flux, decreasing (i.e., increasing ) has the effect of decreasing the outer radius of the disk. After exploring models for , we find that the observed millimeter flux constrains to the low end of this range if the accretion rate in the outer disk is the same as the accretion rate onto the brown dwarf 222Disks around T Tauri stars have been modeled with (D’Alessio et al., 1998).. For a brown dwarf disk, implies a viscous timescale of Myr, which is too long to justify our assumption of a steady disk with a constant accretion rate throughout the disk. It is possible that the accretion rate increases with disk radius, as in the disk model from Gammie (1996). A higher accretion rate in the outer disk would correspond to lower and shorter . In a disk of this kind, material would accumulate in the inner disk, perhaps in a dead zone. Exploring this possibility in detail would require a disk model that includes a dead zone.
For the photosphere of 2M 0438+2611, we have adopted an effective temperature of 2838 K (Luhman, 2004). Because this object is seen in scattered light at optical and near-IR wavelengths (Luhman, 2004, § 2.1), its extinction cannot be measured from its colors. As a result, we cannot reliably measure its luminosity with the normal method of applying an extinction correction to photometry in these bands. Therefore, we have performed the disk calculations for a range of luminosities that are typical of members of Taurus near the spectral type of 2M 0438+2611, namely , 0.06, 0.08, and 0.1 . For 2M 0438+2611, we adopt a mass of 0.05 , which is the value implied by its spectral type for a member of Taurus (Luhman, 2004). As shown in Luhman (2004) and § 2.1, 2M 0444+2512 has the same optical and IR spectral types as 2M 0438+2611. In addition, although it exhibits mid-IR excess emission that indicates the presence of a disk (Luhman et al., 2006), 2M 0444+2512 does not show excess emission at wavelengths shortward of 2.5 µm in a comparison to SpeX data for diskless brown dwarfs near the same spectral type (Luhman, 2006). Therefore, we have adopted the extinction-corrected SpeX data for 2M 0444+2512 described in § 2.1 to represent the 0.8-2.5 µm SED of the photosphere of 2M 0438+2611. We assume that both 2M 0438+2611 and 2M 0444+2512 are at the average distance of members of Taurus ( pc, Wichmann et al., 1998). We measured the average colors between 2MASS and the IRAC bands (3.6, 4.5, 5.8, 8.0 µm) for diskless late-type members of Taurus (Hartmann et al., 2005; Luhman et al., 2006) and applied them to the SpeX data for 2M 0444+2512 to extend the photospheric SED to 8.0 µm. The SED was extrapolated to wavelengths beyond 8.0 µm with a Rayleigh-Jeans distribution.
3.2. Best-fit Model
A given portion of the observed SED provides constraints on specific properties of the disk. We use the -band flux to estimate the optical depth to the brown dwarf, which in turn constrains the inclination, outer radius, and viscosity parameter of the disk. The silicate feature near 10 µm is sensitive to both the inclination and the presence of small grains in the upper layers of the disk. The abundance of these small grains is constrained by the 24 µm flux relative to the emission at shorter wavelengths. The flux at 3-10 µm depends on the inner radius of the disk and the stellar luminosity, while the millimeter flux is determined by a combination of the outer radius and the surface density. In this section, we discuss each of these constraints in detail for 2M 0438+2611 and present the resulting best-fit model for its disk.
The best fit to the flux at 3-10 µm is provided by a stellar luminosity of 0.06 (corresponding to ) and a radius of AU for the wall, which corresponds to a wall temperature of 400 K. For models with the wall placed at the dust destruction radius, the predicted fluxes at 3-10 µm are brighter than the observed values. Thus, our modeling indicates that the disk is inwardly truncated. The inner disk of 2M 0438+2611 shows the same physical properties as disks that have been identified in the literature as “transitional disks”, and which have been shown to have truncated optically thick disks at various distances from the central stars, from both SED modeling (Calvet et al., 2002, 2005; D’Alessio et al., 2005; Muzerolle et al., 2006) and millimeter interferometry (Hughes et al., 2007). Disks of this kind are thought to harbor forming planets that are opening gaps in the disk (Rice et al., 2003; Quillen et al., 2004). Photoevaporation is an alternative explanation for these disk gaps, but it is unlikely for 2M 0438+2611 given the low ultraviolet fluxes that are expected from a brown dwarf (Muzerolle et al., 2006).
For all reasonable choices of model parameters, the reddened flux from the stellar photosphere should dominate the total emergent flux at -3 µm. Combining the luminosity of 0.06 and the observed -band flux produces a value of for the optical depth to the photosphere.
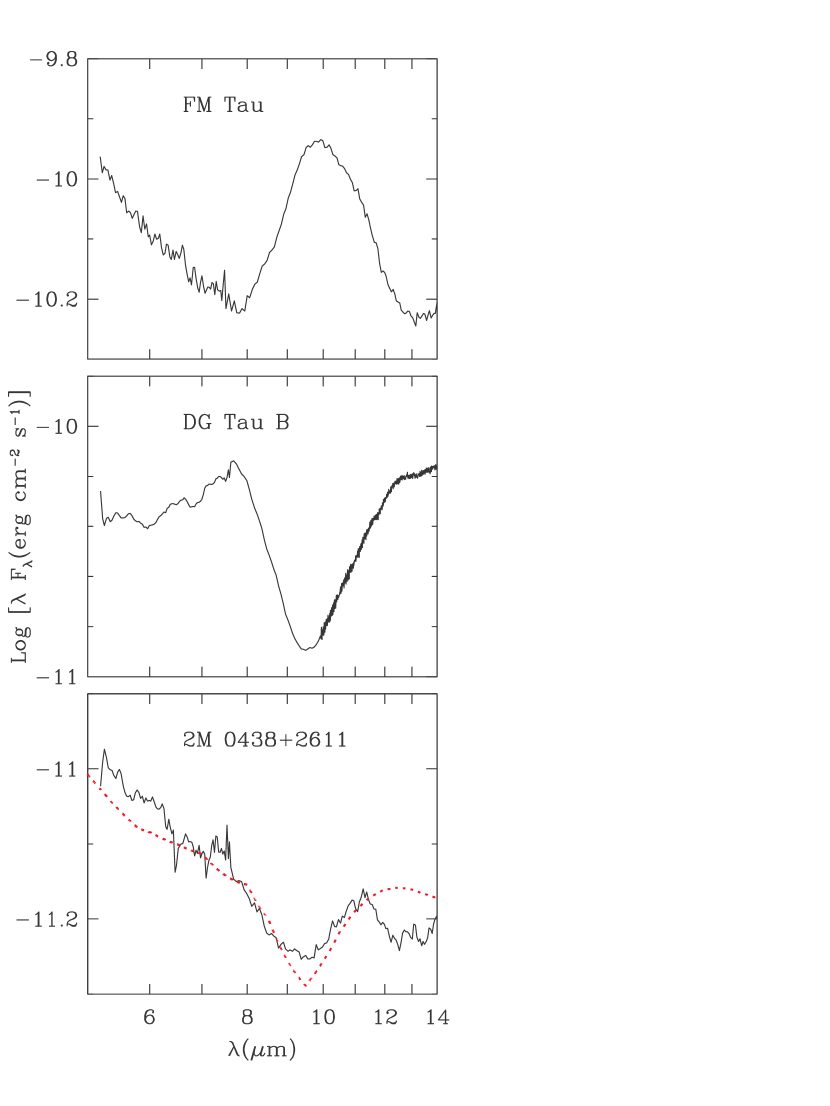
The 10 µm silicate profile of 2M 0438+2611 is distinctive, showing both absorption and emission components. This profile tightly constrains the disk inclination because small angles produce only emission and large ones produce only absorption, as illustrated for the face-on and edge-on disks around FM Tau and DG Tau B in Figure 3 (Watson et al., 2004; Furlan et al., 2006). For , the model predicts silicate emission from the disk and silicate absorption from the highly extinguished wall that combine to form absorption and emission features at 10 and 11 µm, which closely matches the data, as shown in Figure 3. While modeling IR and millimeter photometry for 2M 0438+2611, Scholz et al. (2006) also used a high inclination angle of for their model of this disk. A high inclination was produced by their model because 2M 0438+2611 is much fainter than the photosphere of typical young brown dwarfs, so a highly inclined, obscuring disk was needed to suppress the near- and mid-IR fluxes of their adopted photospheric template to the observed levels. Thus, their evidence for a high inclination disk was equivalent to that presented by Luhman (2004), who showed that 2M 0438+2611 is anomalously faint at near-IR wavelengths for its spectral type and might be occulted by circumstellar material. The distinctive silicate features in our IRS spectra (as well as the extended emission in the WFPC2 images) represent new evidence of a highly-inclined disk around 2M 0438+2611. Scholz et al. (2006) suggested that the disk around 2M 0444+2512 also might have a high inclination. However, the slope of its near-IR spectrum is consistent with a small amount of extinction and a normal reddening law, and thus does not indicate the presence of scattered light. In addition, an unpublished IRS spectrum of 2M 0444+2512 does not show the silicate absorption that is seen in 2M 0438+2611 and other highly-inclined disks (Figure 3).
The flux at 24 µm is sensitive to the degree of dust settling in the disk. We find that small grain abundances of in the upper layers of the disk are required to explain the observed 24 µm flux. For values of that are outside of this range, the predicted slope of the mid- and far-IR SED is smaller or larger than the observed one.
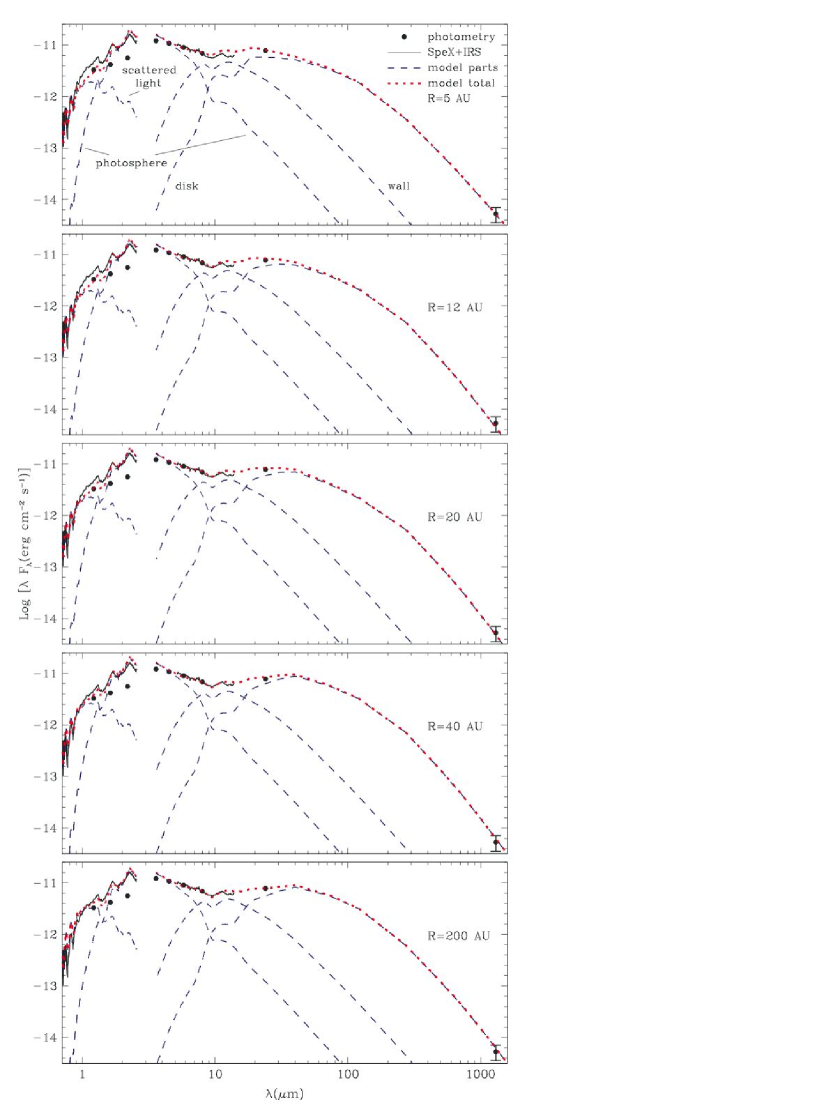
In Table 1, we summarize the models that provide the best fits to the SED of 2M 0438+2611 for five values of . The SEDs produced by these models are shown with the observed SED in Figure 2. These models reproduce the observed SED longward of 2 µm equally well, while the model for provides a somewhat better match to the flux at shorter wavelengths. The disk radii of these models range from 5 to 200 AU. Thus, the SED alone does not provide a useful constraint on the outer radius of the disk.
To estimate the disk radius for 2M 0438+2611, we compare the images produced by each of our five models to the WFPC2 images in Figure 4. The WFPC2 data show a central peak surrounded by asymmetric bipolar emission. In comparison, the model images for and 12 AU show a point source and no detectable extended emission and the model for AU produces too much extended emission. Meanwhile, the images from the models for and 40 AU agree reasonably well with the WFPC2 images of 2M 0438+2611. The relative fluxes of the two lobes of emission are better matched by the model for AU, while the length of the extended emission is better matched by AU. Thus, the WFPC2 images constrain the disk radius to be -40 AU and confirm the high inclination that is implied by the SED analysis. In addition, given that the model images are formed by stellar light scattered at the disk surface and extinguished by the outer disk, the agreement between the optical SED and the predicted scattered light spectrum and flux level (Figure 2) is further evidence supporting our estimate of the depletion factor of small grains in the upper disk layers.
4. Conclusions
The young brown dwarf 2M 0438+2611 exhibits several characteristics that are often observed in stars with edge-on disks, such as unusually faint near-IR fluxes for its spectral type, strong emission in forbidden transitions, and anomalous near-IR colors (Luhman, 2004). Through observations presented in this paper, we have confirmed that 2M 0438+2611 is occulted by a highly inclined disk. This new evidence is summarized as follows:
-
1.
Based on a comparison to other young brown dwarfs, the slope of the 0.8-2.5 µm spectrum of 2M 0438+2611 cannot be explained as a photosphere reddened by a standard extinction law and instead is consistent with scattered light, which suggests that the brown dwarf is occulted by circumstellar material.
-
2.
The presence of silicate absorption at µm and silicate emission at µm constrains the disk inclination angle to be near (i.e., from edge-on) because higher or lower inclinations would produce only absorption or emission, respectively.
-
3.
We detect asymmetric bipolar emission in WFPC2 images of 2M 0438+2611, which is consistent with simulated scattered-light images produced our model of a highly-inclined disk around this brown dwarf.
In addition to its inclination, we have been able to constrain several other properties of the disk around 2M 0438+2611 through modeling of its SED and high-resolution images. These constraints are made possible by the unusual wealth of data available for this disk, although achieving a self-consistent model that simultaneously reproduces those data has proved to be quite challenging. In our best-fit models, the disk has an inclination of , an inner radius of AU, an outer radius of 20-40 AU, a total mass of 100-200 , and an abundance of small grains in its upper layers of , indicating a large degree of settling to the midplane. Our estimate of the inner radius suggests the presence of a large inner hole, which is a characteristic of transitional disks (Calvet et al., 2002, 2005; D’Alessio et al., 2005; Muzerolle et al., 2006). Meanwhile, the outer radius of the disk around 2M 0438+2611 is somewhat larger than expected from models of embryo ejection (-20 AU, Bate et al., 2003).
References
- Allen et al. (2007) Allen, P. R., et al. 2007, ApJ, 655, 1095
- Bate et al. (2003) Bate, M. R., Bonnell, I. A., & Bromm, V. 2003, MNRAS, 339, 577
- Brandner et al. (2000) Brandner, W., et al. 2000, A&A, 364, L13
- Burrows et al. (1996) Burrows, C. J., et al. 1996, ApJ, 473, 437
- Calvet et al. (2002) Calvet, N., D’Alessio, P., Hartmann, L., Wilner, D., Walsh, A., & Sitko, M. 2002, ApJ, 568, 1008
- Calvet et al. (2005) Calvet, N., et al. 2005, ApJ, 630, L185
- Cardelli et al. (1989) Cardelli, J. A., Clayton, G. C., & Mathis, J. S. 1989, ApJ, 345, 245
- Chauvin et al. (2002) Chauvin, G., et al. 2002, A&A, 394, 949
- Cushing et al. (2004) Cushing, M. C., Vacca, W. D., & Rayner, J. T. 2004, PASP, 116, 362
- D’Alessio et al. (2001) D’Alessio, P., Calvet, N., & Hartmann, L. 2001, ApJ, 553, 321
- D’Alessio et al. (2006) D’Alessio, P., Calvet, N., Hartmann, L., Franco-Hernández, R., & Servín, H. 2006, ApJ, 638, 314
- D’Alessio et al. (1999) D’Alessio, P., Calvet, N., Hartmann, L., Lizano, S., & Cantó, J. 1999, ApJ, 527, 893
- D’Alessio et al. (1998) D’Alessio, P., Canto, J., Calvet, N., & Lizano, S. 1998, ApJ, 500, 411
- D’Alessio et al. (2005) D’Alessio, P., et al. 2005, ApJ, 621, 461
- Draine & Lee (1984) Draine, B. T. & Lee, H. M. 1984, ApJ, 285, 99
- Dullemond et al. (2001) Dullemond, C. P., Dominik, C., & Natta, A. 2001, ApJ, 560, 957
- Fazio et al. (2004) Fazio, G. G., et al. 2004, ApJS, 154, 10
- Fernández & Comerón (2001) Fernández, M., & Comerón, F. 2001, A&A, 380, 264
- Furlan et al. (2005) Furlan, E., et al. 2005, ApJ, 621, L129
- Furlan et al. (2006) Furlan, E., et al. 2006, ApJS, 165, 568
- Gammie (1996) Gammie, C. F. 1996, ApJ, 457, 355
- Grosso et al. (2003) Grosso, N., Alves, J., Wood, K., Neuhäuser, R., Montmerle, T., Bjorkman, J. E. 2003, ApJ, 586, 296
- Hartmann et al. (1999) Hartmann, L., Calvet, N., Allen, L., Chen, H., & Jayawardhana, R. 1999, AJ, 118, 1784
- Hartmann et al. (2005) Hartmann, L., et al. 2005, ApJ, 629, 881
- Houck et al. (2004) Houck, J. R., et al. 2004, ApJS, 154, 18
- Hughes et al. (2007) Hughes, A. M., et al. 2007, ApJ, submitted
- Jayawardhana et al. (2002) Jayawardhana, R., Luhman, K. L., D’Alessio, P., & Stauffer, J. R. 2002, ApJ, 571, L51
- Koresko (1998) Koresko, C. D. 1998, ApJ, 507, L145
- Krist et al. (1998) Krist, J. E., et al. 1998, ApJ, 501, 841
- Lucas & Roche (1997) Lucas, P. W., & Roche, P. F. 1997, MNRAS, 286, 895
- Luhman (2004) Luhman, K. L. 2004, ApJ, 617, 1216
- Luhman (2006) Luhman, K. L. 2006, ApJ, 645, 676
- Luhman et al. (2003) Luhman, K. L., Stauffer, J. R., Muench, A. A., Rieke, G. H., Lada, E. A., Bouvier, J., & Lada, C. J. 2003, ApJ, 593, 1093
- Luhman et al. (2006) Luhman, K. L., Whitney, B. A., Meade, M. R., Babler, B. L., Indebetouw, R., Bracker, S., & Churchwell, E. B. 2006, ApJ, 647, 1180
- Mathis, Rumpl, & Nordsieck (1977) Mathis, J. S., Rumpl,W. & Nordsieck, K. H. 1977, ApJ, 217, 425
- McCaughrean & O’Dell (1996) McCaughrean, M. J., & O’Dell, R. C. 1996, AJ, 111, 1977
- Monin & Bouvier (2000) Monin, J.-L., & Bouvier, J. 2000, A&A, 356, L75
- Muzerolle et al. (2004) Muzerolle, J., D’Alessio, P., Calvet, N., & Hartmann, L. 2004, ApJ, 617, 406
- Muzerolle et al. (2005) Muzerolle, J., Luhman, K. L., Briceño, C., Hartmann, L., & Calvet, N. 2005, ApJ, 625, 906
- Muzerolle et al. (2006) Muzerolle, J., et al. 2006, 643, 1003
- Padgett et al. (1999) Padgett, D. L., et al. 1999, AJ, 117, 1490
- Perrin et al. (2006) Perrin, M. D., Duchêne, G., Kalas, P., & Graham, J. R. 2006, ApJ, 645, 1272
- Pontoppidan et al. (2005) Pontoppidan, K. M., et al. 2005, ApJ, 622, 463
- Quillen et al. (2004) Quillen, A. C., Blackman, E. G., Frank, A., & Varnière, P. 2004, ApJ, 612, L137
- Rayner et al. (2003) Rayner, J. T., et al. 2003, PASP, 115, 362
- Rice et al. (2003) Rice, W. K. M., Wood, K., Armitage, P. J., Whitney, B. A., & Bjorkman, J. E. 2003, MNRAS, 342, 79
- Rieke & Lebofsky (1985) Rieke, G. H., & Lebofsky, M. J. 1985, ApJ, 288, 618
- Rieke et al. (2004) Rieke, G. H. et al. 2004, ApJS, 154, 25
- Scholz et al. (2006) Scholz, A., Jayawardhana, R., & Wood, K. 2006, ApJ, 645, 1498
- Skrutskie et al. (2006) Skrutskie, M., et al. 2006, AJ, 131, 1163
- Slesnick et al. (2004) Slesnick, C. L., Hillenbrand, L. A., & Carpenter, J. M. 2004, ApJ, 610, 1045
- Stapelfeldt et al. (1998) Stapelfeldt, K. R., et al. 1998, ApJ, 502, L65
- Vacca et al. (2003) Vacca, W. D., Cushing, M. C., & Rayner J. T., 2003, PASP, 115, 389
- Watson et al. (2004) Watson, D. M., et al. 2004, ApJS, 154, 391
- Weingartner & Draine (2001) Weingartner, J. C., & Draine, B. T. 2001, ApJ, 548, 296
- Werner et al. (2004) Werner, M. W., et al. 2004, ApJS, 154, 1
- Wichmann et al. (1998) Wichmann, R., Bastian, U., Krautter, J., Jankovics, I., & Ruciński, S. M. 1998, MNRAS, 301, L39
| () | (AU) | () | (deg) | |
|---|---|---|---|---|
| 0.05 | 5 | 700 | 68 | 0.04 |
| 0.5 | 12 | 140 | 70 | 0.03 |
| 0.8 | 20 | 130 | 71 | 0.03 |
| 1 | 40 | 190 | 67 | 0.09 |
| 2 | 200 | 340 | 70 | 0.09 |