Measuring the Decoherence of a Quantronium Qubit with the Cavity Bifurcation Amplifier
Abstract
Dispersive readouts for superconducting qubits have the advantage of speed and minimal invasiveness. We have developed such an amplifier, the Cavity Bifurcation Amplifier (CBA) etienne , and applied it to the readout of the quantronium qubit vion . It consists of a Josephson junction embedded in a microwave on-chip resonator. In contrast with the Josephson bifurcation amplifier siddiqi-qm , which has an on-chip capacitor shunting a junction, the resonator is based on a simple coplanar waveguide imposing a pre-determined frequency and whose other RF characteristics like the quality factor are easily controlled and optimized. Under proper microwave irradiation conditions, the CBA has two metastable states. Which state is adopted by the CBA depends on the state of a quantronium qubit coupled to the CBA’s junction. Due to the MHz repetition rate and large signal to noise ratio we can show directly that the coherence is limited by 1/f gate charge noise when biased at the “sweet spot” – a point insensitive to first order gate charge fluctuations. This architecture lends itself to scalable quantum computing using a multi-resonator chip with multiplexed readouts.
I Introduction
Quantum circuits based on Josephson junctions are candidates for the fundamental building block of a quantum computer - a quantum bit, or qubit qcircuits . Several implementations have been tested vion ; Delft-echo ; Semba ; Clarke ; Rob ; Martinis ; qlab-JQ , which may be distinguished by the variable controlling the state of the qubit (charge, flux or phase) and the technique used for the readout. These systems can be individually addressed, controlled and read, making them some of the most advanced solid state qubits.
An enabling characteristic of many superconducting qubits is the existence of an optimal bias point where the qubit is immune to first order to fluctuations in external control parameters. Nonetheless, even systems operated at this “sweet spot” have coherence times limited by second order fluctuations of the external control parameters schon . In this paper we describe measurements of a quantronium qubit operated at this optimal bias point vion ; qlab-JQ employing the newly developed Cavity Bifurcation Amplifier (CBA) – a fast, dispersive, scalable readout system based on a driven non-linear superconducting resonator etienne ; vladimir . With this architecture we can measure the fluctuations in the quantronium’s coherence on time scales as short as a second, allowing us to probe the 1/f property of charge noise on these scales. These measurements confirm previous studies of the limitations of coherence times in charge qubits schon ; Nak-noise and casts additional light on the fluctuating character of itself and how its value depends on the measurement protocol.
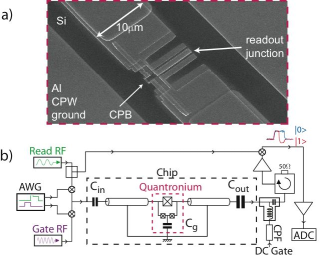
The non-linearity of the CBA is provided by a Josephson junction placed in the center of a /2 on-chip coplanar waveguide resonator with both an input and output coupling capacitor playing the role of Fabry-Perot cavity mirrors (see Fig 1.) When driven with a microwave signal at frequency such that , where is the resonator small oscillation natural frequency and the loaded quality factor, this system can have two dynamical metastable states which differ by their oscillation amplitude and phase. As the driving power is ramped past the bifurcation power , the CBA switches from the state of low amplitude to the state with high amplitude. We detect the state of the non-linear oscillator by monitoring the amplitude and phase change of the microwave signal transmitted by the resonator. In parallel with the CBA’s junction we place a split Cooper pair box (SCPB), a circuit known as the quantronium, giving the resonator two bifurcation powers and depending on the state of the qubit, or . The two qubit states are mapped into the two metastable states of the CBA by ramping quickly the power to a level intermediate between and . If the quantronium qubit is in , the CBA will switch to the high oscillating state, whereas if it is in the CBA will remain in the low oscillating state.
This readout has the advantage of being non-dissipative as the readout junction never switches into the normal state, unlike the original DC-biased quantronium readout vion . This dispersive readout minimally disturbs the qubit state and since after switching we do not need to wait for quasiparticles to relax, the repetition rate is only limited by the relaxation time, , of our qubit and the of our resonator. Like the DC readout, the CBA readout can latch siddiqi-qm , allowing enough time for the measurement of the complex amplitude of the transmitted wave, and therefore excellent signal to noise ratio. These characteristics were also present in the Josephson bifurcation amplifier siddiqi ; siddiqi-qm ; qlab-JQ , which implemented a bifurcating non-linear oscillator using a lumped element capacitor in parallel with the junction. However this capacitor was fabricated using a Cu/Si3N4/Al multilayer structure which was difficult to fabricate and integrate with more then one qubit. Also the parallel plate geometry suffered from inherent stray inductive elements. In contrast, the CBA is fabricated using a simple coplanar waveguide geometry with no stray elements. The resonance frequency and the quality factor are controlled by the resonator length and output capacitor respectively. The CBA geometry thus offers the possibility of designing a multi-resonator chip with multiplexed readouts, which would accommodate up to 10 qubits at once, an important step towards scalable quantum computing. The present work, in addition to the assessment of 1/f noise in a new architecture, is a first step in this direction.
II Sample fabrication and characterization
The resonator is initially fabricated using photolithography on a bare Si wafer Luigi . A LOR5A/S1813 optical resist bilayer is used and the development is optimized to have at least 50nm of undercut beneath the S1813 to avoid wavy edges and to obtain a sloped edge on the resonator. This sloped edge is obtained by evaporating a 200nm thick Al layer onto the sample at 0.2 nm/s with an angle of and with a stage rotation of /s. Next the quantronium is fabricated using electron beam lithography. We use a MMA/PMMA resist bilayer and the Dolan bridge double angle evaporation technique to fabricate our junctions Dolan . For this sample the split Cooper pair box is fabricated first inside the resonator, followed by the readout junction in a separate step using new e-beam resist. Using a hollow cathode Ar ion gun we obtain an ohmic contact between the two e-beam layers and the resonator.
For the qubit sample described in this paper, we have been working with a linear regime resonance frequency and a of 160. An on-chip twin (Fig 1a) of the SCPB of the quantronium had a normal state resistance of , with small junction areas of m2. The usual gate line of the quantronium is absent in our design since we use the readout lines to access both the RF and DC gate lines, another advantage of this configuration.
III Qubit characterization
We performed gate charge and flux modulations while keeping the qubit in its ground state, to check that we have flux periodicity and 2e charge periodicity, as shown in Fig 2.
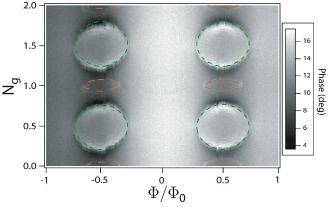
The readout was first operated in the weakly non-linear mode () and we measured changes in the phase of the transmitted signal as the gate charge and flux were varied, keeping the frequency fixed at the maximal phase response point (see Fig 2). Apart from a slow background modulation due to the changing susceptibility of the ground state, we observe sharp contrast on contours of ellipsoidal shape. These can be interpreted as contours of constant qubit transition frequency coinciding with the readout frequency or its double, an effect similar to that observed by Wallraff et al. Rob . Using the well known expressions for the energy levels of the quantronium cottet , we can reproduce the shape of these contours, within the uncertainty due to the low frequency gate charge and flux noises, and extract a Jospehson energy of the SCPB of and charging energy of , where is the sum of the capacitances of the junctions in the SCPB and the gate capacitance.
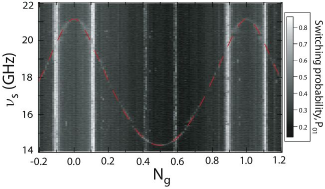
To get a more precise measurement of and , we performed spectroscopy on the qubit by applying a weakly exciting long pulse, followed by a latching readout pulse. The switching probability between the two metastable states of the CBA is measured as the spectroscopic frequency is swept for each gate charge step, at zero flux. Due to the crosstalk between the readout and the qubit, we have to ensure that we have zero leakage of spectroscopic power outside our pulse. This is achieved by gating the LO on the mixers shaping our pulses with a pulse shape a few ns longer then the spectroscopic pulse. As a function of frequency, we find a peak in switching probability, whose position varies with gate charge with the expected sinusoidal-like shape shown in Fig 3. The theoretical fit, shown in red, refines the previous determination of and to the values and . Zooming in to the double “sweet spot”, , , where the qubit is immune to charge and flux noise to first order, we measure a Lorentzian spectroscopic peak of width and a Larmor frequency . This gives a dephasing time, of . However, large charge jumps move the biasing point off the “sweet spot” causing the linewidth to be widened. More accurate measurements of will be obtained from Ramsey fringes where we can follow the variation of with time.
IV Qubit manipulation and coherence experiments
Once the qubit parameters are known, we can perform experiments on the qubit to determine the qubit’s quality in terms of its energy relaxation time and dephasing time . An essential part of these experiments is the need to control the state of the qubit precisely. This is achieved by applying a microwave pulse to the gate with rectangular envelope, of amplitude , and time length . In a frame rotating at the gate pulse carrier frequency, , the qubit state then precesses at a frequency, given by cottet :
| (1) |
where the Rabi frequency rabi involves the gate modulation ampitude in units of Cooper pairs and charge operator matrix element between the excited and ground states . For we have free evolution at the Ramsey frequency ramsey .
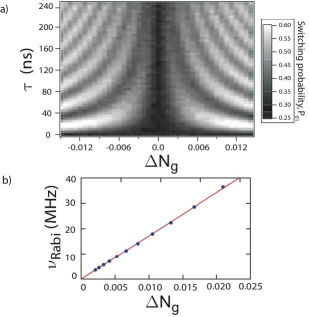
We begin by measuring the Rabi oscillations. The pulse sequence protocol involves a gate pulse with fixed and varying amplitude, , and time length , followed by a latching readout pulse. The sequence is repeated times to measure the switching probability. The oscillations of the switching probability as a function of and are plotted in Fig 4. The extracted frequency scales linearly (Fig 4b) as expected from a two-level system. From the position of the first maximum of the Rabi oscillations we can calibrate the pulse time length needed for a -pulse, which drives the qubit from the ground state to the excited state. Using this -pulse we measure the exponential decay of the population of the excited state (data not shown) and obtain the relaxation time which, during the course of an experimental run, varied between and , with a persistence time of a few seconds. These values are comparable to the results of Vion et al. vion and Siddiqi et al. qlab-JQ .
The maximum constrast measured is about 60%, lower then the maximum contrast of over 99.9%, calculated for the ideal case of a non-relaxing qubit given the measured parameters of the resonator. This loss can be attributed to three main sources. First the qubit relaxes before the readout takes place, because of its finite , resulting in a 10% loss in contrast. Second the qubit relaxes to the ground state as the readout voltage approaches the bifurcation voltage, resulting in a further 25% loss in contrast. Other measurements (not described here) have suggested that this loss in contrast could be from Stark shifting the qubit to lower frequencies during readout, where it can come in resonance with spurious transitions, possibly due to defects in the substrate or in the tunnel barrier. The remaining loss could be accounted for by the fact that the transition between the two oscillating states of the CBA is broadened by more than a factor of 5 from that expected.
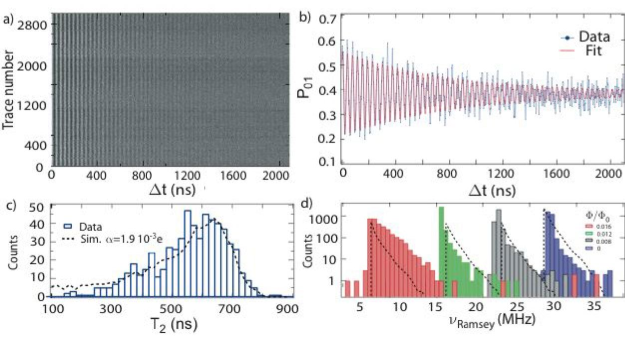
To measure the coherence time, , we follow a different pulse protocol in which we apply two pulses separated by a free evolution period of length , followed by a readout measurement. An example of the resulting Ramsey fringes is shown in Fig 5b. By fitting to an exponentially decaying sinusoid we extract . The frequency of Ramsey fringes is well fitted by the absolute value of the detuning , yielding a precise measurement of . We follow the time evolution of and by recording a Ramsey fringe every (Fig 5a). We observe a variation of from to . The distribution of is an asymmetric bell shaped curve peaking around , with a long tail extending down to (Fig 5c). If we would average over a period (3000 of the above Ramsey traces) we would measure an average which converges to , similar to the first Saclay result vion obtained with a qubit with a similar . The fluctuations are correlated with fluctuations in the Ramsey frequency, which only fluctuates towards higher frequencies, giving lopsided distributions, as shown on Fig 5d. At the “sweet spot” where we are working, variations in gate charge necessarily increase the transition frequency whereas variations in flux decrease it. Variations in critical current would supposedly keep the distribution of frequencies more symmetric. We can therefore conclude that charge noise, not flux noise, is the dominant source of decoherence in our sample. Furthermore, if we suppose that the charge noise is Gaussian with a spectral density that has the usually invoked 1/f form Oneoverf given by , we can check if our data can be explained by this model. This was carried out by directly numerically simulating the corresponding variations in transition frequency and calculating the Ramsey signal in the conditions of the experiment. The distributions of both the extracted and are shown by the dashed lines in Fig 5c and d. We obtain good agreement with the data for a noise amplitude of , agreeing with the range of previously measured values of this noise intensity parameter. To reduce sensitivity to this charge noise we can make the energy levels of the qubit almost insensitive to charge by increasing the areas of the junctions in the SCPB and hence increasing . An of 8 could give a in the ms range and hence this device would be limited.
V Conclusion
We have successfully implemented an improved version of the bifurcation amplifier based on an on-chip CPW resonator as a readout for the quantronium qubit. It offers ease of fabrication and a larger range of operating parameters (, Q) compared to the original JBA implementation qlab-JQ . Using this readout which captures in real time the fluctuations in qubit parameters, we have demonstrated that the main source of decoherence in our sample is charge noise. By using a larger , we could reduce the curvature with gate charge of the levels of the Cooper pair box and we should be able to reduce the charge noise induced decoherence transmon . Furthermore, the CBA geometry is particularly well adapted to the multiplexing of the simultaneous readout of several qubits. We have started in this direction by successfully measuring the bifurcation of 5 CBAs with only one input and one output line. This configuration offers a path for scaling up of superconducting circuits up to several tens of qubits.
The authors would like to thank D. Esteve, S. Fissette, J.M. Gambetta, S. Girvin, D. Prober and D. Vion for useful discussions and assistance. This work was supported by NSA through ARO grant No. W911NF-05-01-0365, the Keck foundation, and the NSF through grant No. DMR-032-5580. L. Frunzio acknowledges partial support from CNR-Istituto di Cibernetica, Pozzuoli, Italy.
References
- (1) M. H. Devoret, J. M. Martinis, Quant. Infor. Proc. 3, Nos 1-5 (2004); M. H. Devoret, Fluctuations Quantiques / Quantum Fluctuations: Les Houches Session LXIII, June 27 - July 28, 1995. A UJFG / a NATO Advanced Study Institute conference. Edited by S. Reynaud, E. Giacobino and J. Zinn-Justin. ISBN 0444-82593- 2. Published by Elsevier, Amsterdam, The Netherlands, 1997, p.351
- (2) D. Vion, A. Aassime, A. Cottet, P. Joyez, H. Pothier, C. Urbina, D. Esteve and M. H. Devoret, Science 296, 866 (2002)
- (3) P. Bertet, I. Chiorescu, G. Burkard, K. Semba, C. J. P. M. Harmans, D.P. DiVincenzo, J. E. Mooij, Phys. Rev. Lett. 95, 257002 (2005)
- (4) T. Kutsuzawa, H. Tanaka, S. Saito, H. Nakano, K. Semba, and H. Takayanagi, Appl. Phys. Lett. 87, 073501 (2005).
- (5) B.L.T. Plourde, T.L. Robertson, P.A. Reichardt, T. Hime, S. Linzen, C.-E. Wu, and J. Clarke, Phys. Rev. B, 72, 060506 (2005).
- (6) A. Wallraff, D. I. Schuster, A. Blais, L. Frunzio, R.- S. Huang, J. Majer, S. Kumar, S. M. Girvin, R. J. Schoelkopf, Nature 431, 162, (2004)
- (7) R. McDermott, R. W. Simmonds, M. Steffen, K. B. Cooper, K. Cicak, K. D. Osborn, Seongshik Oh, D. P. Pappas and J. M. Martinis, Science 307, 1299 (2005).
- (8) I. Siddiqi, R. Vijay, M. Metcalfe, E. Boaknin, L. Frunzio, R. J. Schoelkopf and M. H. Devoret, Phys. Rev. B 73, 054510 (2006)
- (9) V.E. Manucharyan, E. Boaknin, M. Metcalfe, R. Vijay, I. Siddiqi, M. H. Devoret, cond-mat/0612576 (2006)
- (10) E. Boaknin, V.E. Manucharyan, S. Fissette, M. Metcalfe, L. Frunzio, R. Vijay, I. Siddiqi, A. Wallraff, R. J. Schoelkopf, M. H. Devoret, cond-mat/0702445 (2007)
- (11) G. Ithier, E. Collin, P. J. Meeson, D. Vion, D. Esteve, F. Chiarello, A. Shnirman, Y. Makhlin, J. Schriefl, G. Schön, Phys. Rev. B, 72, 134519, (2005)
- (12) Y. Nakamura, Yu. A. Pashkin, T. Yamamoto, J. S. Tsai, Phys. Rev. Lett., 88, 047901, (2002)
- (13) I. Siddiqi, R. Vijay, F. Pierre, C.M. Wilson, L. Frunzio, M. Metcalfe, C. Rigetti, R.J. Schoelkopf, M.H. Devoret, D. Vion, and D.E. Esteve, Phys. Rev. Lett., 94, 027005 (2005).
- (14) L. Frunzio, A. Wallraff, D. Schuster, J. Majer, R.J. Schoelkopf, IEEE Trans. Apl. Supercond., 15, 860, (2005).
- (15) G. J. Dolan, Appl. Phys. Lett., 31, 337, (1977).
- (16) A. Cottet, Thesis, 2002
- (17) I. Siddiqi, R. Vijay, F. Pierre, C.M. Wilson, M. Metcalfe, C. Rigetti, R.J. Schoelkopf, M.H. Devoret, Phys. Rev. Lett., 93, 207002, (2004)
- (18) I. I. Rabi, Phys. Rev, 51, 652, (1937)
- (19) N. F. Ramsey, Phys. Rev, 78 695, (1950)
- (20) A. B. Zorin, F.J. Ahlers, J. Niemeyer, T. Weimann, H. Wolf, V. A. Krupenin and S. V. Lotkhov, Phys. Rev. B, 53, 13682, (1996)
- (21) D. I. Schuster, A. A. Houck, J. A. Schreier, A. Wallraff, J. M. Gambetta, A. Blais, L. Frunzio, B.Johnson, M. H. Devoret, S. M. Girvin, and R. J. Schoelkopf, Nature (London), 445, 515, (2007)