33email: aasensio@iac.es, Cecilia.Ceccarelli@obs.ujf-grenoble.fr, moshe@pa.uky.edu
H2D+ line emission in Proto-Planetary Disks
Abstract
Context. Previous studies have indicated that the 372.4 GHz ground transition of ortho-H2D+ might be a powerful probe of Proto-Planetary Disks. The line could be especially suited for study of the disk mid-plane, where the bulk of the mass resides and where planet formation takes place.
Aims. Provide detailed theoretical predictions for the line intensity, profile and maps expected for representative disk models.
Methods. We determine the physical and chemical structure of the disks from the model developed by Ceccarelli & Dominik (2005). The line emission is computed with the new radiative transfer method developed recently by Elitzur & Asensio Ramos (2006).
Results. We present intensity maps convolved with the expected ALMA resolution, which delineate the origin of the H2D+ 372.4 GHz line. In the disk inner regions, the line probes the conditions in the mid-plane out to radial distances of a few tens of AU, where Solar-like planetary systems might form. In the disk outermost regions, the line originates from slightly above the mid-plane. When the disk is spatially resolved, the variation of line profile across the image provides important information about the velocity field. Spectral profiles of the entire disk flux show a double peak shape at most inclination angles.
Conclusions. Our study confirms that the 372.4 GHz H2D+ line provides powerful diagnostics of the mid-plane of Proto-Planetary Disks. Current submillimeter telescopes are capable of observing this line, though with some difficulties. The future ALMA interferometer will have the sensitivity to observe and even spatially resolve the H2D+ line emission.
Key Words.:
ISM: abundances — ISM: molecules — stars: formation1 Introduction
Proto-Planetary Disks are believed to mark the transition between the protostellar phase and planet formation. Similar to “standard” molecular clouds, young Proto-Planetary Disks are gas rich, with gas to dust mass ratio of 100, and their dust grains have average sizes of 0.1 m. As the disk evolves with time, the dust grains coagulate into progressively larger bodies — the seeds for planet formation. The gas is dispersed via viscous accretion and/or evaporation (e.g. Adams et al. 2004). Following the details of this evolution is of paramount importance for understanding the process of planet formation. Especially relevant in this context is the disk mid-plane because it contains the bulk of the mass and because its magneto-rotational instabilities are believed to be a major source of the disk viscous accretion (Gammie 1996); thus determining the degree of ionization is also of great importance (see also Semenov et al. 2004).
Observations of the 372 GHz ground-state transition of ortho-H2D+ provide the best, and possibly only, current means for studying these aspects of disks around solar type protostars. The reason is that in the disk mid-plane the temperature is so low ( K) and the density so high ( cm-3) that virtually all heavy-elements bearing molecules freeze-out onto the grain mantles, disappearing from the gas phase. Only molecules containing H and D atoms stay gaseous and are capable of probing the gas in the disk mid-plane. Because the ground transitions of H2 and HD, the most abundant H and D bearing molecules, have relatively high energies ( K), they do not get excited in that cold environment. In principle, these transitions could be seen in absorption against the dust continuum, but such observations are extremely difficult because, if for no other reason, the relevant wavelengths are blocked by the Earth atmosphere (28 and 112 m for H2 and HD, respectively) 111Previous detections of the H2 S(0) and S(1) transitions towards Proto-Planetary Disks by Thi et al. (2001) have not been confirmed (Sako et al. 2005; Pascucci et al. 2006).. As a result, the most promising probes of the disk mid-plane are transitions of the next most abundant molecules containing H and D atoms: H, formed by the interaction of cosmic rays with H2 and H, and its deuterated forms H2D+, HD and D. While the symmetric molecules H and D do not possess dipole rotational transitions, both H2D+ and HD have ground transitions in the sub-millimeter region that can, in principle, be observed with ground based telescopes. Moreover, the disappearance of heavy-element bearing molecules from the gas phase enhances the H2D+/H and HD/H ratios to values that can exceed unity (Roberts et al. 2003) — H2D+ and HD become the most abundant positive charge carriers under these circumstance, and thus are not only the best probes of the disk mid-plane but also of the ionization degree. Detailed models of the chemistry of Proto-Planetary Disks confirm and quantitatively support these general arguments (Ceccarelli & Dominik 2005; Willacy 2007).
Both H2D+ and HD come in ortho and para forms, depending on the spin alignment of the H and D pairs. Of the five possible ground state transitions of the four species, only three have been observed thus far: the ortho-H2D+ at 372.4 GHz (Stark et al. 1999) and the at 2363 GHz (Cernicharo et al. 2007), and the para-HD at 691.7 GHz (Vastel et al. 2004). The two other transitions lie in a frequency domain inaccessible from the ground (at 1370.1 and 1476.6 GHz) and have not been detected thus far; this should change with the anticipated launch of Herschel, followed by SOFIA. Presently, the para-HD line has been detected in only one Pre-Stellar Core (Vastel et al. 2004). In contrast, the ortho-H2D+ line at 372 GHz has been observed in several objects, mostly Pre-Stellar Cores, where the conditions are similar to those in the disk mid-plane (Caselli et al. 2003; Hogerheijde et al. 2006; Harju et al. 2006), and in one Proto-Planetary Disk (Ceccarelli et al. 2004). In Pre-Stellar Cores, the line is so bright that both the line profile (van der Tak et al. 2005) and the emission spatial extent (Vastel et al. 2006) have been studied. Unfortunately, the compact dimensions of Proto-Planetary Disks preclude such studies there because of the limited sensitivity and spatial resolution of current instruments. However, the future Atacama Large Millimeter Array (ALMA) will have the capacity to not only easily detect the H2D+ line in disks but also to carry out mapping and line profile measurements, similar to what has already been done toward Pre-Stellar Cores. These studies will provide us with maps of the ionization structure in the disk mid-plane, and the dynamics; possibly, the presence of forming planets might be detected in perturbations of Keplerian motions.
In anticipation of this progress in observational capabilities, here we report a study of the ortho-H2D+ line emission in Proto-Planetary Disks. We present theoretical predictions for the line profiles and the line emission maps in a variety of Proto-Planetary Disk models. The calculations build on the study of the chemistry in the outer mid-plane of Proto-Planetary Disks by Ceccarelli & Dominik (2005), and employ the new radiative transfer formalism recently developed by Elitzur & Asensio Ramos (2006) to compute the H2D+ line emission. Details of the modeling procedure, including non LTE radiative transfer calculations and chemical/physical models, are described in §2. The results of our computations and implications for observability of the line and its diagnostic capability are described in §3. Our conclusions are contained in §4 .
2 The model
2.1 The disk model
Following the strategy described in Ceccarelli & Dominik (2005), we use the grid of models computed in that study. We consider a Proto-Planetary Disk in Keplerian rotation around a protostar with mass 0.5 , luminosity 0.5 and Teff = 3630 K. Starting at an inner radius of 45 AU, the disk surface density follows a power law , namely, the mass per unit radius is constant across the disk. The gas is mixed with the dust, and we fix the mass of the disk dust content at M⊙. Model number 1 corresponds to a set of “standard” parameters: disk outer radius of 400 AU; dust-to-gas mass ratio of 1:100, i.e., the disk mass is 0.02 M⊙; average grain radius of 0.1 m; and cosmic ray ionization rate s-1222We assume a constant cosmic rays ionization rate across the disk, as they can penetrate up to a column density of gr cm-2, never exceeded in the disk regions relevant to the present study... We consider four additional models, varying these parameters one at a time in each case. In model 2 the grain radius is increased to 1 m, corresponding to a case in which a substantial fraction of the dust has coagulated so that the small grains are removed. Model 3 checks the effect of increasing the cosmic ray ionization rate by factor ten, as might be the case of either a larger or when emulating strong X-ray irradiation of the disk. In model 4 the dust-to-gas ratio is increased by factor ten, so that the disk mass is only 2 M⊙. This corresponds to a phase in which a fair amount of gas has been dispersed. Finally, model 5 corresponds to a larger disk radius of 800 AU, similar to the well studied disk of DM Tau, where H2D+ has been detected (Ceccarelli et al. 2004). Table 1 summarizes the parameters of all models.
| Model | dust:gas | disk radius | ||
|---|---|---|---|---|
| mass ratio | [ s-1] | [m] | [AU] | |
| 1 | 0.01 | 1 | 0.1 | 400 |
| 2 | 0.01 | 1 | 1.0 | 400 |
| 3 | 0.01 | 10 | 0.1 | 400 |
| 4 | 0.1 | 1 | 0.1 | 400 |
| 5 | 0.01 | 1 | 0.1 | 800 |
Using the approach described in Dullemond et al. (2001) and Dullemond & Dominik (2004) for a passively irradiated hydrostatic flaring structure, the disk physical structure is derived self-consistently. The gas temperature is assumed to be the same as the dust. This is a justified assumption for the regions relevant to the present study, where the density is larger than about cm-3 and the gas and dust are thermally coupled because of the gas-dust collisions (e.g. Goldsmith 2001). We also assume a constant dust-to-gas ratio throughout the disk, assuming that no sedimentation of dust occurred yet. Fig. 1 shows the radial and vertical profiles of the gas density and the dust temperature for the 5 models considered here. The chemical composition, in particular the H2D+ radial and vertical abundance profiles, is computed by solving for chemical equilibrium, as described in Ceccarelli & Dominik (2005), and is shown in Fig. 1 for the 5 models. The H2D+ abundance depends primarily on: i) the cosmic rays ionization rate, which governs the overall ionization structure; ii) the dust-to-gas ratio, which determines the disk mass; and iii) the grain average radius . The grain size affects the overall ionization structure since recombination with negatively charged grains can become the major destruction channel for H, H2D+ etc. In addition, affects also the deuteration ratio (i.e. H2D+/H) since it controls the surface area on which heavy-elements bearing molecules freeze-out. The models considered here explore the influence of each relevant parameter on the H2D+ line. Based on the work by Ceccarelli & Dominik (2005), this ensemble of models should provide a good representation of the range of physical conditions relevant to H2D+ line emission in Proto-Planetary Disks.
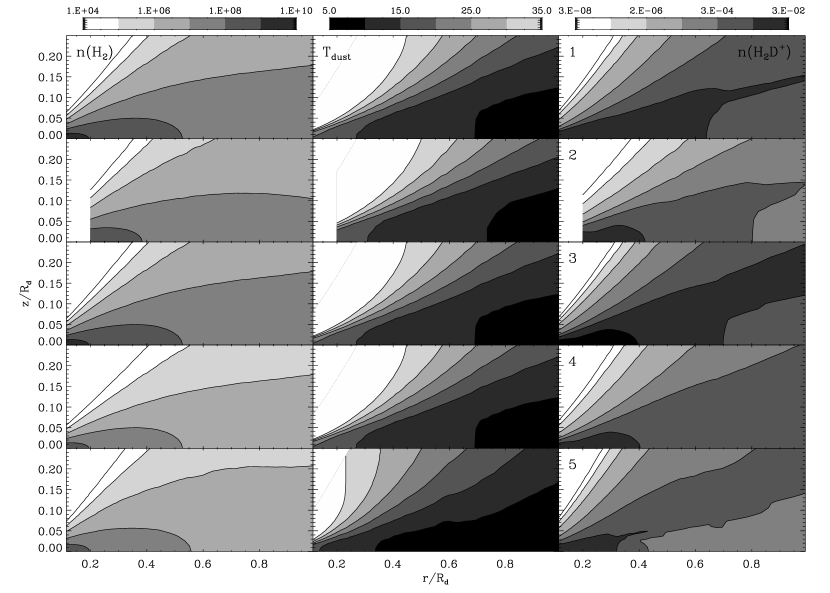
The H2D+ density, which is controlled primarily by the depletion of heavy-elements bearing molecules due to freeze-out, is expected to peak at “intermediate” depletion — at low depletion H becomes more abundant than H2D+, and at very large depletion D becomes the most abundant positive charge carrier, as it is the end of the chain transferring D atoms from HD. Indeed, the “standard” Model 1, displayed in the top row of figure 1, shows that the H2D+ density is largest in the disk mid-plane, where the depletion is “intermediate”, as expected. The “intermediate depletion” region shrinks when the grain size increases (Model 2, second row in the figure) and expands when the cosmic ionization rate increases (Model 3, third row); furthermore, the peak H2D+ density is higher in the latter case. Increasing the dust-to-gas ratio implies a lower gas density (as the disk dust mass is fixed), and a comparatively reduced region of H2D+ at a given density (Model 4). Finally, keeping the disk mass fixed while increasing its radius (Model 5) reduces the overall density and decreases the portion of the disk where H2D+ is the most abundant; most of the outer disk mid-plane is now so cold that the major charge carrier there is D.
2.2 The radiative transfer calculation
At every point in the disk, the populations of the two levels of the transition are determined from the balance between excitations and de-excitations due to collisional and radiative interactions. Given the population distribution, the intensity emerging along any line of sight can be obtained from ray tracing. However, the radiative interactions involve the local radiation field, which includes the contribution of line emission from the entire disk (the “diffuse radiation”) and thus cannot be determined before the level populations are known everywhere. Determining the level populations requires coupling between the radiative transfer and statistical rate equations. In the recently developed Coupled Escape Probability (CEP) method, the effects of the diffuse radiation are incorporated into the level population equations through coefficients that rigorously account for the radiative coupling between different regions (Elitzur & Asensio Ramos 2006). The exact solution of the problem is obtained from a set of non-linear algebraic equations for the level populations in each zone. In a comparative study of a number of standard problems, the CEP method outperformed the leading accelerated -iteration by substantial margins.
With a grid of 80 radial points and 100 vertical points we divide the disk into 8000 rings. Each ring has a rectangular cross-section and uniform physical conditions. Thus far the CEP method has been formulated only for the slab geometry, therefore its application here involves an approximation. Consider the vertical profiles of density, etc., in the disk at a given radius, and a stratified slab with the same structure perpendicular to its surface. Neglecting radiative energy flow in the radial direction through the disk, the vertical profile of the level population distribution at that radius can be obtained from the solution of the stratified slab. This is the approach we take here. The approximation is justified because radiative coupling is suppressed in the radial direction not only by the large optical depths but also by the Doppler shifts due to differential Keplerian rotation.
Following the suggestion by Stark et al. (1999) that the collisional de-excitation rate coefficient is cm3s-1, the transition critical density used here is cm-3. New unpublished computations (E. Hugo & S. Schlemmer, private communication) suggest a rate coefficient of cm3s-1 at 10 K; changing the temperature to 20 K has only a 5% effect on the result in these computations. The implied critical density is a factor 10 lower than assumed here. Since the densities of the emitting gas are larger than either value, the transition level populations are practically always in thermal equilibrium so that the exact value of the collision rate is not critical. Finally, we assume a constant ortho-to-para H2D+ ratio across the disk equal to 0.3, as in Ceccarelli & Dominik (2005).
3 Results
The aim of this study is to provide predictions for comparison with actual observations of the ortho-H2D+ ground line. Two categories of measurements exist — single-dish and interferometric observations. We present the results of our calculations for these two cases separately in each of the following subsections. In computing the line emission, we assume the H2D+ ortho-to-para ratio is 0.3 (Ceccarelli & Dominik 2005) and consider a source at a distance of 140 pc.
3.1 Spectral line profiles

At present, few single-dish telescopes are capable of observing the H2D+ 372 GHz line: the 15m JCMT, 12m APEX, 10m CSO and 3m KOSMA. At a distance of 140 pc, a disk radius of 400 AU corresponds to an angular diameter of 6″, less than the smallest telescope beam currently available (JCMT with 15″ at 372 GHz). The only measurable quantity is the overall flux emerging from the disk. Figure 2 shows the flux spectral shape for the five models listed in Table 1 for different viewing angles, from face-on to edge-on. The flux level is highest in Model 3, which has the highest H2D+ density (see figure 1) owing to its increased cosmic ray ionization rate, and in model 5, which has the largest surface area. It is lowest in Models 2 and 4, where the H2D+ density is reduced.
All models show a similar behavior for the line profiles. Face-on viewing produces single-peak profiles with the thermal line width. As the disk orientation changes toward edge-on, the profiles broaden and switch to a double-peak shape reflecting the disk rotation. The peak separation is determined by the combined effects of column density and velocity projection along the line of sight. For the 400 AU disks, the Keplerian velocity varies from 3.2 km s-1 at 45 AU to 1.1 km s-1 at 400 AU, with the largest line optical depth in the vertical direction (with a value of 0.5 for Model 1) occurring at a radius of 220 AU, where the velocity is 1.4 km s-1. To demonstrate the effect of rotation speed on the profile shape, figure 2 shows also profiles in which the disk rotation is arbitrarily speeded up or slowed down by factor 2 while all other model parameters are held fixed. Although the profiles change their shape with inclination, the area under each curve remains almost the same; that is, the velocity-integrated flux is roughly independent of viewing angle. The computed values of the velocity-integrated flux agree rather well with the estimates obtained by Ceccarelli & Dominik (2005) with the standard escape probability approximation.
3.2 Line optical depth
It is of interest to investigate the line optical depth for different models and different positions. Figure 3 shows the optical depth at the core of the line for models 1 and 3 for cuts passing through the disk center in the two limiting orientations of face-on and edge-on. Thanks to an increased cosmic ray ionization rate that leads to a higher H2D+ density, the results of model 3 represent an upper limit on the optical depths. In edge-on orientation the inner 100 AU region is optically thick while the face-on case is neither optically thick nor thin, except for a ring at 250 AU. This ring can be recognized in the images shown in Fig. 4, even though the inclination angle is different. Model 1 produces very similar results but with reduced optical depths. In this case, only the edge-on orientation yields optical depths above unity.

3.3 Brightness maps
Interferometic observations with SMA (and eSMA), IRAM Plateau de Bure and ALMA will be able to spatially resolve the H2D+ 372 GHz line emission from disks like the ones considered here. We produce model maps by convolving the intensity with a Gaussian beam with FWHM of 0.3″, corresponding to a linear size of 40 AU at a distance of 140 pc; such resolution can be reasonably expected at ALMA for the predicted intensities. Fig. 4 shows some results. The edge-on map of Model 1 traces closely the horizontal and vertical distributions of the H2D+ density. The most intense emission is produced in the inner regions close to the disk mid-plane within a height of 1/10 of the radius, confirming the suggestion that the ortho-H2D+ 372 GHz line probes the disk mid-plane (Ceccarelli et al. 2004). The high brightness is maintained out to radii approaching 100 AU, covering the region where a solar-like planetary system might be forming. Therefore this line can serve as a probe of the ionization degree and kinematics in a region critical for planet formation. Further out, because of the extreme molecular depletion in the equatorial plane, which shifts all deuterium into D (see Fig. 1 and the discussion in §2.1), the H2D+ line probes regions slightly above it.
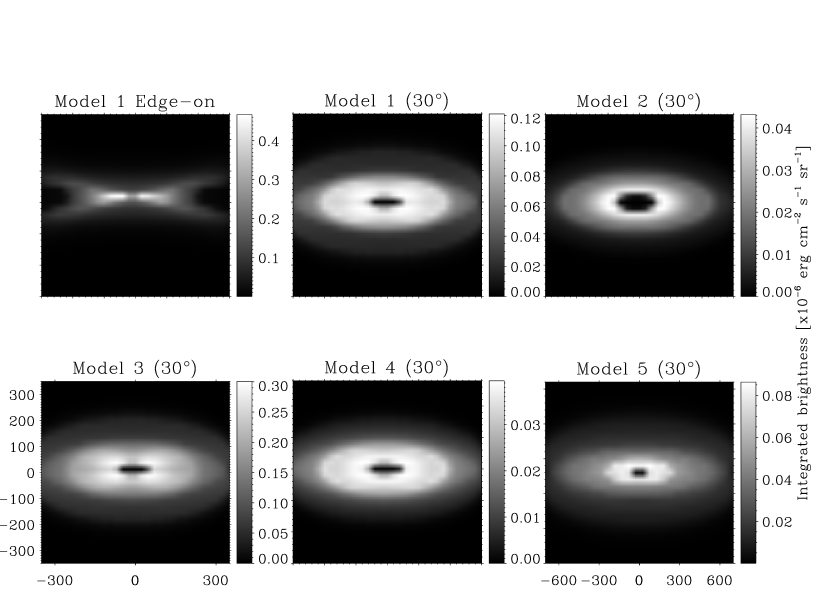
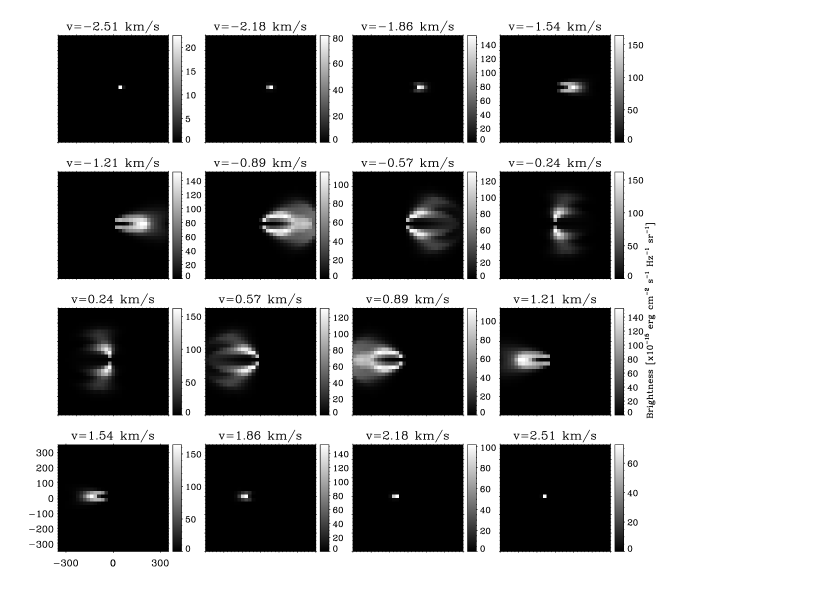
The five model maps at 30∘ inclination show additional structure, reflecting variation in column density and path length due to the geometry and chemistry of the flaring disk. These variations control also the channel maps, shown in Fig. 5 for the standard disk (Model 1) at 30∘ inclination. Brighter and fainter rings are evident at different positions for different velocities, depending on the intercepted portion of disk. Overall, the maps show the standard Keplerian pattern with blue-shifted and red-shifted lobes spatially separated and symmetric with respect to the rotation axis. Fig. 6 shows a mosaic of the line profiles for this case.
All maps employ intensity units. Those can be converted to “equivalent Rayleigh-Jeans temperature” through K, where is the intensity in units of erg cm-2 s-1 Hz-1 sr-1. It should be noted that, since the temperature equivalent of the 372 GHz transition frequency (806 m wavelength) is 18 K, the actual brightness temperature is usually quite different from .

4 Conclusions
Our results confirm the utility of the 372 GHz H2D+ line in probing the inner regions of Proto-Planetary Disks. While the predicted line fluxes are at the limit of detectable power of current sub-millimeter telescopes, the future ALMA interferometer will be able to not only detect the line but also study the distribution and extent of the H2D+ emission. The spatially and velocity integrated intensities computed in this study (§3) compare rather well with the previous estimates by Ceccarelli & Dominik (2005), which were derived in the escape probability approximation. Indeed, Elitzur & Asensio Ramos (2006) note that the escape probability approximation is adequate for calculating the line integrated emission of a two-level system from a homogeneous slab. Our study suggests that this approximation can be used to provide rough estimates of the integrated line intensity also in the case of disks with variable physical properties. However, line profile calculations require an exact formalism, like the CEP method employed here.
The major uncertainty in our modeling is the disk physical structure and H2D+ abundance. As pointed out by Ceccarelli & Dominik (2005), one major uncertainty is linked to the role of N2 and, specifically, its freezing-out onto the grain mantles. The models studied here adopt a sticking coefficient of 1 and a binding energy of 575 K, as suggested by early models and observations (e.g. Bergin et al. 2002). However, laboratory studies show that the binding energy of N2 is similar to that of CO, namely 885 K. If this is the case, N2 will freeze-out more easily and a larger region of the disk than computed here would be dominated by D, at the expense of H2D+. The resulting H2D+ column density would then be a factor 30 lower for the standard case (Model 1), making the line much more difficult to detect (see also Willacy 2007). Complementary observations of N-bearing molecules, like N2H+, will be necessary for drawing a coherent picture. A second uncertainty involves the H2D+ ortho-to-para ratio, which is observationally entirely unknown. Theoretical estimates vary depending on several parameters, most of them unknown too, like the ortho-to-para ratio of H2 and the grain size (Flower et al. 2004; Vastel et al. 2006; Flower et al. 2006). Clarifying this issue requires observations of the ground transition of the para-H2D+ at 1370.1 GHz. Unfortunately, no current facility is capable of such observations, and neither will Herschel. A third uncertainty arises from the collision rate coefficient of the transition, but this should have only a minor effect given the relatively high densities in the disk mid-plane.
With all of these caveats and in spite of the uncertainties, observations of H2D+ at 372 GHz remain a powerful diagnostic tool for probing the disk mid-plane. Imaging of the 372 GHz line emission will bring information, otherwise unavailable, on the disk kinematics and ionization structure, serving as a unique tool in the study of planet formation. For example, ALMA will be able to reach a rms of 2 mJy on a 0.3 km/s velocity bin and 0.3 beam in 10 hr of integration time333based on the ALMA time estimator; http://www.eso.org/projects/alma/science/bin/sensitivity.html, corresponding to a line brightness of erg cm-2 sHz-1 sr-1. Comparison with the predictions reported in Fig. 5 shows that this will allow imaging of the H2D+ line emission at the scale expected for planet formation, providing a crucial information for theories of planetary formation.
Acknowledgements.
We thank Carsten Dominik for providing us with the grid of models of the physical structure of the studied disks. We also wish to thank E. Hugo & S. Schlemmer for providing us the results of their modeling prior to publication. Support by the Spanish Ministerio de Educación y Ciencia through project AYA2004-05792 (A.A.R), the French Projet Nationale PNPS (C.C.) and NSF award AST-0507421 (M.E.) is gratefully acknowledged.References
- Adams et al. (2004) Adams, F. C., Hollenbach, D., Laughlin, G., & Gorti, U. 2004, ApJ, 611, 360
- Bergin et al. (2002) Bergin, E. A., Alves, J., Huard, T., & Lada, C. J. 2002, ApJ, 570, L101
- Caselli et al. (2003) Caselli, P., van der Tak, F. F. S., Ceccarelli, C., & Bacmann, A. 2003, A&A, 403, L37
- Ceccarelli & Dominik (2005) Ceccarelli, C. & Dominik, C. 2005, A&A, 440, 583
- Ceccarelli et al. (2004) Ceccarelli, C., Dominik, C., Lefloch, B., Caselli, P., & Caux, E. 2004, ApJ, 607, L51
- Dullemond & Dominik (2004) Dullemond, C. P. & Dominik, C. 2004, A&A, 417, 159
- Dullemond et al. (2001) Dullemond, C. P., Dominik, C., & Natta, A. 2001, ApJ, 560, 957
- Elitzur & Asensio Ramos (2006) Elitzur, M. & Asensio Ramos, A. 2006, MNRAS, 365, 779
- Flower et al. (2004) Flower, D. R., Pineau des Forêts, G., & Walmsley, C. M. 2004, A&A, 427, 887
- Flower et al. (2006) Flower, D. R., Pineau Des Forêts, G., & Walmsley, C. M. 2006, A&A, 449, 621
- Gammie (1996) Gammie, C. F. 1996, ApJ, 462, 725
- Harju et al. (2006) Harju, J., Haikala, L. K., Lehtinen, K., et al. 2006, A&A, 454, L55
- Hogerheijde et al. (2006) Hogerheijde, M. R., Caselli, P., Emprechtinger, M., et al. 2006, A&A, 454, L59
- Pascucci et al. (2006) Pascucci, I., Gorti, U., Hollenbach, D., et al. 2006, ApJ, 651, 1177
- Roberts et al. (2003) Roberts, H., Herbst, E., & Millar, T. J. 2003, ApJ, 591, L41
- Sako et al. (2005) Sako, S., Yamashita, T., Kataza, H., et al. 2005, ApJ, 620, 347
- Semenov et al. (2004) Semenov, D., Wiebe, D., & Henning, T. 2004, A&A, 417, 93
- Stark et al. (1999) Stark, R., van der Tak, F. F. S., & van Dishoeck, E. F. 1999, ApJ, 521, L67
- Thi et al. (2001) Thi, W. F., Blake, G. A., van Dishoeck, E. F., et al. 2001, Nature, 409, 60
- van der Tak et al. (2005) van der Tak, F. F. S., Caselli, P., & Ceccarelli, C. 2005, A&A, 439, 195
- Vastel et al. (2006) Vastel, C., Caselli, P., Ceccarelli, C., et al. 2006, ApJ, 645, 1198
- Vastel et al. (2004) Vastel, C., Phillips, T. G., & Yoshida, H. 2004, ApJ, 606, L127
- Willacy (2007) Willacy, K. 2007, ApJ, 660, 441