The Compact X-ray Source 1E 1547.0-5408 and the Radio Shell G327.24-0.13: A New Proposed Association between a Candidate Magnetar and a Candidate Supernova Remnant
Abstract
We present X-ray, infrared and radio observations of the field centered on X-ray source 1E 1547.0–5408 in the Galactic Plane. Analysis of a new Chandra observation of this source shows it is unresolved at arc-second resolution, and analysis of a new XMM observation shows that its X-ray spectrum is best described by an absorbed power-law and blackbody model. A comparison of the X-ray flux observed from 1E 1547.0–5408 between 1980 and 2006 by Einstein, ASCA, XMM, and Chandra reveals that its absorbed 0.5–10 keV X-ray flux decreased significantly during this period, from ergs cm-2 s-1 to ergs cm-2. No pulsations in the X-ray emission from 1E 1547.0–5408 were observed during the most recent XMM observation, which allows us to put a 5 confidence upper limit of 14% for the 0.5–10 keV peak-to-peak pulsed fraction (for sinusoidal pulses with periods slower than 1.8s). A near-infrared observation of this field shows a source with magnitude near the position of 1E 1547.0–5408, but the implied X-ray to infrared flux ratio indicates the infrared emission is most likely from an unrelated field source, allowing us to limit the IR magnitude of any counterpart to 1E 1547.0–5408 to . Archival radio observations reveal that 1E 1547.0–5408 sits at the center of a faint, small ( diameter) radio shell, G327.24–0.13, which is possibly a previously unidentified supernova remnant. The X-ray properties of 1E 1547.0–5408 suggest that this source is a magnetar — a young neutron star whose X-ray emission is powered by the decay of its extremely strong magnetic field, G. The spatial coincidence between this source and G327.24–0.13 suggests that 1E 1547.0–5408 is associated with a young supernova remnant, supporting a neutron star interpretation. Additional observations are needed to confirm the nature of both 1E 1547.0–5408 and G327.24–0.13, and to determine whether these sources are physically associated. If confirmed, this pair will be an important addition to the small number of known associations between magnetars and supernova remnants.
Subject headings:
stars: neutron, ISM: supernova remnants, ISM: individual (G327.24-0.13), X-rays: stars, X-rays: individual (1E 1547.0-5408)1. Introduction
Massive stars () end their lives in supernovae, often forming neutron stars. For many decades, it was thought that these neutron stars had short initial spin periods (), dipole surface magnetic fields with strengths , and were most often observed as radio pulsars. While this describes the majority of known neutron stars, several new classes of neutron stars have since been discovered. Most notable of these are Anomalous X-ray Pulsars (AXPs) and Soft Gamma Repeaters (SGRs), which have spin periods longer than most normal radio pulsars ( s) and high period-derivatives ( s/s) (Woods & Thompson, 2006). Due to the strong surface dipole magnetic fields inferred from these timing properties (), these sources are believed to be “magnetars”, neutron stars whose X-ray emission is powered by the decay of these extremely strong field (Duncan & Thompson, 1992; Thompson & Duncan, 1995, 1996).
Currently there are only 13 confirmed magnetars. As a result, it is difficult to determine the spatial distribution, birth-rate, and active lifetime of these sources, information vital to understanding the relationship between magnetars and other products of core collapse supernovae. This uncertainty is further exacerbated by the presence of at least one transient magnetar, XTE J1810-197 (Ibrahim et al., 2004). A powerful way of determining the relationship between magnetars and other classes of neutron stars is to use environmental information to constrain their ages and progenitors of these populations. This is easiest done for those neutron stars associated with SNRs, since observations of SNRs allow an independent estimates of distances and ages, the densities of the surrounding medium, and the explosion energies of the progenitor supernovae. To date, there are only two secure magnetar/SNR associations, 1E 2259+586 in SNR CTB 109 (Fahlman & Gregory, 1981) and 1E 1841-045 in SNR Kes 73 (Vasisht & Gotthelf, 1997), though SGR 0526-66 is possibly associated with Large Magellanic Cloud SNR N49 (Marsden et al., 1996; Gaensler et al., 2001b). Based on the ages of these SNRs (not including SNR N49), as well as the offset between these magnetars and the centers of their SNRs, Gaensler et al. (2001b) concluded that magnetars are young ( yr) neutron stars with low projected space velocities (500 km s-1). This assertion that magnetars have a low spatial velocity is also supported by recent proper motion measurements of XTE J1810-197 (Helfand et al., 2007). Additionally, an analysis of the X-ray emission from these SNRs implies that the level of energy injection at early times, from both supernova ejecta and from the magnetar spin down, was ergs, constraining the initial spin period of these magnetars to ms (Vink & Kuiper, 2006). While much has been learned from detailed studies of the few associations between magnetars and SNRs, much more can be gained by identifying additional examples of such associations.
In this paper, we propose a new potential magnetar/SNR association, between the X-ray source 1E 1547.0-5408 and the Galactic radio shell G327.24-0.13. In §2, we present both X-ray (§2.1) and near-infrared (near-IR) (§2.2) observations of the field around 1E 1547.0-5408. In §3, we present archival radio observations which show that 1E 1547.0-5408 is located at the center of G327.24-0.13. In §4, we argue the compact nature of 1E 1547.0-5408, its lack of a bright near-IR counterpart, and its location of 1E 1547.0-5408 source at the center of G327.24-0.13 implies this source is a neutron star, and that the X-ray spectrum and variability of 1E 1547.0-5408 strongly suggest that it is a magnetar.
2. Observations of 1E 1547.0-5408
2.1. X-ray Data
X-ray source 1E 1547.0-5408 was discovered by Einstein during a search for X-ray counterparts of unidentified -ray sources (Lamb & Markert, 1981), in this case the -ray source 1CG327–0 detected by Cos-B (Hermsen et al., 1977). This detection was confirmed by the ASCA Galactic plane survey, in which the source AX J155052-5418 was detected at the same position (Sugizaki et al., 2001). Recently, this field has been observed twice with XMM–Newton, (an archival observation in 2004 and a new observation in 2006), and again with the Chandra X-ray Observatory in 2006. A summary of these observations is given in Table 1. Both XMM datasets were processed using the standard tasks given in xmm-sas v.6.5.0, while the Chandra data were analyzed using ciao v.3.4. All datasets were then filtered using the standard energy and quality criteria.
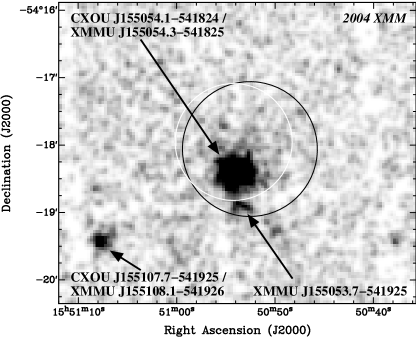
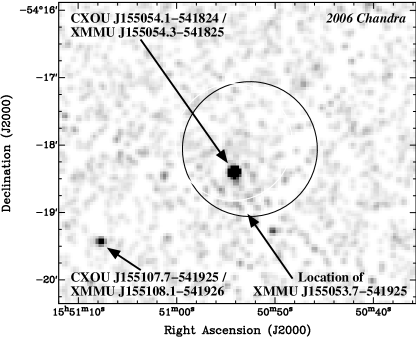
As shown in Fig. 1, due to the improved spatial resolution of XMM and Chandra, we detect two point sources in the overlapping position error circles of 1E 1547.0-5408 and AX J155052-5418 – a bright source that we designate CXOU J155054.1-541824 (=XMMU J155054.3–541825) and a much fainter source we designate XMMU J155053.7-541925. This second source is detected in both XMM observations but not the Chandra observation because it fell in a chip gap. For both sources, their extents are consistent with the point spread function of the telescope at that position. The most accurate position for CXOU J155054.1-541824 comes from the Chandra observation, which gives 15:50:54.11 and –54:18:23.8. This position has not been registered to an external reference frame, due to the lack of field X-ray sources with counterparts at other wavelengths. Therefore, the error in this position is dominated by the pointing accuracy of Chandra – a typical 99% confidence radius of . As shown in Table 2, the observed count rates of both CXOU J155054.1-541824 and XMMU J155053.7-541925 declined between the 2004 and 2006 XMM observations – in the case of CXOU J155054.1-541824, the count rate declined by , while for XMMU J155053.7-541925 the count rate declined by .
We have quantified the apparent variation of the X-ray flux from CXOU J155054.1-541824 via a more detailed spectral analysis of the observations listed in Table 1. Here, and in the subsequent discussion, we assume that 1E 1547.0-5408 and AX J155052-5418 correspond to the same X-ray source, and that this source is a blend of CXOU J155054.1-541824, XMMU J155053.7-541925, and other adjacent field sources that can be seen at the high angular resolution of XMM and Chandra, but not with ASCA and Einstein. Since CXOU J155054.1-541824 substantially dominates the emission, we here on use 1E 1547.0-5408 to indicate this main source, except with a distinction with fainter, adjacent sources needs to be made. For the Einstein observation, we used the procedure defined by McGarry et al. (2005) to determine the flux of 1E 1547.0-5408. To do this, we assume the X-ray spectrum of 1E 1547.0-5408 is well modeled by an absorbed power law assuming a hydrogen column density cm-2 and a photon index , as derived below from spectral fits to the ASCA, XMM, and Chandra observations. To determine the X-ray flux of 1E 1547.0-5408 as measured by ASCA, XMM, and Chandra, we simultaneously fit the observed spectrum of this source to an absorbed power law model using Xspec v.11.3.1. We chose an absorbed power law model since this model provides a good fit to each of these spectra individually. For the XMM and Chandra observations, spectral regions were chosen to minimize contamination from XMMU J155053.7-541925 and other field sources. For the ASCA observation, this was not possible due to the poor point spread function of this instrument. Holding the , , and normalization constant between these different observations, which implies a constant flux, resulted in a poor fit (reduced ). Allowing the normalizations to vary independently, but holding and fixed, lowered the reduced to 1.26, a substantial improvement. As shown in Table 3, the results from this analysis imply that 1E 1547.0-5408 is a variable X-ray source.
To determine what physical model best describes the X-ray spectrum of 1E 1547.0-5408, we used Xspec v.11.3.1 to jointly fit the spectrum of this source measured during the 2006 August XMM observation by the Mos1, Mos2, and pn instruments to a number of different models, including a power law, bremsstrahlung, power-law plus blackbody, and two blackbodies, all attenuated by interstellar absorption. During this observation, between 0.5 and 10 keV a total of 100533 counts above the background were collected from this source by the Mos1 detector, 106234 by the Mos2 detector, and 235151 by the pn detector. The resultant X-ray spectrum is shown in Fig. 2. As shown in Table 4, an absorbed power-law plus blackbody model produces the best fit. According to the f-test, the decrease in for the best two-component model (absorbed power-law plus blackbody) over the best one-component model (absorbed bremsstrahlung) is statistically significant at 99.9% confidence, so the use of second component is justified. Therefore, we conclude that either an absorbed power-law plus blackbody or an absorbed two blackbodies (these two models produced statistically indistinguishable fits) provides the best description of the X-ray spectrum of 1E 1547.0-5408.
We also searched for pulsed X-ray emission from 1E 1547.0-5408 using the data collected during the 2006 XMM observation using the test (Buccheri et al., 1983). To do so, we first extracted events from two circular regions centered around the position CXOU J155054.1-541824, one in radius and the other in radius, from the filtered Mos1, Mos2, and pn datasets. We then barycentered the arrival times of these photons to the solar system reference frame. This search was conducted on the Mos1 (0.9s time resolution), Mos2 (0.9s time resolution), and pn (73.4 ms time resolution) datasets individually, as well as on them jointly. To allow for the possibility that the pulsed fraction might have a strong energy dependence, we applied various energy cuts to the event lists derived from both spatial regions. For all searches the minimum frequency was Hz, the maximum frequency was 0.6 Hz for the Mos and joint datasets and 6.8 Hz for the pn data, and the frequency step was Hz, oversampling the Nyquist frequency by a factor of five. For each combination of spatial region, detectors, and energy range, we searched for periods summing up to a maximum harmonic . In none of these different combinations did we detect a statistically significant signal. Between 0.5 and 10 keV, the most sensitive dataset for a sinusoidal () pulse profile comes from combining the three detectors and using the large spatial region. In this dataset, we have 5305 photons in 52201 independent trials. Using the equations in Leahy et al. (1983), we are able to place a 5 upper limit on the peak-to-peak pulse fraction , defined as (Patel et al., 2003):
| (1) |
where and are the maximum and minimum number of counts in the pulse profile, of .
2.2. Near-IR Observation of 1E 1547.0-5408
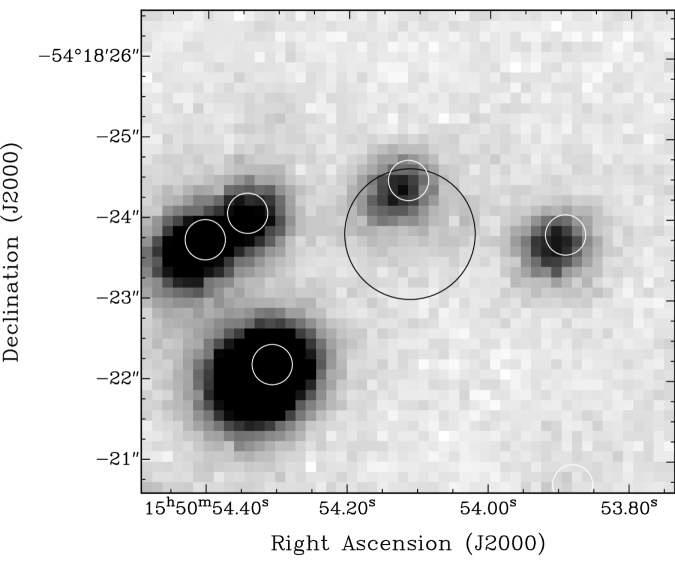
Using the position of CXOU J155054.1-541824 as measured by Chandra, we searched for a near-IR counterpart in a three minute (m) observation of this field taken on 13 June 2006 with the Persson’s Auxiliary Nasmyth Infrared Camera (panic) instrument on the 6.5m Baade Magellan telescope at the Las Campanas Observatory in Chile. This image was sky-subtracted using the standard procedures in the iraf software package, and registered using the position of 2MASS sources in the field. We used the iraf task daofind to identify objects in this field and measure their instrumental magnitudes, and used the 144 2MASS stars in this field with one and only counterpart within 1″ of their position to determine the conversion between instrumental and astronomical magnitudes. To search for a counterpart, we used the 99% error () of the Chandra position quoted in §2.1. As shown in Fig. 3, only one source was detected inside this region, and this source has an observed magnitude of . Using the source magnitude distribution of objects detected in our observation, we determine that our image is complete to sources with a magnitude .
3. The Galactic radio shell G327.24-0.13
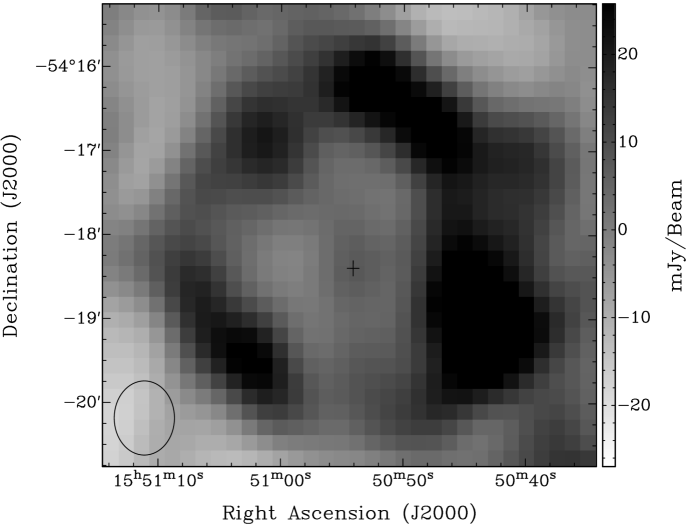
1E 1547.0-5408 falls within the field of view of multiple recent southern hemisphere radio surveys: the Molonglo Galactic Plane survey (MGPS, 843 MHz; Green et al. 1999), the Sydney University Molonglo Sky Survey (SUMSS, 843 MHz; Bock et al. 1999; Green 2002) and in both the test region (Gaensler et al., 2001a) and survey region (Haverkorn et al., 2006) of the Southern Galactic Plane Survey (SGPS, 1.4 GHz). All four surveys detected a faint diameter shell centered on CXOU J155054.1-541824, which we designate G327.24-0.13. In both the MGPS and SUMSS (Figure 4) images, there is some evidence for enhanced emission from the center of G327.24-0.13. At both frequencies, the flux was determined by subtracting the observed flux from G327.24-0.13 by estimates for the diffuse Galactic background at this position obtained using nearby regions, and the error is dominated by the uncertainty in the background. At 843 MHz, the flux density of G327.24-0.13 – excluding any interior emission – is Jy while at 1.4 GHz, the flux density is Jy. These fluxes correspond to a radio spectral index between 843 MHz and 1.4 GHz of ().
4. Discussion
In this section, we use the observational results presented in §2 and §3 to determine the nature of 1E 1547.0-5408 and G327.24-0.13. Based on the results of the XMM and Chandra observations, we believe 1E 1547.0-5408 is a blend of compact X-ray sources dominated by the X-ray emission of CXOU J155054.1-541824. Therefore, we conclude that XMMU J155053.7-541925 and the other sources detected by XMM and/or Chandra are negligible contributors to the X-ray properties of 1E 1547.0-5408 as measured by Einstein and ASCA. We also believe that these sources are unrelated to CXOU J155054.1-541824.
Since CXOU J155054.1-541824 is unresolved by Chandra, 1E 1547.0-5408 is most likely either an active galactic nucleus (AGN), a neutron star (either a rotation-powered pulsar, a magnetar, or a compact central object (CCO)), a non-degenerate star, a X-ray binary, or a cataclysmic variable (CV). A major clue into the nature of 1E 1547.0-5408 is its possible association with a near-IR source, as discussed in §2.2.
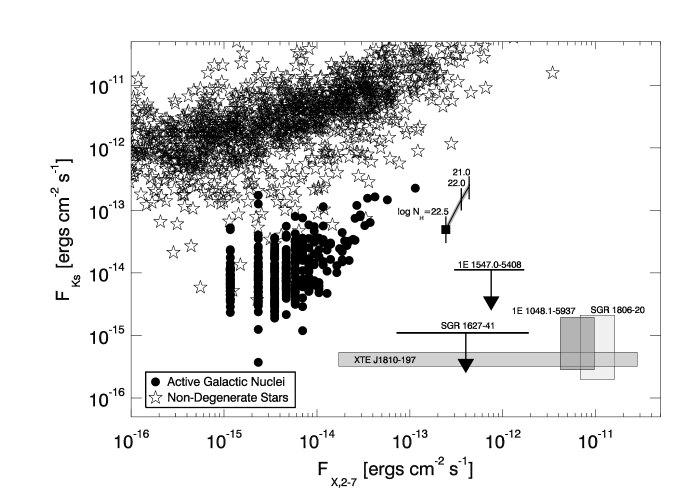
If 1E 1547.0-5408 is associated with this near-IR source, it is most likely either a non-degenerate star in the Milky Way or a AGN. If a non-degenerate star, then the absorbed bremsstrahlung is the most realistic description of the X-ray emission. If an AGN, only the absorbed bremsstrahlung fit to the observed spectrum gives parameters similar to that observed from other AGN. To determine if either identification is reasonable, we compared the X-ray and IR fluxes of this source to those of known stars and AGN, similar to the approach used by Kaplan et al. (2004). For stars, we used data obtained by the Chandra Orion Ultradeep Project (Getman et al., 2005), and for AGN, we used the X-ray (Kenter et al., 2005) and near-IR (Jannuzi et al., 2004) data from the XBoötes survey. For both surveys, we only used the observed 2–7 keV flux since this quantity is less sensitive to interstellar absorption and choice of X-ray spectral model than the 0.5–2 keV flux. To correct for the difference in observed towards 1E 1547.0-5408 from the Galactic value of towards sources in the Boötes field ( cm-2; Kenter et al. 2005) and the value observed towards sources in the Orion field ( cm-2; Getman et al. 2005), we determined the 2–7 keV X-ray and near-IR fluxes of 1E 1547.0-5408 over this range of . As shown in Figure 5, the IR and X-ray properties of 1E 1547.0-5408 are inconsistent with both populations. Therefore, we conclude that 1E 1547.0-5408 is not associated with this near-IR source. To compute the probability of their association being a coincidence, we shifted the RA and DEC of 1E 1547.0-5408 by a random amount between , and determined if there is a near-IR source within of its adjusted position. This analysis implies a false coincidence rate of 14%, implying that there is a reasonable possibility that the near-IR object is an unrelated field source. As a result, we adopt a magnitude of 17.5 as an upper limit on magnitude 1E 1547.0–5408.
As a result, we are left with the possibility that this X-ray source is a neutron star, X-ray binary, or a CV. The location of 1E 1547.0-5408 in the center of SNR candidate G327.24-0.13 strongly implies that this source is a neutron star. This identification is supported by the fact that the bremsstrahlung and power-law fits to the X-ray spectrum of 1E 1547.0-5408 shown in Table 4 are inconsistent with the spectra expected from X-ray binaries (a modified blackbody with kT1-2 keV; White et al. 1988) and CVs (bremsstrahlung emission with kT keV; Eracleous et al. 1991). The X-ray spectrum of 1E 1547.0-5408 is also inconsistent with that observed from rotation-powered pulsars (a power law with ; Cheng et al. 2004). However, the parameters for the absorbed power law, the absorbed power law and blackbody, and the absorbed two blackbody models are similar to that observed from both magnetars (Mereghetti, 2001) and CCOs (Pavlov et al., 2004). As shown in Table 5, the observed X-ray variability of 1E 1547.0-5408 described in §2.1 is similar to that observed from several magnetars. CCOs, on the other hand, appear to be steady X-ray sources, and therefore we conclude the 1E 1547.0-5408 is most likely a magnetar. One crucial difficulty with this interpretation is our failure to detect pulsed X-ray emission from this source. Magnetars typically have high pulsed fractions in the X-ray regime, for example before its recent outburst CXOU J164710.2-455216 had a pulsed fraction of (Muno et al., 2006), much higher than the 5 upper limit derived in §2.1 of 14% on the 0.5–10 keV peak-to-peak pulsed fraction from 1E 1547.0-5408 for a sinusoidal pulse profile, the characteristic pulse profile for magnetars. However, this upper limit is higher than the pulsed fraction of at least one magnetar, 4U 0142+61, which has a 0.5–7 keV peak-to-peak pulsed fraction of (Patel et al., 2003; Göhler et al., 2005).
If this identification is correct, we can compare the X-ray properties of 1E 1547.0-5408 to those of other magnetars. For the power-law plus blackbody model of the spectrum, the 2–10 keV unabsorbed flux of 1E 1547.0-5408 ranges from ergs cm-2 s-1. For a distance kpc (it will be argued below that is a reasonable distance estimate), this translates to a luminosity range of ergs s-1. Comparing this value to those given in the SGR/AXP Online Catalog111Available online at http://www.physics.mcgill.ca/pulsar/magnetar/main.html., this falls within the X-ray luminosity range spanned by confirmed magnetars. With this information, we can also compare the near-IR and X-ray properties of 1E 1547.0-5408 to that of other magnetars, whose properties are listed in Table 5. As shown in Figure 5, the range of X-ray fluxes observed from 1E 1547.0–5408, as well as the upper limit on the near-IR flux is consistent with that observed from confirmed magnetars.
The radio spectral index of G327.24-0.13 derived in §3 is consistent with a non-thermal origin, implying that this source is either a stellar wind bubble or a SNR. The lack of any mid-IR counterpart to G327.24-0.13 in the Spitzer glimpse survey (Benjamin et al., 2003) gives support to the latter interpretation. If 1E 1547.0-5408 is a magnetar and G327.24-0.13 is the SNR created by its progenitor, then this system becomes a new addition to the handful of associations between magnetars and SNRs. Assuming that the two sources are indeed associated, we can obtain initial constraints on the possible distance to 1E 1547.0–5408/G327.24-0.13 as follows. Recent evidence has suggested that magnetar progenitors are especially massive stars (Gaensler et al., 2005; Muno et al., 2006), and therefore expect significant star–formation activity in their vicinity. Indeed, in this case there are two nearby ( away) thermal radio sources, G326.96+0.03 and G327.99-0.09, both associated with a large star-forming complex in the Scutum-Crux spiral arm. H i absorption and hydrogen recombination line measurements indicate that the distance to G326.96+0.03 and G327.99-0.09 both fall within the range kpc (Caswell & Haynes, 1987; McClure-Griffiths et al., 2001). By associating 1E 1547.0-5408/G327.24-0.13 with this region, we argue that . If so, the observed size of G327.24-0.13 () implies a diameter of pc, making G327.24-0.13 one of the smallest, and therefore probably youngest, known SNRs.
As mentioned in §2.1, 1E 1547.0-5408 was originally discovered in a search for the X-ray counterpart of unidentified -ray source 1CG327–0. Quiescent emission from magnetars has been detected at energies as high as 100 keV by the Integral satellite (Götz et al., 2006), but not in the MeV range detected by Cos-B from 1CG327–0 (Hermsen et al., 1977). Though magnetars have been known to be the source of intense -ray flares (Hurley et al., 2005), these events are rare (only three have been detected in the past 30 years), and the maximum photon energy detected from these flares ( MeV; Hurley et al. 2005) is significantly less than the photon energies detected from 1CG327–0. As a result, we do not believe that 1E 1547.0-5408 is the X-ray counterpart of 1CG327–0. Another possibility is that 1CG327–0 is associated with G327.24-0.13, since high-energy -ray emission has been detected from some SNRs. However, the non-detection of 1CG327–0 by EGRET implies this source is variable, making any association of 1CG327–0 with the SNR candidate G327.24–0.13 unlikely. Future GLAST observations of this region should determine if 1CG327–0 is a real -ray source and, if so, if it is affiliated with 1E 1547.0-5408 or G327.24-0.13.
To summarize, in this paper we presented X-ray, near-IR, and radio observations of 1E 1547.0-5408 and of the field around it. A consistent explanation of these observation is that 1E 1547.0-5408 is a magnetar possibly associated with SNR candidate G327.24–0.13. Deeper X-ray observations of 1E 1547.0-5408 are needed to confirm its identification as a magnetar by detecting X-ray pulsations from this source, deep near-IR observations of this source are needed to discover its near-IR counterpart, and additional radio observations of G327.24–0.13 are required to determine if it is a SNR. The identification of 1E 1547.0-5408 as a magnetar candidate illustrates the importance of follow-up observations of other bright, unidentified X-ray sources in the Galactic Plane for understanding the X-ray population of the Milky Way and for discovering new members of exotic classes of neutron stars.
References
- Benjamin et al. (2003) Benjamin, R. A. et al. 2003, PASP, 115, 953
- Bock et al. (1999) Bock, D. C.-J., Large, M. I., & Sadler, E. M. 1999, AJ, 117, 1578
- Buccheri et al. (1983) Buccheri, R. et al. 1983, A&A, 128, 245
- Campana et al. (2007) Campana, S., Rea, N., Israel, G. L., Turolla, R., & Zane, S. 2007, A&A, 463, 1047
- Caswell & Haynes (1987) Caswell, J. L. & Haynes, R. F. 1987, A&A, 171, 261
- Cheng et al. (2004) Cheng, K. S., Taam, R. E., & Wang, W. 2004, ApJ, 617, 480
- Duncan & Thompson (1992) Duncan, R. C. & Thompson, C. 1992, ApJ, 392, L9
- Durant & van Kerkwijk (2005) Durant, M. & van Kerkwijk, M. H. 2005, ApJ, 627, 376
- Durant & van Kerkwijk (2006a) —. 2006a, ApJ, 652, 576
- Durant & van Kerkwijk (2006b) —. 2006b, ApJ, 648, 534
- Eracleous et al. (1991) Eracleous, M., Halpern, J., & Patterson, J. 1991, ApJ, 382, 290
- Esposito et al. (2007) Esposito, P., Mereghetti, S., Tiengo, A., Sidoli, L., Feroci, M., & Woods, P. 2007, A&A, 461, 605
- Fahlman & Gregory (1981) Fahlman, G. G. & Gregory, P. C. 1981, Nature, 293, 202
- Gaensler et al. (2001a) Gaensler, B. M., Dickey, J. M., McClure-Griffiths, N. M., Green, A. J., Wieringa, M. H., & Haynes, R. F. 2001a, ApJ, 549, 959
- Gaensler et al. (1999) Gaensler, B. M., Gotthelf, E. V., & Vasisht, G. 1999, ApJ, 526, L37
- Gaensler et al. (2005) Gaensler, B. M., McClure-Griffiths, N. M., Oey, M. S., Haverkorn, M., Dickey, J. M., & Green, A. J. 2005, ApJ, 620, L95
- Gaensler et al. (2001b) Gaensler, B. M., Slane, P. O., Gotthelf, E. V., & Vasisht, G. 2001b, ApJ, 559, 963
- Getman et al. (2005) Getman, K. V. et al. 2005, ApJS, 160, 319
- Göhler et al. (2005) Göhler, E., Wilms, J., & Staubert, R. 2005, A&A, 433, 1079
- Gotthelf & Halpern (2005) Gotthelf, E. V. & Halpern, J. P. 2005, ApJ, 632, 1075
- Götz et al. (2006) Götz, D., Mereghetti, S., Tiengo, A., & Esposito, P. 2006, A&A, 449, L31
- Green (2002) Green, A. J. 2002, in The Universe at Low Radio Frequencies, Proceedings of IAU Symposium 199, ed. A. Pramesh Rao, G. Swarup, & Gopal-Krishna (San Francisco, CA: Astronomical Society of the Pacific), 259–261
- Green et al. (1999) Green, A. J., Cram, L. E., Large, M. I., & Ye, T. 1999, ApJS, 122, 207
- Halpern & Gotthelf (2005) Halpern, J. P. & Gotthelf, E. V. 2005, ApJ, 618, 874
- Haverkorn et al. (2006) Haverkorn, M., Gaensler, B. M., McClure-Griffiths, N. M., Dickey, J. M., & Green, A. J. 2006, ApJS, 167, 230
- Helfand et al. (2007) Helfand, D. J., Chatterjee, S., Brisken, W. F., Camilo, F., Reynolds, J., van Kerkwijk, M. H., Halpern, J. P., & Ransom, S. M. 2007, ApJ, in press (astro-ph/0703336)
- Hermsen et al. (1977) Hermsen, W. et al. 1977, Nature, 269, 494
- Hurley et al. (2005) Hurley, K. et al. 2005, Nature, 434, 1098
- Ibrahim et al. (2004) Ibrahim, A. I. et al. 2004, ApJ, 609, L21
- Israel et al. (2005) Israel, G. et al. 2005, A&A, 438, L1
- Jannuzi et al. (2004) Jannuzi, B. T. et al. 2004, BAAS, 36, 1478
- Kaplan et al. (2004) Kaplan, D. L., Frail, D. A., Gaensler, B. M., Gotthelf, E. V., Kulkarni, S. R., Slane, P. O., & Nechita, A. 2004, ApJS, 153, 269
- Kaplan et al. (2002) Kaplan, D. L., Kulkarni, S. R., Frail, D. A., & van Kerkwijk, M. H. 2002, ApJ, 566, 378
- Kenter et al. (2005) Kenter, A. et al. 2005, ApJS, 161, 9
- Klose et al. (2004) Klose, S. et al. 2004, ApJ, 609, L13
- Kosugi et al. (2005) Kosugi, G., Ogasawara, R., & Terada, H. 2005, ApJ, 623, L125
- Kulkarni et al. (2003) Kulkarni, S. R., Kaplan, D. L., Marshall, H. L., Frail, D. A., Murakami, T., & Yonetoku, D. 2003, ApJ, 585, 948
- Lamb & Markert (1981) Lamb, R. C. & Markert, T. H. 1981, ApJ, 244, 94
- Leahy et al. (1983) Leahy, D. A., Elsner, R. F., & Weisskopf, M. C. 1983, ApJ, 272, 256
- Marsden et al. (1996) Marsden, D., Rothschild, R. E., Lingenfelter, R. E., & Puetter, R. C. 1996, ApJ, 470, 513
- McClure-Griffiths et al. (2001) McClure-Griffiths, N. M., Green, A. J., Dickey, J. M., Gaensler, B. M., Haynes, R. F., & Wieringa, M. H. 2001, ApJ, 551, 394
- McGarry et al. (2005) McGarry, M. B., Gaensler, B. M., Ransom, S. M., Kaspi, V. M., & Veljkovik, S. 2005, ApJ, 627, L137
- Mereghetti (2001) Mereghetti, S. 2001, in The Neutron Star - Black Hole Connection, ed. C. Kouveliotou, J. Ventura, & E. van den Heuvel (Dordrecht: Kluwer Academic Publishers), 351–368
- Mereghetti et al. (2006) Mereghetti, S. et al. 2006, A&A, 450, 759
- Muno et al. (2006) Muno, M. P. et al. 2006, ApJ, 636, L41
- Muno et al. (2007) Muno, M. P., Gaensler, B. M., Clark, J. S., de Grijs, R., Pooley, D., Stevens, I. R., & Portegies Zwart, S. F. 2007, MNRAS, L40
- Patel et al. (2003) Patel, S. K. et al. 2003, ApJ, 587, 367
- Pavlov et al. (2004) Pavlov, G. G., Sanwal, D., & Teter, M. A. 2004, in Young Neutron Stars and Their Environments, IAU Symposium no. 218, ed. F. Camilo & B. M. Gaensler (San Francisco, CA: Astronomical Society of the Pacific), 239–246
- Rea et al. (2004) Rea, N. et al. 2004, A&A, 425, L5
- Rea et al. (2005) Rea, N., Tiengo, A., Mereghetti, S., Israel, G. L., Zane, S., Turolla, R., & Stella, L. 2005, ApJ, 627, L133
- Sugizaki et al. (2001) Sugizaki, M., Mitsuda, K., Kaneda, H., Matsuzaki, K., Yamauchi, S., & Koyama, K. 2001, ApJS, 134, 77
- Thompson & Duncan (1995) Thompson, C. & Duncan, R. C. 1995, MNRAS, 275, 255
- Thompson & Duncan (1996) —. 1996, ApJ, 473, 322
- Tiengo et al. (2005) Tiengo, A., Mereghetti, S., Turolla, R., Zane, S., Rea, N., Stella, L., & Israel, G. L. 2005, A&A, 437, 997
- Vasisht & Gotthelf (1997) Vasisht, G. & Gotthelf, E. V. 1997, ApJ, 486, L129
- Vink & Kuiper (2006) Vink, J. & Kuiper, L. 2006, MNRAS, 370, L14
- Wachter et al. (2004) Wachter, S. et al. 2004, ApJ, 615, 887
- Wang & Chakrabarty (2002) Wang, Z. & Chakrabarty, D. 2002, ApJ, 579, L33
- Wang et al. (2006) Wang, Z., Kaspi, V. M., Osip, D., Morrell, N., Kaplan, D. L., & Chakrabarty, D. 2006, The Astronomer’s Telegram, 910, 1
- White et al. (1988) White, N. E., Stella, L., & Parmar, A. N. 1988, ApJ, 324, 363
- Woods et al. (2007) Woods, P. M., Kouveliotou, C., Finger, M. H., Göğüş, E., Wilson, C. A., Patel, S. K., Hurley, K., & Swank, J. H. 2007, ApJ, 654, 470
- Woods & Thompson (2006) Woods, P. M. & Thompson, C. 2006, in Compact stellar X-ray sources, ed. W. Lewin & M. van der Klis (Cambridge, UK: Cambridge University Press), 547–586
| Date | Telescope | Instruments | Exposure Time [ks] |
|---|---|---|---|
| 1980 March 12 | Einstein | HRI | 3.6 |
| 1998 February 24 | ASCA | GIS | 6.7 |
| 2004 February 8 | XMM–Newton | Mos1, Mos2, pn | 8.7, 8.7, 6.2 |
| 2006 July 1 | Chandra | Acis-I | 9.5 |
| 2006 August 22 | XMM–Newton | Mos1, Mos2, pn | 45.1, 45.1, 38.6 |
| CXOU J155054.1-541824 | XMMU J155053.7-541925 | |||
|---|---|---|---|---|
| Detector | 2004 February | 2006 August | 2004 February | 2006 August |
| Mos1 (counts ks-1) | ||||
| Mos2 (counts ks-1) | ||||
| pn (counts ks-1) | ||||
| Date | Observatory | Absorbed Flux [ ergs cm-2 s-1] |
|---|---|---|
| 1980 March 12 | Einstein | |
| 1998 February 24 | ASCA | |
| 2004 February 8 | XMM | |
| 2006 July 1 | Chandra | |
| 2006 August 22 | XMM |
| Parameter | Value | |||
|---|---|---|---|---|
| Model | phabs * pow | phabs * bremss | phabs * (pow+bb) | phabs*(bb+bb) |
| NH [cm-2] | ||||
| / | / | |||
| [kT] | ||||
| Absorbed Flux [ergs cm-2 s-1] | ||||
| Unabsorbed Flux [ergs cm-2 s-1] | ||||
| /d.o.f (reduced ) | (1.17) | (1.14) | (1.08) | (1.09) |
| Source | X-ray Flux [ergs cm-2 s-1] | Flux [ergs cm-2 s-1] | References |
|---|---|---|---|
| 1E 1547.0-5408 | |||
| SGR 1900+14 | Kaplan et al. (2002); Esposito et al. (2007) | ||
| SGR 1627-41 | Mereghetti et al. (2006); Wachter et al. (2004) | ||
| SGR 1806-20 | Rea et al. (2005); Woods et al. (2007) | ||
| Kosugi et al. (2005); Israel et al. (2005) | |||
| SGR 0526-66 | Klose et al. (2004); Kulkarni et al. (2003) | ||
| XTE J1810-197 | Halpern & Gotthelf (2005); Gotthelf & Halpern (2005) | ||
| Rea et al. (2004) | |||
| 1E 1048.1-5937 | Tiengo et al. (2005) | ||
| Wang & Chakrabarty (2002); Durant & van Kerkwijk (2005) | |||
| 4U 0142+61 | Göhler et al. (2005); Patel et al. (2003) | ||
| Durant & van Kerkwijk (2006a) | |||
| CXOU J164710.2-455216 | Muno et al. (2007); Wang et al. (2006) | ||
| 1RXS J170849.0-400910 | Campana et al. (2007); Durant & van Kerkwijk (2006b) |